Miami Beach Luxury Condo Market Report Q1 2020

May 13, 2020 May 13, 2020
CondoBlackBook.com's first quarter review of the overall luxury condo market report revealed that the year got off to a good start, in spite of the coronavirus outbreak. Year-over-year inventory levels declined, prices went down, and the days on market decreased as well. The overall market came back with positive sales volumes for Q1, except for certain Miami Beach areas.
This quarterly report on Miami Beach and its sub-neighborhoods reveals which submarkets dragged down numbers the most, impacting overall sales results. It also details how the rest of the trends fared over the first quarter and how each sub-neighborhood correlates to the overall market.
For the purposes of this report, we've included the sub-neighborhoods of South Beach, Mid-Beach, North-Beach, Sunny Isles Beach, Surfside, Bal Harbour, and Fisher Island as part of our Miami Beach grouping. Also, this luxury condo submarket report only features properties priced at $1 million and above.
Miami Beach Luxury Condo Market Q120 Highlights:
- Sales down 18.3% year-over-year - majorly influencing the decline seen in the overall sales trend for Miami, but not showing to be COVID-19 related
- 12-month trendline goes from slightly negative in 4Q19 to steep in 1Q20
- Price per sq. ft. dips 4% year-over-year, the lowest in a first-quarter since 2016
- Price per sq. ft. and Median Sales price down year-over-year
- Days on Market decline 13.4% year-over-year
- Inventory down 12.2% year-over-year
Miami Beach Sub-neighborhood Q120 Highlights:
- Fisher Island is only Miami Beach neighborhood to post a sales increase in Q1
- South Beach posts highest percentage decline in year-over-year sales (-38%), becomes biggest contributor to slowdown in Miami Beach, followed by Mid & North Beach (-34%), but also not showing to be COVID-19 related
- 12-month trendline flat for Mid/North Beach plus Surfside & Bal Harbour only - all other sub-neighborhoods negative
- Surfside & Bal Harbour grouping emerges as most expensive neighborhood of 1Q20 with a price of $1,511/sq. ft., knocking out South Beach from last quarter
- Surfside & Bal Harbour grouping posts highest percentage increase (60.7%) in Price per sq. ft. in all of Miami
- Mid/North Beach posts highest percentage drop (-29.3%) in Price per sq. ft. in all of Miami
- South Beach posts highest percentage increase (62.5%) in Days on Market
- Fisher Island posts highest percentage decrease (80.7%) in Days on Market
- Sunny Isles Beach reports second-heaviest inventory in all of Miami, behind Edgewater
- Surfside & Bal Harbour inventory closest to reaching ideal levels of balanced market
Miami Beach Luxury Condo Markets at a Glance - Q1 2020 YoY
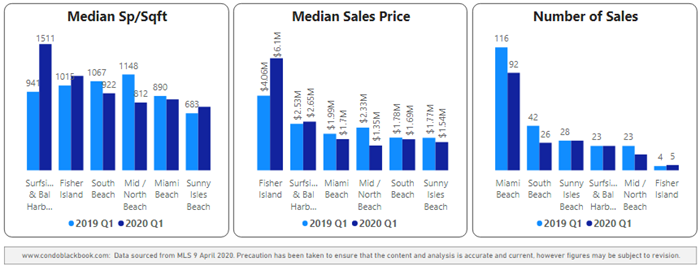
Table of Contents
- Overall Miami Beach Luxury Condo Market Trends
- South Beach Luxury Condo Market Trends
- Mid and North Beach Luxury Condo Market Trends
- Surfside & Bal Harbour Luxury Condo Market Trends
- Sunny Isles Beach Luxury Condo Market Trends
- Fisher Island Luxury Condo Market Trends
- Conclusion
Miami Beach Luxury Condo Market Summary 1Q20 - Fig. 1
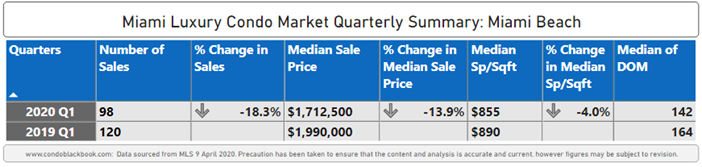
Miami Beach Luxury Condo Sales Down YoY
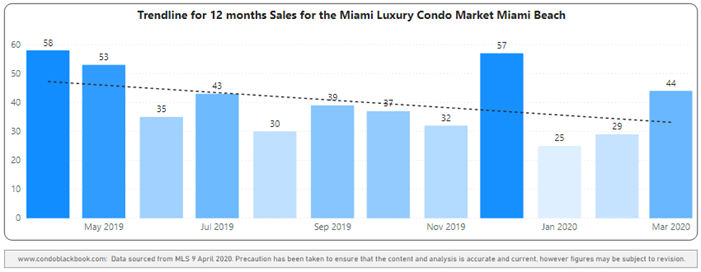
Q1 sales drop 18.3% year-over-year with negative trendline. With an 18.3% drop in year-over-year sales (fig.1), Miami Beach turned out to be the biggest contributor to the negative sales seen in the overall Miami Luxury Condo Market Report for Q1.
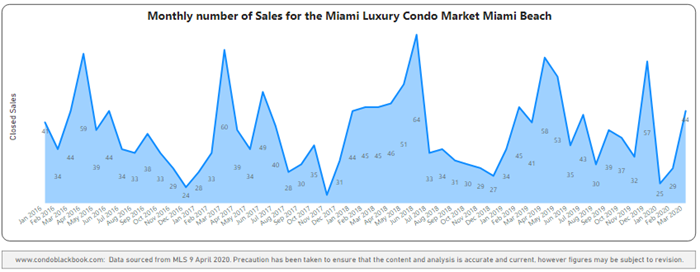
A look at fig. 2.2 below reveals that lower sales in the months of January and February resulted in this year-over-year dip. While January's sales dropped from 34 in Q1 2019 to 25 this year, February's sales dipped from 45 to 29 this year. However, March's sales managed to hold their own, increasing from 41 in the previous year to 44 this Q1, ruling out any correlation with the COVID-19 outbreak for now.
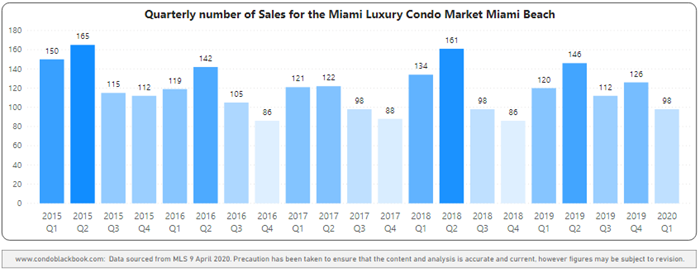
With sales dipping to their lowest in a first-quarter since 2015, especially after posting higher than normal sales in Q4, the 12-month trendline takes a steeper dive (negative) moving from Q4 2019 to Q1 2020 (fig. 2.3).
Miami Beach Quarterly Sales Heatmap 2015-2020 - Fig. 2.1
Miami Beach Monthly Sales from Jan. 2016 to Mar. 2020 - Fig. 2.2
Miami Beach 12-Month Sales with Trendline - Fig. 2.3
Luxury Condo Prices Down in Miami Beach
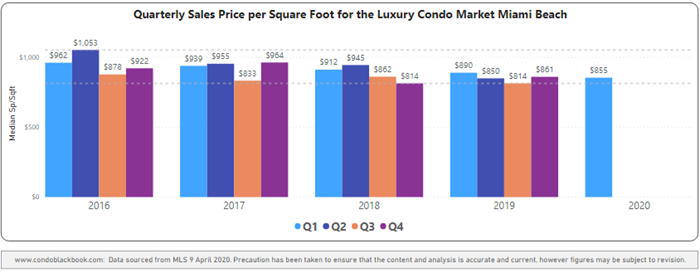
Q1 Price per sq. ft. declines 4% year-over-year. In line with the overall market trend in Miami, the Price per sq. ft. and Median Sales price declined in this combined beach district (fig. 1). The price per sq. ft. slipped 4% from $890 in Q1 last year to $855 this year. Following suit, the median sales price dropped 13.9% year-over-year, declining from $1,990,000 last year to $1,712,500 in Q1 2020.
A closer look at the five-year snapshot of quarterly prices below reveals that this quarter's price per sq. ft. trended towards the lower-end of the period under review since 2016 (fig. 3), capturing a gradual decrease in prices over the past four years.
Miami Beach Quarterly Sales Price per Sq. Ft. 2016-2020 - Fig. 3
Days on Market Down YoY in Miami Beach
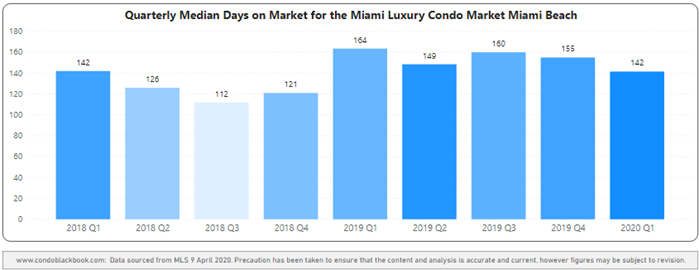
13.4% decline in year-over-year Days on Market. In line with the overall market trend, luxury condos in Miami Beach spent 22 fewer days on market compared to the same quarter in 2019 (fig. 4). On a quarter-to-quarter basis as well, luxury condos spent 13 fewer days on market. This decline is a positive indicator and shows that buyers and sellers found it easier to reach a consensus in this combined beach district over the course of the year.
Miami Beach Quarterly Days on Market 2018-2020 Heatmap – Fig. 4
Buyers Benefit with Higher Quarter-end Inventory in Miami Beach
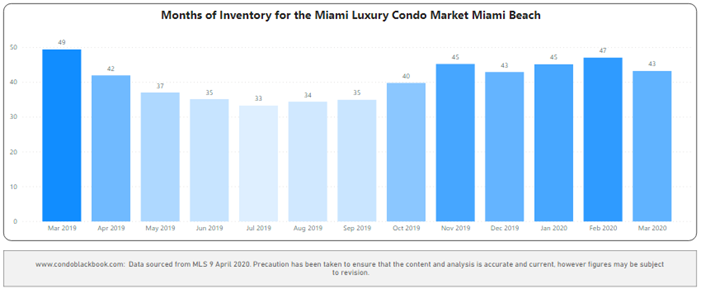
Q1 closes with 43 months of inventory. Consistent with the overall market trend in Miami, inventory in Miami Beach declines 12.2% on a year-over-year basis, decreasing from 49 months last March to 43 months this year (fig. 5).
On a quarter-to-quarter basis, however, inventory stayed flat at 43 months. With levels still way off the ideal 9-12-month benchmark of a balanced market, buyers can continue enjoying the perks of a market characterized by lower prices and ample choices in the beaches. To see what kind of luxury condos are available in Miami Beach for sale, click here.
Miami Beach Months of Inventory from Mar. 2017 to Mar. 2020 - Fig. 5
A balanced market has only 9-12 months of inventory. The months of inventory are calculated as – no. of active listings + no. of pending listings divided by the average number of deals in the last 6 months.
Miami Beach Neighborhoods: South Beach (ZIP 33139)
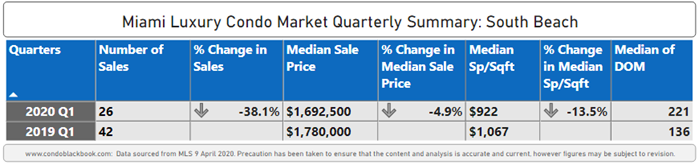
South Beach Luxury Condo Market Summary 1Q20 - Fig. 6
South Beach: Sales Down - Biggest Drop in Miami Beach & Miami Overall
Q1 sales drop 38.1% year-over-year with negative trendline. Posting the biggest percentage decline (38.1%) in year-over-year sales in Miami Beach, South Beach drags down Q1 sales performance for the entire beach grouping (fig. 1).
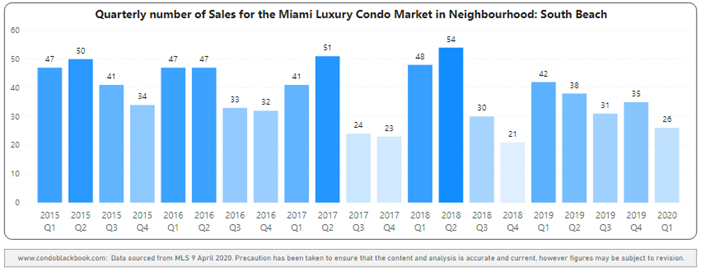
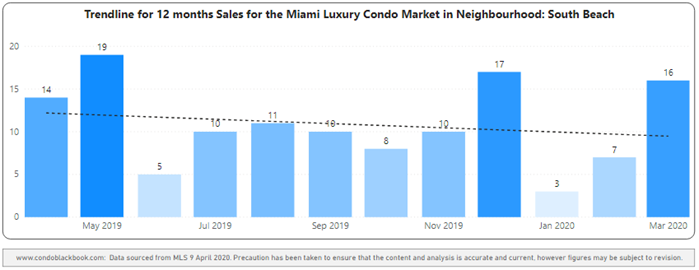
South Beach also reports the lowest sales of all the neighborhoods included in our overall review. Further, this is the lowest that sales have been in a first-quarter since 2015 for the sub-neighborhood (fig. 7.1). This drop is duly reflected in the 12-month trendline of fig. 7.2, keeping it negative from the previous quarter through to 1Q20.
South Beach Quarterly Sales Heatmap 2015-2020 - Fig. 7.1
South Beach 12-Month Sales with Trendline - Fig. 7.2
South Beach: Luxury Condo Prices Drop YoY
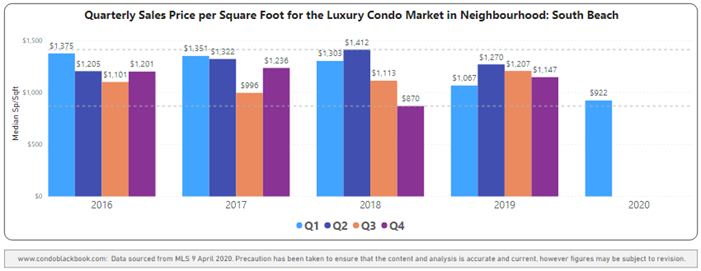
Q1 Price per sq. ft. drops 13.5% year-over-year. Moving with the overall market trend in Miami, both the Price per sq. ft. and Median Sales price dip in South Beach (fig. 6). The price per sq. ft. fell from $1,067 in Q1 2019 to $922 the same quarter this year - a dip of 13.5% year-over-year. Further, the median sales price declined from $1,780,000 last year to $1,692,500 this year - a dip of 4.9% year-over-year.
A look at the five-year snapshot of quarterly prices below further reveals that the price per sq. ft. trended towards the lower-end of the period under review for Q1 in South Beach (fig. 8).
South Beach Quarterly Price per Sq. Ft. 2016-2020 - Fig. 8
South Beach: Sharp Increase in YoY Days on Market
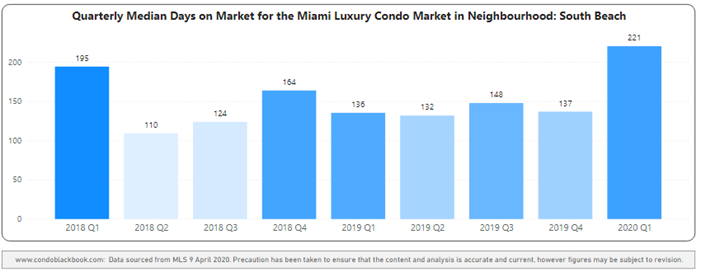
Days on Market spike 62.5% year-over-year. Going against the overall market trend in Miami, the days on market increased year-over-year as well as quarter-to-quarter in South Beach. Luxury condos spent 85 more days on market compared to the same quarter last year and 84 more days compared to the previous quarter (fig. 9). This odd spike may not necessarily be due to a deteriorating buyer-seller dialogue, but due to a sudden drop in sales volumes this quarter.
South Beach Quarterly Days on Market 2018-2020 Heatmap - Fig. 9
South Beach: Higher Quarter-end Inventory Favors Buyers
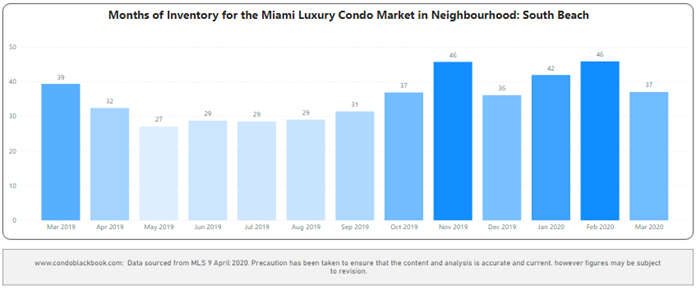
Q1 inventory closes at 37 months. In line with the overall market trend in Miami, inventory decreases 5% year-over-year in South Beach, down from 39 months last March to 37 months this year (fig. 10).
However, on a quarter-to-quarter basis, inventory stays almost flat, inching up slightly from 36 months at December-end. Since levels are way off the ideal 9-12 months of a balanced market, buyers still find favor in this desirable market and have the opportunity to drive negotiations. Browse South Beach condos for sale here to find the best deals.
South Beach Months of Inventory from Mar. 2019 to Mar. 2020 - Fig. 10
Miami Beach Neighborhoods: Mid and North Beach (ZIP 33140 & 33141)
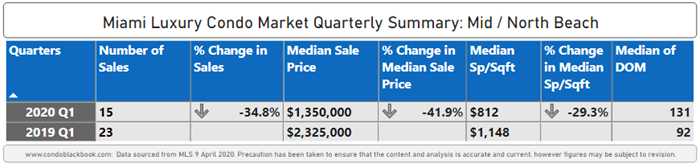
Mid-Beach and North-Beach Luxury Condo Market Summary 1Q2020 - Fig. 11
Mid-North Beach: Luxury Condo Sales Down
Sales dip 34.8% year-over-year with flat trendline. Posting the second-highest percentage decrease (34.8%) in year-over-year sales, just behind South Beach, this combined sub-neighborhood also turns out to be a major contributor to the negative sales trend seen in Miami Beach (fig. 1).
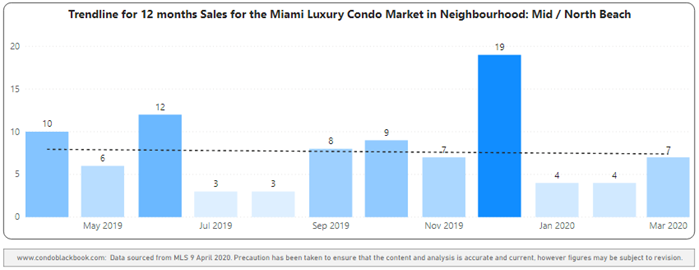
A closer look at fig. 12.1 reveals that this is the lowest the sales have been in a first-quarter for Mid-North Beach since 2015. Further reflecting this drop in sales volume, the 12-month trendline of fig. 12.2 goes from positive in Q4 2019 to flat this quarter.
Mid-Beach and North-Beach Quarterly Sales Heatmap 2015-2020 - Fig. 12.1
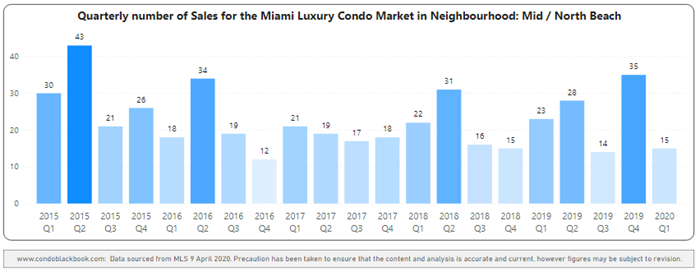
Mid-Beach and North-Beach 12-Month Sales with Trendline - Fig. 12.2
Mid-North Beach: Prices Down - Biggest Drop in Miami Beach and Miami Overall
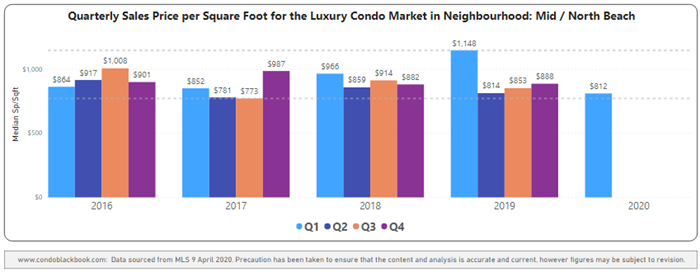
Price per sq. ft. drops 29.3% year-over-year. In line with the overall market trend in Miami, both the Price per sq. ft. and Median Sales price drop in this Mid-North Beach grouping (fig. 11). The price per sq. ft. dropped from $1,148 last year to $812 in Q1 this year - a dip of 29.3% year-over-year. Further, the median sales price decreased from $2,325,000 last year to $1,350,000 this year – a significant decline of 41.9% year-over-year. This is the highest percentage decrease seen of any neighborhood in our overall study.
A closer look at the five-year snapshot of quarterly prices below further reveals that the Q1 price per sq. ft. trended closer to the lower-end of the range for the period under review (fig. 13).
Mid-Beach and North-Beach Quarterly Price per Sq. Ft. 2016-2020 - Fig. 13
Mid-North Beach: Days on Market Up YoY
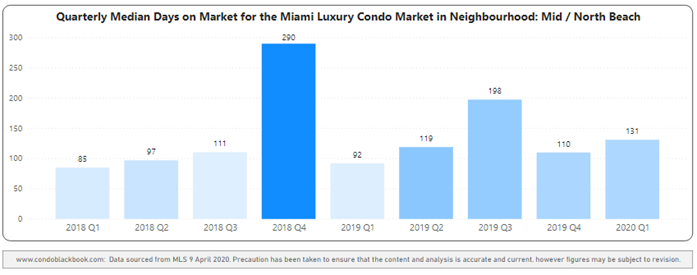
Days on market increase 42.4% year-over-year. Going against the overall market trend in Miami, luxury condos spent 39 more days on market compared to Q1 2019 and 21 more days compared to last quarter (fig. 14). This spike is more of a result of the slowdown in sales during this first-quarter, rather than buyers and sellers not seeing eye-to-eye in dealings.
Mid-Beach and North-Beach Quarterly Days on Market 2018-2020 Heatmap – Fig. 14
Mid-North Beach: Inventory Down YoY but Buyers Still in Control
Inventory down to 33 months. Consistent with the overall market trend in Miami, inventory in the combined sub-neighborhood of Mid-North Beach dropped 21.4% year-over-year and quarter-to-quarter (fig. 15). Down from last March and December-end's 42 months, levels are getting closer to reaching the ideal benchmark of 9-12 months. However, until a balance is reached, buyers retain control along with an upper hand in negotiations. To see what kind of inventory is available in these coastal districts, search North Beach and Mid-Beach condos for sale here.
Mid-Beach and North-Beach Months of Inventory from Mar. 2019 to Mar. 2020 - Fig. 15
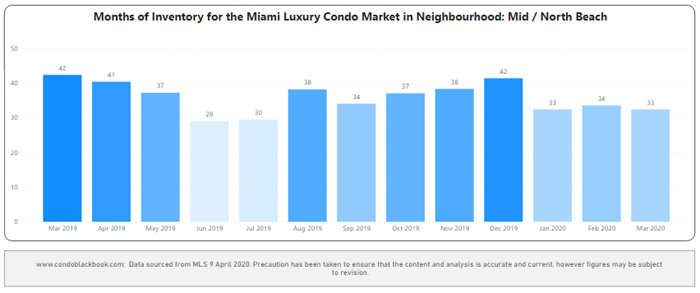
A balanced market has only 9-12 months of inventory. The months of inventory are calculated as – no. of active listings + no. of pending listings divided by the average number of deals in the last 6 months.
Miami Beach Neighborhoods: Surfside & Bal Harbour
Surfside & Bal Harbour Luxury Condo Market Summary 1Q20 - Fig. 16

Surfside & Bal Harbour: Luxury Condo Sales Stable
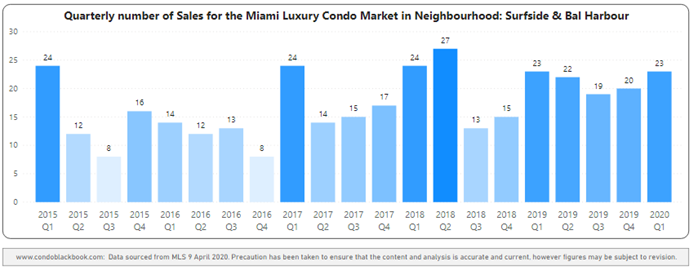
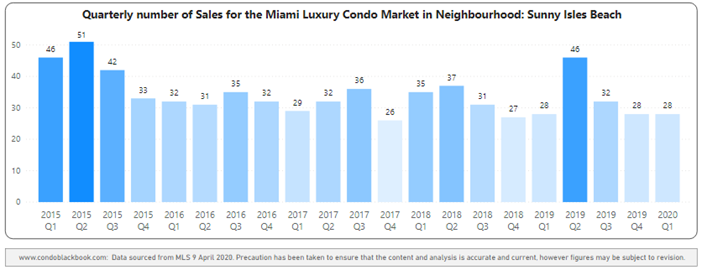
Sales stable year-over-year with flat trendline. Deviating from the overall market trend in Miami, Q1 sales duplicate year-ago figures (fig. 16). Looking at the first-quarter for the four previous years, it is worth noting that numbers have only deviated by one closed sale, showing a good opening to 2020 for this combined grouping (fig. 17.1).
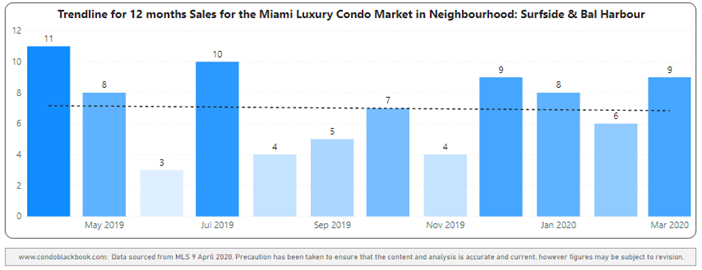
Further, the 12-month trendline in fig. 17.2 turns flat this quarter from a negative in Q4 2019, owing to this stability in sales seen in Surfside and Bal Harbour.
Surfside & Bal Harbour Quarterly Sales Heatmap 2015-2020 - Fig. 17.1
Surfside & Bal Harbour 12-Month Sales with Trendline - Fig. 17.2
Surfside & Bal Harbour: Prices Jump to Most Expensive in Miami
Surfside & Bal Harbour become most expensive in Miami with highest percentage increase in Price per sq. ft. In stark contrast to the trend of declining prices seen in the overall market report, this Surfside & Bal Harbour grouping reports the highest percentage increase of all the Miami neighborhoods included in our quarterly review.
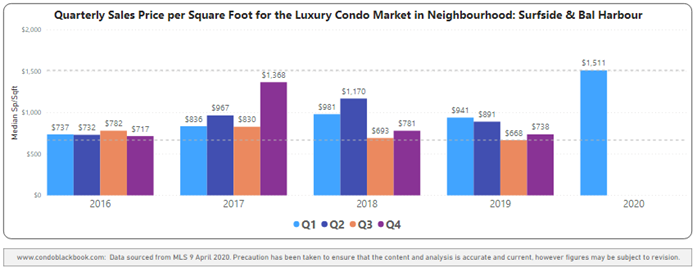
With a 60.7% year-over-year increase in its Price per sq. ft. (fig. 16), the sub-neighborhood knocked out South Beach as the most expensive in Miami. The sale of luxury properties in Surfside was the biggest contributor (70%) to this jump in prices that took the price per sq. ft. from $941 in Q1 last year to $1,511 this year (fig. 18). The Median Sales price too increased 4.7% year-over-year, going from $2,530,000 to $2,650,000.
A look at the five-year snapshot of quarterly prices below further reveals that the price per sq. ft. has jumped to the highest it's been in the last four years.
Surfside & Bal Harbour Quarterly Price per Sq. Ft. 2016-2020 - Fig. 18
Surfside & Bal Harbour: Days on Market Down YoY
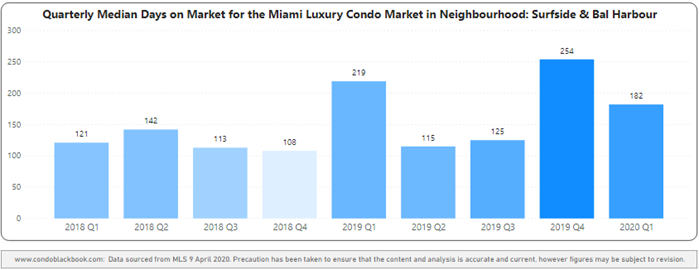
16.4% decline in year-over-year Days on Market. Moving with the overall market trend in Miami, luxury condos spent 36 fewer days compared to Q1 2019 and 72 fewer days on market compared to last quarter (fig. 19). This steep decline is a positive indicator and shows a narrowing gap between buyer and seller expectations in the grouping.
Surfside & Bal Harbour Quarterly Days on Market 2018-2020 Heatmap – Fig. 19
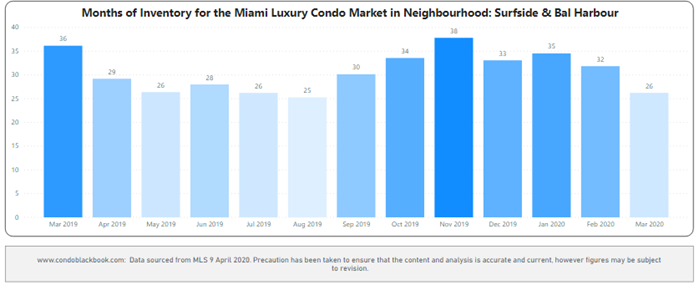
Surfside & Bal Harbour: Inventory Down to Lowest in Miami Beach
Inventory down to 26 months. With the first quarter delivering stable sales, inventory is down from December's closing of 33 months as well as March 2019's tally of 36 months (fig. 20).
In line with the overall market trend in Miami, inventory sees a drop of 27.8% on a year-over-year basis. This combined sub-neighborhood also emerges as the closest in Miami Beach to reaching the ideal benchmark of 9-12 months. It also has the second-lowest levels of inventory in all of Miami, just behind Coral Gables and Coconut Grove. Considering buyers only have a limited time to drive deals in their favor in this grouping, they can start by searching for Surfside or Bal Harbour condos for sale here.
Surfside & Bal Harbour Months of Inventory from Mar. 2019 to Mar. 2020 - Fig. 20
A balanced market has only 9-12 months of inventory. The months of inventory are calculated as – no. of active listings + no. of pending listings divided by the average number of deals in the last 6 months.
Miami Beach Neighborhoods: Sunny Isles Beach
Sunny Isles Beach Luxury Condo Market Summary 1Q20 - Fig. 21

Sunny Isles: Luxury Condo Sales Flat YoY
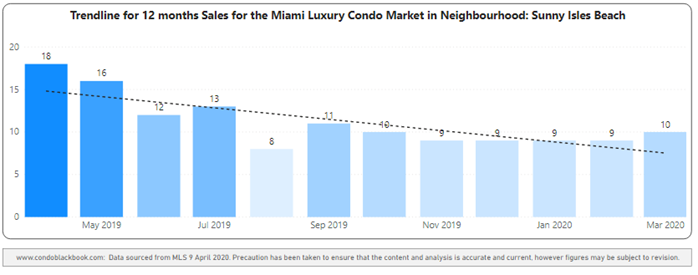
Q1 sales flat year-over-year with negative trendline. Deviating from the overall market trend in Miami of lower sales, Sunny Isles Beach reports the same number of sales as Q1 last year (fig. 21). This keeps the 12-month trendline negative moving from Q4 2019 to Q1 2020 (fig. 22.2).
Sunny Isles Beach Quarterly Sales Heatmap 2015-2020 - Fig. 22.1
Sunny Isles Beach 12-Month Sales with Trendline - Fig. 22.2
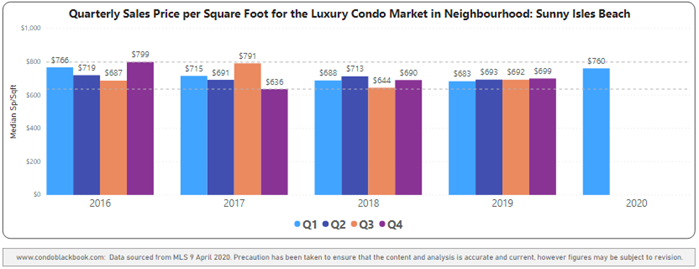
Sunny Isles: Luxury Condo Price/Sq. ft. Up YoY
Q1 Price per sq. ft. up 11.3% year-over-year. Going against the overall market trend of declining prices, luxury condos in Sunny Isles Beach report a year-over-year increase of 11.3%, bringing up the price per sq. ft. from $683 in Q1 2019 to $760 this year (fig. 21). On the other hand, the Median Sales price declines 13.1% year-over-year, reducing from $1,770,000 in Q1 2019 to $1,537,000 this year. This difference between the median price and price per sq. ft. trends could be due to the newer set of luxury condos being smaller in size, yet more amenity-rich, making them fetch a higher price per sq. ft.
A closer look into quarterly price patterns in fig. 23 reveals that Q1 closed with the highest price per sq. ft. since Q3 2017 in this Miami Beach sub-neighborhood.
Sunny Isles Beach Quarterly Price per Sq. Ft. 2016-2020 - Fig. 23
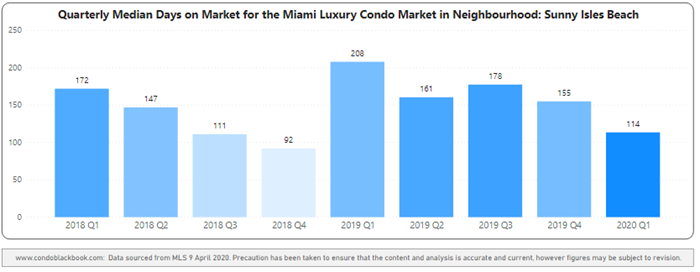
Sunny Isles: Days on Market Down YoY
45.2% decline in year-over-year Days on Market. Consistent with the overall market trend in Miami, luxury condos spent 94 fewer days on market compared to Q1 2019 and 41 fewer days compared to last quarter (fig. 24). A positive indicator, this sharp decline shows buyers and sellers found it much easier to reach a consensus in this sub-neighborhood.
Sunny Isles Beach Quarterly Days on Market 2018-2020 Heatmap – Fig. 24
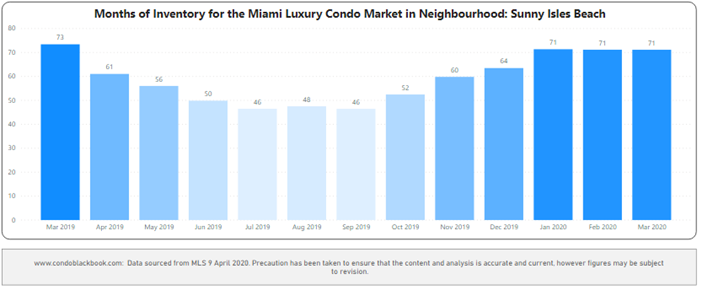
Sunny Isles: Inventory Higher by Quarter-end, Favors Buyers
Q1 closes with higher inventory of 71 months. Deviating from the overall market trend for luxury condos in Miami, Sunny Isles Beach closed the first quarter (71) with almost the same level of inventory (73) as March 2019. Staying put at 71 months through Q1, inventory was 11% higher than December-end's 64 months (fig. 25).
Sunny Isles Beach has the second-highest amount of inventory out of all the Miami neighborhoods included in our study. It's also one of only three neighborhoods (besides Brickell and Fisher Island) reporting higher quarter-to-quarter inventory in our overall study. This gives buyers a big window of opportunity to find the best deals and drive negotiations in their favor. To make the most of this opportunity, begin with a search of Sunny Isles Beach condos for sale here.
Sunny Isles Beach Months of Inventory from Mar. 2019 to Mar. 2020 - Fig. 25
A balanced market has only 9-12 months of inventory. The months of inventory are calculated as – no. of active listings + no. of pending listings divided by the average number of deals in the last 6 months.
Miami Beach Neighborhoods: Fisher Island
Fisher Island Luxury Condo Market Summary 1Q20 - Fig. 26
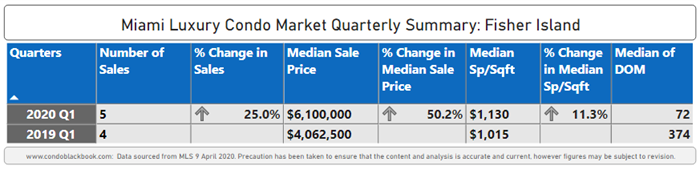
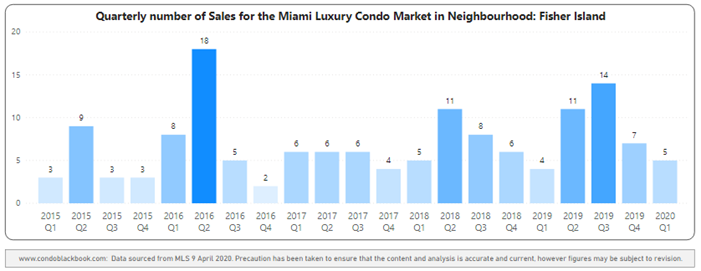
Fisher Island: Luxury Condo Sales Up YoY
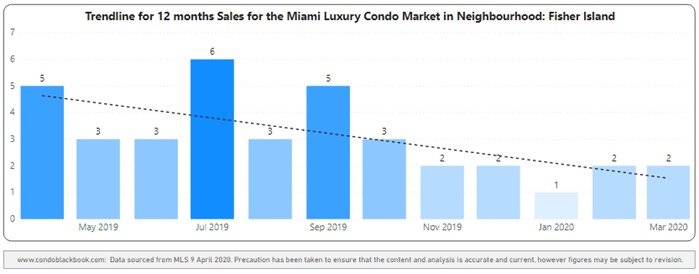
Q1 sales up 25% with negative trendline. Bucking the overall market trend in Miami, Fisher Island reports a 25% increase in year-over-year sales (fig. 26), but that is a reflection of 5 sales for quarter versus 4 for the same period last year. This is also the only sub-neighborhood in Miami Beach to report positive sales figures. However, its 12-month trendline turns negative in 1Q20 from its flat position in the previous quarter for not being able to match the momentum of higher than average sales registered in Q3 2019 (fig. 27.1).
Fisher Island Quarterly Sales Heatmap 2015-2020 - Fig. 27.1
Fisher Island 12-Month Sales with Trendline - Fig. 27.2
Fisher Island: Luxury Condo Prices Up YoY
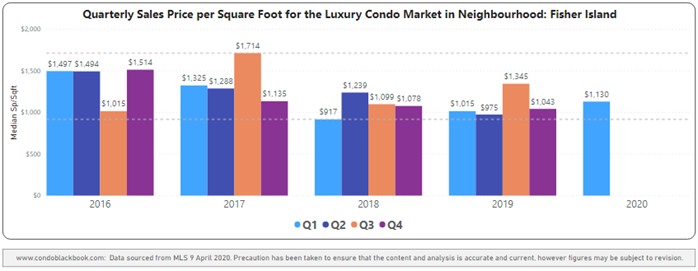
Fisher Island becomes second-most expensive in Miami with median price of $1,130/sq. ft. In contrast to the overall market trend of declining prices in Miami, Fisher Island reports an 11.3% increase in its year-over-year Price per sq. ft., going up from $1,015 last year to $1,130 in Q1 2020. The Median Sales price too takes a big leap of 50.2%, increasing from $4,062,500 in Q1 2019 to $6,100,000 this year (fig. 26).
A look at the five-year snapshot of quarterly prices below (fig. 28), further reveals that the price per sq. ft. trended close to the lower-end range of the period under review.
Fisher Island Quarterly Price per Sq. Ft. 2016-2020 - Fig. 28
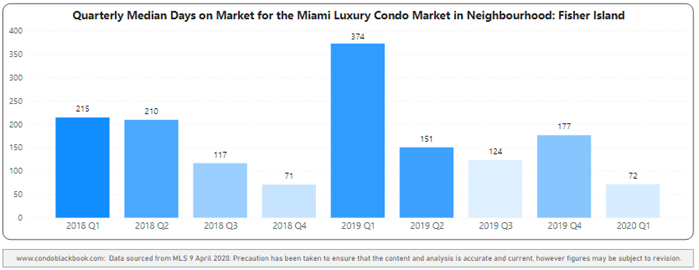
Fisher Island: Days on Market Down YoY
80.7% decline in year-over-year Days on Market. Consistent with the overall market trend in Miami, luxury condos spent 302 fewer days on market, declining from 374 days in Q1 2019 to 72 in Q1 this year (fig. 29). On a quarter-to-quarter basis too, luxury condos spent 105 fewer days on market. This sharp drop is a positive indicator and points to a closer match in buyer-seller expectations in the sub-neighborhood.
Fisher Island Quarterly Days on Market 2018-2020 Heatmap – Fig. 29
Fisher Island: Buyers Gain Advantage with Higher Quarter-end Inventory
Q1 closes with 48 months of inventory. Consistent with the overall market trend for luxury condos in Miami, inventory in Fisher Island declines 31.2% year-over-year, reducing from March 2019's 60 months. However, levels increase through the first-quarter, going up from December-end's 29 months to 48 months in March (fig. 30). This makes Fisher Island one of only three neighborhoods (besides Brickell and Sunny Isles Beach) to report a higher quarter-to-quarter inventory in our overall study. This further gives buyers the added advantage of ample time and choices to look for the best deals possible as the metric would need to settle down to its ideal 9-12 months of a balanced market. To make the most of this opportunity, begin with a search of available Fisher Island condos for sale here.
Fisher Island Months of Inventory from Mar. 2019 to Mar. 2020 - Fig. 30
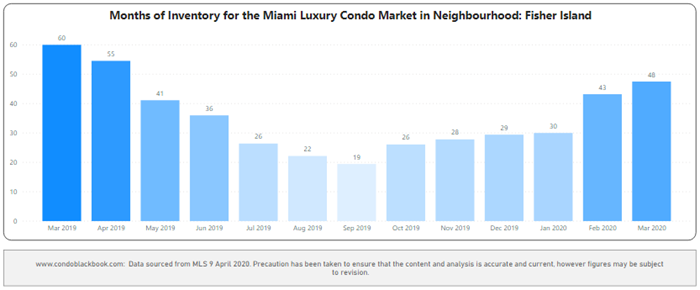
A balanced market has only 9-12 months of inventory. The months of inventory are calculated as – no. of active listings + no. of pending listings divided by the average number of deals in the last 6 months.
Conclusion
Broader trends in this Miami Beach grouping were found generally in line with those seen in the overall Miami luxury condo market report for Q1 2020.
A sub-neighborhood analysis, however, revealed certain deviations. The submarkets of Surfside & Bal Harbour, Sunny Isles Beach and Fisher Island were the only ones to report positive sales figures, going against the overall trend of lower sales. These three neighborhoods also reported higher year-over-year prices, opposed to lower prices overall. Days on market were up only in South Beach and Mid-North Beach. However, all sub-neighborhoods reported a decline in year-over-year inventory, in line with the overall trend.
As mentioned in our overall report, with this being a presidential election year and the full impact of the COVID-19 outbreak yet to be seen, we expect a delay in any sort of corrective shifts for the luxury condo market in Miami. In spite of the inventory declining for all sub-neighborhoods, buyers will continue enjoying the leverage offered by an inventory-heavy market going through 2020, and extending into the next year at least.
Love what you see? Don't forget to share our blog and subscribe (see the subscribe link on the top menu) to receive the latest market news in your inbox.
Questions or comments with the stats? Please contact Sep at sniakan (at) hbroswell.com or call 305-725-0566.
Share your thoughts with us

Your Miami Condo Awaits
Recent Posts


 (305) 697-7667
 (786) 321-7233
  contact@condoblackbook.com

