Coral Gables and Coconut Grove Luxury Condo Market Report -- Q3 2019

Nov 15, 2019 November 15, 2019
The latest from CondoBlackBook.com’s Q3 2019 report for luxury condos in Miami shows some slight shifts from the previous quarter -- while overall sales and the median sales price increased, the median price per square foot dropped and a sustained inventory surplus means we’re still in a buyer’s market. This report breaks down how the combined Coral Gables and Coconut Grove fared in the third quarter.
For the purpose of this luxury condo market report, we’ve only featured properties priced $1 million and above.
Coral Gables and Coconut Grove Luxury Condo Market Q3 2019 Highlights:
- Sales slightly short of last year’s outstanding performance
- Positive sales trendline, showing sustained market momentum
- Price per sq. ft. is lower compared to Q3 2018
- Overall inventory drops significantly
Coral Gables and Coconut Grove Luxury Condo Market Summary - Fig. 1

Slight Slip in Overall Luxury Condo Sales
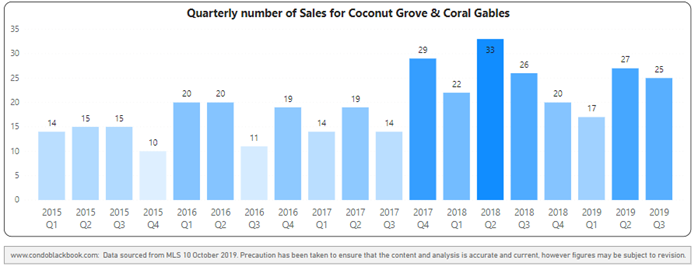
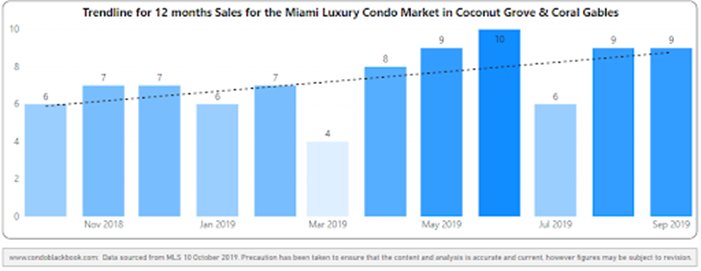
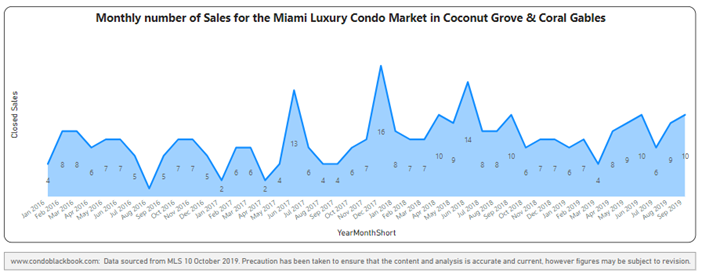
YoY sales decline marginally, but are higher than 2017, 2016 and 2015 with positive trendline. In sync with the overall market trend, sales of condos in Coconut Grove and Coral Gables decreased 7.7% against Q3 2018, but show a steady upward trendline since 2015 (see fig. 2.1). The thing to note here is that Q3 2018 had an exceptionally high level of sales compared to its previous three years. So, even though sales fell slightly year-over-year, the grouping sustained momentum because of a big jump against Q3 2017, 2016 and 2015.
September had the highest number of sales this third quarter (fig. 2.3).
Quarterly Sales Heatmap - Fig. 2.1
12-Month Sales with Trendline - Fig. 2.2
Monthly Sales from Jan. 2016 to Sep. 2019 - Fig. 2.3
Grove and Gables Luxury Condo SF Prices Down for Q3 2019
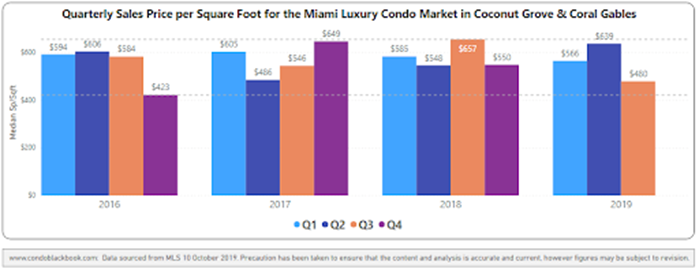
Both quarter-over-quarter and year-over-year price per sq. ft. decrease. Going with the overall market trend of reduced prices, this combined district also reports a decrease. While the median price per sq. ft. is down 24.8% from Q2 2019, it is also 26.9% lower compared to Q3 2018. Closing the quarter at a median $480 per sq. ft., prices are edging closer to the prices we have seen during years 2016-2019 (fig. 3.1).
Quarterly Price per sq. ft. 2016-2019 - Fig. 3.1
Inventory Down, But Condo Supply Surplus Still Favors Buyers
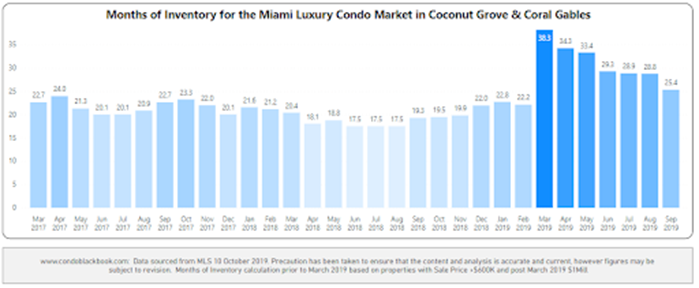
Inventory down to 25.4 months. Notably, and countering some of the price decreases, months of inventory have shown great progress, declining over the third quarter and coming down from their peak in March. At 25.4 months, inventory is down from June-end’s 29.3 months. However, it is still higher than September 2018’s 19.3 months, and way off from reaching the ideal 9-12 months of a balanced market. This gives buyers plenty of choices and opportunities to shop for the best Coral Gables or Coconut Grove condos for sale here.
A balanced market has only 9-12 months of inventory. The months of inventory are calculated as – no. of active listings + no. of pending listings divided by the average number of deals in the last 6 months.
*Starting this year, we are only considering properties priced $1 million and upwards for our luxury condo study, instead of the previous $600K benchmark. This means that, while our historical data compares to condos priced $600K and higher, starting March 2019, the numbers represent properties priced $1 million and higher only.
Months of inventory from Mar. 2017 to Sep. 2019 - Fig. 4.1
Conclusion
Collectively, the Coral Gables and Coconut Grove neighborhoods aren’t deviating much from the overall luxury condo market trends. Sales almost matched the previous year and showed strength in momentum with a positive trendline. Prices, too, declined like the majority of the neighborhoods in our study. However, moving against the overall trend was inventory that posted a good reduction this third quarter.
Still, with plenty of luxury condos sitting on the market, we continue to be in a buyer’s market. However, just like we mentioned in our overall report, if buyers keep flowing in from high-tax states, sellers provide better deals, first-time buyers take the opportunity of having historically low interest rates, and inventory keeps going down at its current rate, we can easily expect to see a more balanced market going into the second half of 2020.
For a deeper dive into the process, click here to see the data and statistics that make up this luxury condo report.
Love what you see? Don’t forget to share our blog and subscribe (see the subscribe link on the top menu) to receive the latest market news in your inbox.
Have any questions? Or see something wrong with the stats? Please contact Sep at sniakan (at) hbroswell.com or call 305-725-0566.
Cover photo courtesy of MiamiAndBeaches.com
Share your thoughts with us
Your Miami Condo Awaits
Recent Posts
