Greater Downtown Miami Luxury Condo Market Report Q4 2019

Feb 06, 2020 February 06, 2020
CondoBlackBook.com’s Greater Downtown Miami luxury condo market report for Q4 2019 shows this Miami market posting overall higher sales and higher prices, but with an increase in days on market and inventory. With metrics still in favor of buyers, data show that the overall Downtown Miami area, particularly Brickell, is seeing a trend towards stabilization. Read on to see more annual and quarterly numbers, as well as how the submarkets of Brickell and Edgewater fared individually, and contributed to the overall Miami luxury condo market numbers.
Overall Greater Downtown Miami Luxury Condo Market & Submarkets at a Glance
For the purpose of this report, we’ve included areas with the Zip codes 33129, 33130, 33131, 33132, 33136, 33137 – essentially Brickell Hammock, Brickell, Brickell Key, Downtown, Arts & Entertainment District, Edgewater, Wynwood, Midtown and the Design District. Further, this luxury condo market report only features properties priced $1 million and above.
Greater Downtown Miami Area Luxury Condo Market Highlights - Q419 and 2018-2019:
Greater Downtown
- Highest annual sales since 2016
- Highest year-over-year fourth-quarter sales since 2015
- 12-month trendline is positive
- Price/sq. ft. drops 4.1% to $630 from 2018 to 2019
- Increase in annual as well as Q4 year-over-year days on market
- Inventory rises to 65 months by year-end
Edgewater
- Annual sales decline 19%, making it the slowest growing segment of Miami
- However, Q419 sales increase, boosted by strong December
- 12-month sales trendline is still positive
- Annual Sales price (average and median) jumps more than 20%, second only to Fisher Island in our overall study of Miami neighborhoods
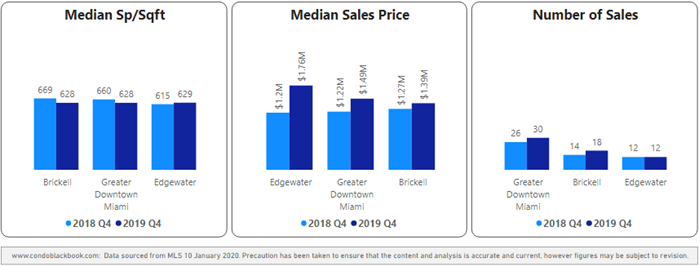
- 4Q19 YoY Median Sales Price increases more than 47% to $1.79M from $1.19M, average sales price almost doubles to $2.69M from $1.37M
- Median Price per sq. ft. stays flat YoY, while average increases
- Annual days on market trek higher, though Q4 reports year-over-year decline
- Inventory reduces to 86 months, but highest relative to all neighborhoods in our study
Brickell
- Brickell leads annual sales growth in Miami, also highest since 2016
- Q419 sales at highest since 2016
- 12-month trendline flat
- Price per sq. ft. trends lower annually and year-over-year in Q419
- No change in annual days on market, though Q419 reports year-over-year increase
- Inventory rises to 55 months
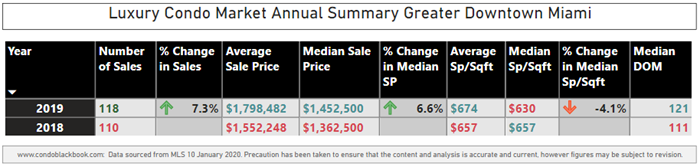
2019 Greater Downtown Miami Luxury Condo Market Summary - Fig. 1.1
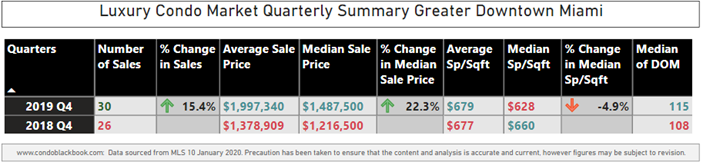
4Q19 Greater Downtown Miami Luxury Condo Market Summary - Fig. 1.2
Overall Greater Downtown Miami Luxury Condo Market Trends: Annual and Q4 YoY Luxury Condo Sales Up
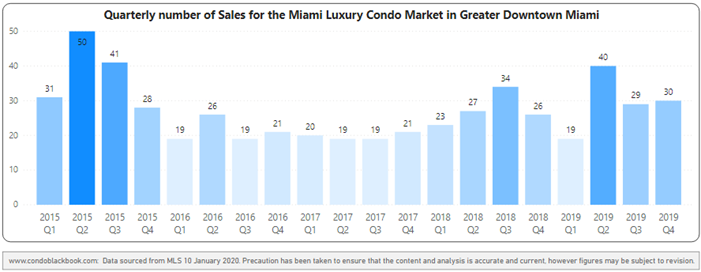
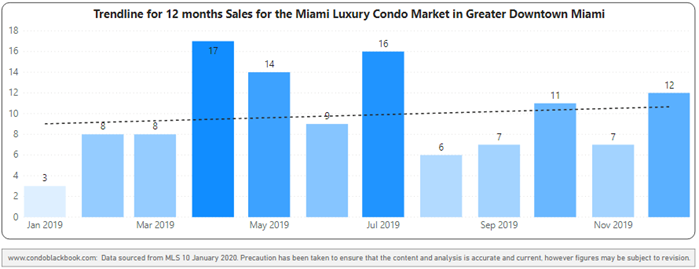
Annual sales up 7.3% with positive trendline. In line with the overall market trend in Miami, Greater Downtown reports growth in annual sales against 2018 (fig. 1.1). An exceptionally good Q2 also pushes figures past the annual trends of 2017 and 2016 (fig. 2.1). This increase in market momentum is appropriately captured by the upward sloping trendline of fig. 2.2, showing prospects of a strong opening in the first quarter of 2020.
Q4 sales increase year-over-year. Q4 2019 outperformed the same quarter last year by 15.4%, making it the best fourth quarter in terms of sales since 2015 (see fig. 1.2 and 2.1). Quarter-over-quarter, there was little change, however, in monthly terms, October and December posted strong sales.
Greater Downtown Quarterly Sales Heatmap 2015 - 2019- Fig. 2.1
Greater Downtown 12-Month Sales with Trendline - Fig. 2.2
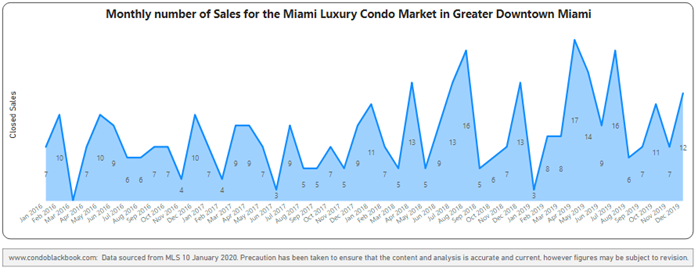
Greater Downtown Monthly Sales from Jan. 2016 to Dec. 2019 - Fig. 2.3
Annual and Q4 YoY Luxury Condo Prices Mixed
Overall Downtown Miami 2019 sales prices increase, while price per sq. ft. drops to $630. In sync with the overall market trend, Greater Downtown posted an increase in its median sales price for the year, but a drop in price per sq. ft. (fig. 1.1). So, while the sales price rose to $1.45 million in 2019 from $1.36 million in 2018 (2.3%), the price per sq. ft. fell 2.7% to settle at $630/sq. ft. This difference in trends could be due to increased sales of larger units, so even though they commanded higher prices, the median price per sq. ft. got discounted for spreading thinly over the size of the residence.
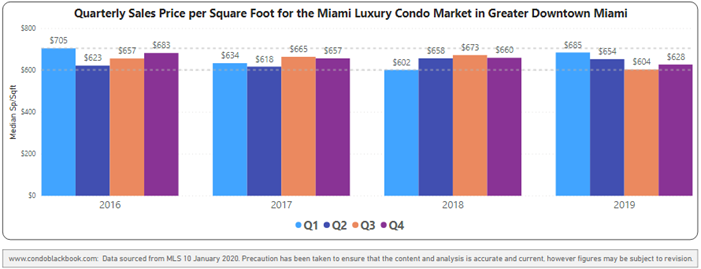
Q419 year-over-year sales price significantly up, while price per sq. ft. drops. Quarterly, the median sales price in Greater Downtown grew 22.3% compared to the same quarter last year, whereas the price per sq. ft. fell 4.9% to $628. (fig. 1.2). Looking at a four-year snapshot of quarterly prices per sq. ft., it is also worth noting that the metric closed towards the lower-end of the range (fig. 3).
Greater Downtown Quarterly Price per sq. ft. 2016-2019 - Fig. 3
Overall Downtown Miami Days on Market Increase
Annual days on market increase. Luxury condos in the Greater Downtown Miami area spent 10 days longer on the market in 2019 compared to 2018 (fig. 1.1). This is in line with the overall market trend in Miami and highlights a weaker dialogue between buyers and sellers over the year.
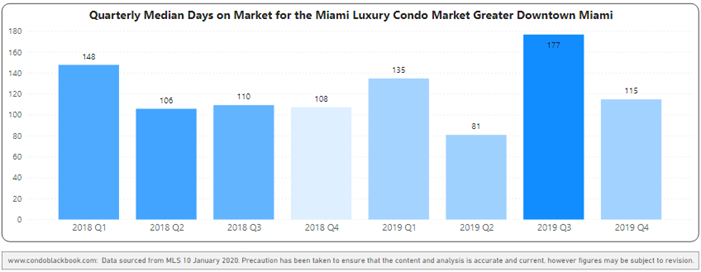
YoY days on market increase in Q419, but drop compared to 3Q19. Just like the annual trend, Q419 reports a slight increase in 7 days on market compared to the same quarter last year (fig. 1.2). However, it is worth noting that the days on market fell drastically from 177 in Q319 to 155 in Q419 (fig. 4). This indicates a major shift in towards stability, with buyers and sellers finding common ground sooner as the year came to a close.
Greater Downtown Quarterly Days on Market 2018-2019 Heatmap – Fig. 4
Higher Year-end Inventory Benefits Buyers, Again
Inventory increases to 65 months. Just like the overall market trend in Miami, inventory trekked higher towards the end of the year in this combined district (fig. 5). Increasing from 53 months at September-end to 65 months by December-end, levels are way off the 9 to 12-month benchmark of an ideal market. This benefits buyers by giving them ample time and choices as they explore the Greater Downtown Miami area here for top deals.
Greater Downtown Months of Inventory from Mar. 2017 to Dec. 2019 - Fig. 5
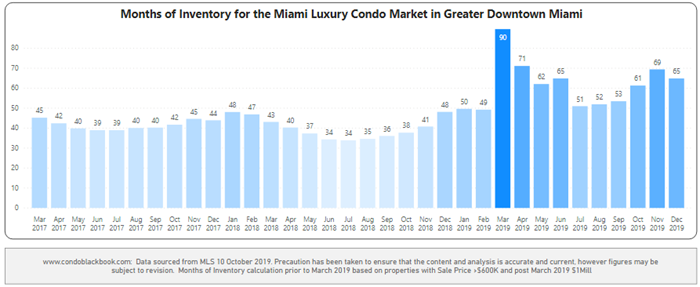
A balanced market has only 9-12 months of inventory. The months of inventory are calculated as – no. of active listings + no. of pending listings divided by the average number of deals in the last 6 months.
*Starting March 2019, we have only considered properties priced $1 million and upwards for our luxury condo study, instead of the previous $600K benchmark. This means, that while our historical data compares to condos priced $600K and higher, post March 2019, the numbers represent properties priced $1 million and higher only.
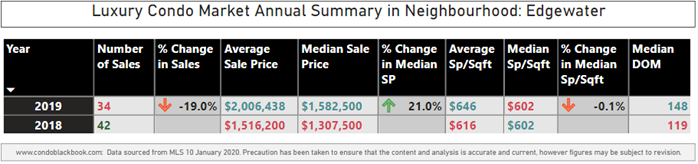
Greater Downtown Miami Neighborhoods: Edgewater Market Trends (33132 and 33137)
2019 Edgewater Luxury Condo Market Summary - Fig. 6.1
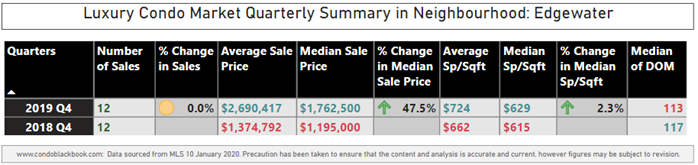
4Q19 Edgewater Luxury Condo Market Summary - Fig. 6.2
Annual Sales Down in Edgewater, Stable YoY for Q419 with Positive Outlook
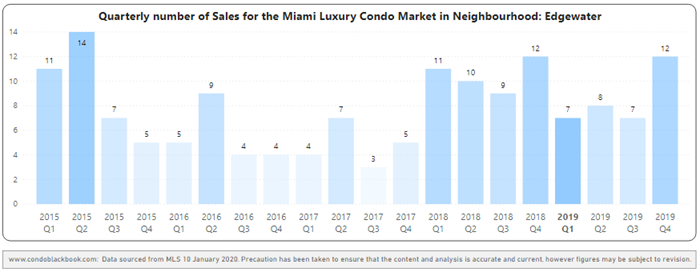
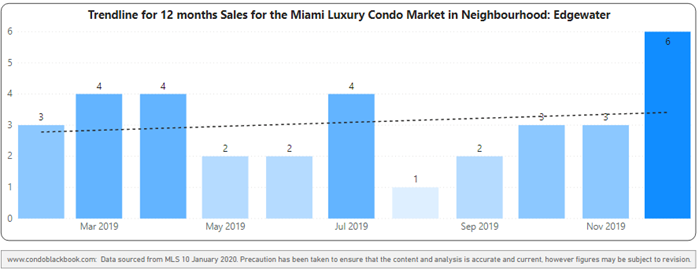
Annual sales drop, but 12-month trendline stays positive. Going against the overall market trend in Miami, Edgewater reports the sharpest decline in sales compared to the rest of the neighborhoods in our study. Sales in 2019 fell 19% against 2018 (fig. 6.1). However, a bounce back in December kept the 12-month trendline positive, indicating prospects for a better start to 2020 (fig. 7.2).
Q419 sales increase to stabilize year-over-year. Countering the annual data, and after posting lower sales in Q1 to Q3 compared to 2018, Edgewater made a 4Q19 comeback with a spike in December, almost doubling sales figures from Q3 to Q4 (fig. 7.2). This brought Q4 numbers to be at par with the same quarter last year (fig. 7.1), giving the neighborhood a positive outlook for Q1 2020.
Edgewater Quarterly Sales Heatmap 2015 - 2019 - Fig. 7.1
Edgewater 12-Month Sales with Trendline - Fig. 7.2
Edgewater Luxury Condo Prices Post Huge Gains
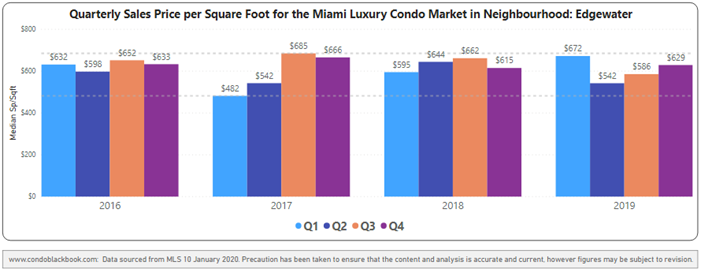
Annual sales prices increase significantly, while price per sq. ft. stays flat at $602. Contributing to the increase in overall price trends in Miami, Edgewater posts a 21% increase in its annual sales price – the second highest of all the neighborhoods in our study (fig. 6.1). The median price per sq. ft. remained flat between 2018 and 2019 at $602.
Q4 sales price and price per sq. ft. also increase year-over-year. Contributing greatly to the increase in annual numbers, prices in Edgewater reported quite the rebound in 4Q19. The median sales prices almost doubled from the same quarter last year, posting an increase of 47.5% to $1.79 million from $1.19 million (fig. 6.2). The average sales price also almost doubled to $2.69 from $1.37 million.
The price per sq. ft. not only improved 2.3% against Q4 2018, but also jumped to $629 from Q3’s $586. A four-year snapshot of quarterly prices per sq. ft. further reveals that the metric jumped from the lower ranges in Q219 to a mid-range median in Q419 (fig. 8).
Edgewater Quarterly Price per sq. ft. 2016-2019 - Fig. 8
Annual Days on Market Higher in Edgewater, Lower for Q4 YoY
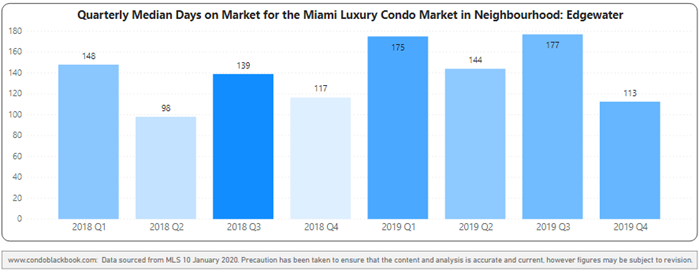
Annual days on market trends higher. Increasing from a median of 119 days in 2018 to 148 days in 2019, luxury condos spent 29 days longer on the market (fig. 6.1). In line with the overall market trend in Miami, this increase shows a slowdown in buyer-seller dialogue for the year.
Q4 days on the market decreased year-over-year. Deviating from annual trends, however, the last quarter of the year shows an improvement in buyer-seller communication. Edgewater reports a four-day decline in year-over-year days on market in Q4 as well as a steep decline compared to Q3, (see fig. 6.2 and 9), supporting an expectation of a strong first quarter for 2020.
Edgewater Quarterly Days on Market 2018-2019 Heatmap – Fig. 9
Edgewater Inventory Declining, but Still Highest in Miami
Inventory declines to 86 months. Going against the general trend of the overall market, inventory reports a steep fall by the end of the year. Dropping significantly from September end’s 103 months to December end’s 86 months, Edgewater still stands out with the heaviest amount of inventory in Miami (according to our study). This gives buyers a broad window of opportunity to control negotiations and enjoy having plenty of choices at their disposal, however, the data do show the area is poised for good valuation. If you’re interested in viewing available Edgewater condos, search what’s for sale here.
Edgewater Months of Inventory from Mar. 2017 to Dec. 2019 - Fig. 10
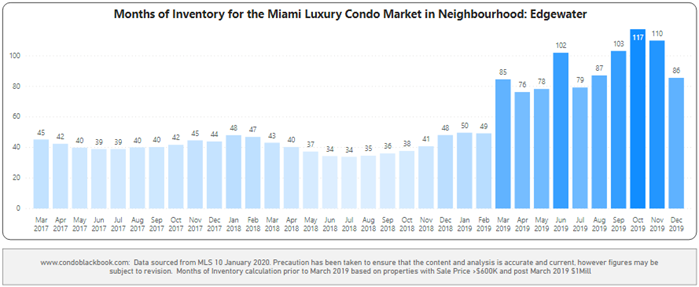
A balanced market has only 9-12 months of inventory. The months of inventory are calculated as – no. of active listings + no. of pending listings divided by the average number of deals in the last 6 months.
*As of March 2019, we’ve only considered properties priced $1 million and higher for our luxury condo study, instead of the previous $600K benchmark. This means, that while our historical data compares to condos priced $600K and higher, post March 2019, the numbers represent properties priced $1 million and higher only.
Greater Downtown Miami Neighborhoods: Brickell Market Trends (33129, 33130 and 33131)
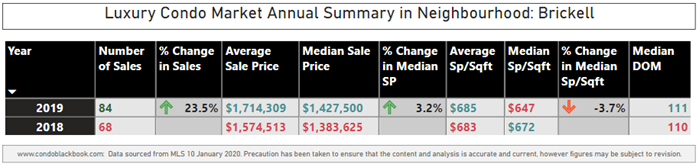
2019 Brickell Luxury Condo Market Summary - Fig. 11.1
4Q19 Brickell Luxury Condo Market Summary - Fig. 11.2

Brickell Leads Annual Sales Growth in Miami, Strong Q4
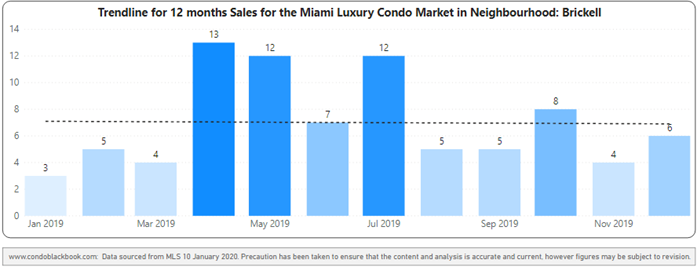
Annual sales report highest percentage growth of all Miami neighborhoods. Outperforming the overall market trend, Brickell reports the highest percentage growth in annual sales compared to all other neighborhoods in our study. The neighborhood reported a 23.5% increase over 2018 with 84 total sales (fig. 11.1), however this was largely due to an usually strong second quarter, which boosted numbers past the annual sales of 2016 and 2017 (fig. 12.1). Thus, despite good numbers, the 12-month trendline went from positive in Q3 to flat this quarter due to a decline in quarter-over-quarter sales (fig. 12.2).
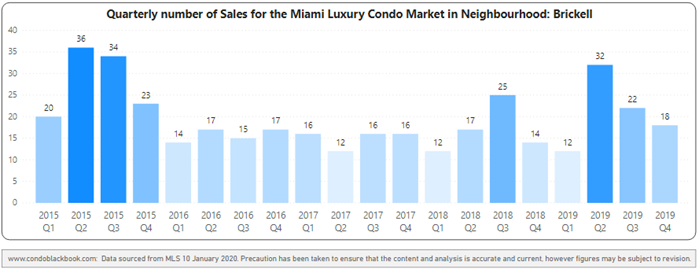
Q4 year-over-year sales post uptick. Contributing to the annual trend, sales in Q4 increased by 28.6% against the same quarter last year (fig. 11.2). This is also the highest that sales have been in a fourth-quarter since 2016 (fig. 12.2), however, quarter-over-quarter, sales fell from 3Q19 (22 sales versus 18 sales), which is typical for a fourth quarter.
Brickell Quarterly Sales Heatmap 2015 - 2019 - Fig. 12.1
Brickell 12-Month Sales with Trendline - Fig. 12.2
Luxury Condo Prices Mixed, $/Sq. Ft. Drops in Brickell
Annual sales price increases, while price per sq. ft. falls to $628. In sync with the overall Miami luxury condo market trend, the median sales price improved by 3.2% compared to 2018, while the price per sq. ft. fell 3.7% (fig. 11.1). This difference in trends could be due to more sales of larger luxury condos, so even as they commanded higher prices, the median price per sq. ft. was discounted as it spread thinly over the size of the unit.
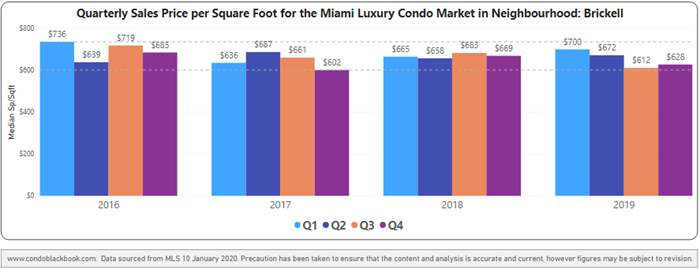
Q4 sales price increases, even as price per sq. ft. reduces. Contributing to the annual trend, the median price in Q4 increased by 9.3% year-over-year, while the price per sq. ft. fell 6.2% (fig. 11.2). Looking at a four-year snapshot of quarterly prices per sq. ft., it’s worth noting that prices are trending closer to the lower end of the range (fig. 13).
Brickell Quarterly Price per sq. ft. 2016-2019 - Fig. 13
Brickell Annual Days on Market Flat, Higher for Q4 YoY
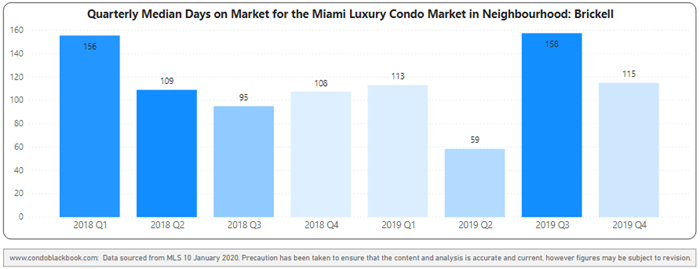
No change in annual days on market. Hovering around the median of 110 days in 2018 to 111 in 2019, there was no change in the days on market for luxury condos in Brickell (fig. 11.1). This shows that buyers and sellers were on the same page when it came to transactions during both the years.
Q4 days on market increase year-over-year. Luxury condos spent seven more days on the market in Q4 compared to the same quarter last year (fig. 11.2), perhaps indicating a slight slowdown in buyer-seller dialogue as the year came to a close (fig. 14).
Brickell Quarterly Median Days on Market 2018 - 2019 - Fig. 14
Brickell Condo Inventory Up, Favoring Buyers
Inventory increased to 55 months. In step with the overall market trend in Miami, Brickell reported an increase in inventory as the year came to a close. Increasing from September-end’s 40 months to 55 by December-end, inventory moved further away from its ideal 9 to 12-month mark of a balanced market. This gives buyers the advantage of time and choices to take their pick. To search available Brickell condos for sale, click here.
Brickell Months of Inventory from Mar. 2017 to Dec. 2019 - Fig. 15
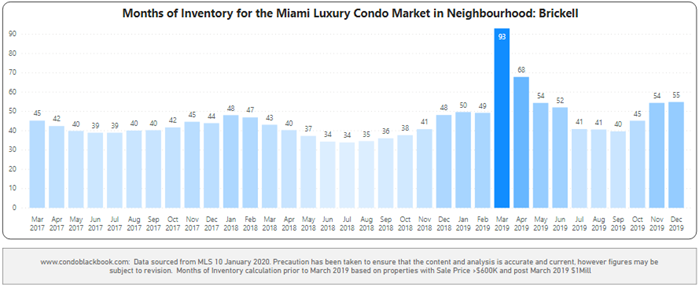
A balanced market has only 9-12 months of inventory. The months of inventory are calculated as – no. of active listings + no. of pending listings divided by the average number of deals in the last 6 months.
*As of March 2019, we have only considered properties priced $1 million and higher for our luxury condo study, instead of the previous $600K benchmark. This means, that while our historical data compares to condos priced $600K and higher, post March 2019, the numbers represent properties priced $1 million and higher only.
Conclusion
This Greater Downtown grouping (inclusive of Edgewater and Brickell) followed suit on trends seen in the overall luxury condo market in Miami, but also showed some strong signs of stabilization. It reports higher sales, days on market and months of inventory, as well as a lower price/sq. ft. compared to 2018 just like the overall market. The only deviation seen is in the 12-month trendline that kept its positive stance, as opposed to the flat trendline of the overall Miami report. Edgewater is definitely worth watching over the coming months and seems poised for growth and opportunity.
As mentioned in the overall report, the Greater Downtown market too continues to favor buyers with high amounts of inventory. However, if buyers continue flowing in from high-tax states, prices stay low, buyers take the advantage of historically low mortgage rates as well as buying options, and inventory chips away at a faster pace with not many deliveries scheduled this year, we are expecting to see signs of a corrective shift this year.
Love what you see? Don’t forget to share our blog and subscribe (see the subscribe link on the top menu) to receive the latest market news in your inbox.
Questions or comments about the stats? Interested in browsing the market? Contact Sep at sniakan (at) hbroswell.com or call 305-725-0566.
Share your thoughts with us

Your Miami Condo Awaits
Recent Posts


 (305) 697-7667
 (786) 321-7233
  contact@condoblackbook.com

