Luxury Miami Condo Market Report: Q2 2019 Report

Jul 26, 2019 July 26, 2019
- Miami Luxury Condo Market Report: Summary
- City and Neighborhood Luxury Condo Reports
Miami Luxury Condo Market Report: Summary
The half-year progress report is in, and second quarter sales have delivered on their general trend of surpassing Q1’s performance. But, was this momentum strong enough to take a big chunk of inventory off the market? Where is the market headed now? Read for details on these and more:
For the purpose of this luxury condo report, we have only considered properties priced $1 million and above. Also, properties priced $5 million and higher have been referred to as ultra-luxury.
Overall Market Highlights:
- Q2 sales outdo Q1 for majority of neighborhoods
- Brickell and Downtown further report higher sales over Q2 2018
- Overall days on market increase, showing long-listed properties finally moving
- Sale of newer/higher-end condos pushes up overall prices
- Inventory drops through Q2 for all neighborhoods except Coral Gables
- Market numbers continue to favor buyers
Q2 outperforms Q1 sales volume, but misses the mark YoY. Considered the best quarter of the year, we see Q2 volumes outperforming Q1 results for most of the neighborhoods in our study. This increase in momentum has been stronger for some neighborhoods as they reported an improvement over Q2 2017, Q2 2016 and Q2 2015. With the quarter almost delivering on its expectations, we will be keeping a close watch on the months to come to see if the market is ready to move out of this buyer-friendly mode.
Overall days on market post uptick. We see most of the neighborhoods in our study posting an increase in their days on market. This generally points to the fact that sellers that have not been able to match buyer’s price expectations previously finally relented.
Overall prices post uptrend for quarter. Even with most neighborhoods reporting a reduction in their year-over-year prices, we see the quarter-over-quarter charts move up. This metric is skewed by an increase in new construction sales (visible in fig. A.2), where such condos are inherently more expensive, and even a few such sales end up inflating overall prices.
Inventory almost matches previous year numbers. For most of the neighborhoods in our study, we see that inventory levels have almost touched (if not gone lower than) previous year levels. We will further be keeping a close watch on this metric to see if inventory goes lower than the previous year, as that will give a clearer picture on whether the excess is finally clearing out or not. Also, since most pre-construction condos have already been delivered, we do expect inventory to continue to reduce further than recent years.
Luxury Market Predictions and Analysis: Where Does the Market Go From Here?
With 2019 continuing to be in favor of buyers, here are a few factors that could (or have taken effect to) help push the market back into balance:
- High tax states keep pushing new buyers into Miami. The implementation of the SALT tax laws still continues to push a significant number of domestic buyers towards tax-saving cities like ours. Since a resident of Miami gets to save all of these taxes, we can expect to see more out-of-towners picking up a residence here.
- Better priced deals motivate buyers to act sooner. As price pressure continued for buildings built pre-2015, more buyers were motivated to get off the fence and lock in their deals. This is why most neighborhoods have reported better quarter-over-quarter sales in our study. In our opinion, if sellers continue to keep prices reasonable, we can expect sales to pick up enough momentum to help the market regain its balance.
- Inventory levels to see better momentum. Since most of the pre-construction condos have already been delivered, we expect it to get easier to chip away at the current levels of inventory. Also, with buyers influencing prices lower, owners may wish to wait out the tail end othis cycle and pull their units off the market, which could further help take down inventory.
- Recent dip in interest rates could act as a nudge. As mortgage interest rates have dropped over the course of this year, this could end up creating renewed interest in people who may have thought that they lost their only chance at nabbing historically ultra-low rates.
Below is an insight into Miami’s overall and neighborhood-level luxury condo trends for Q2 2019:
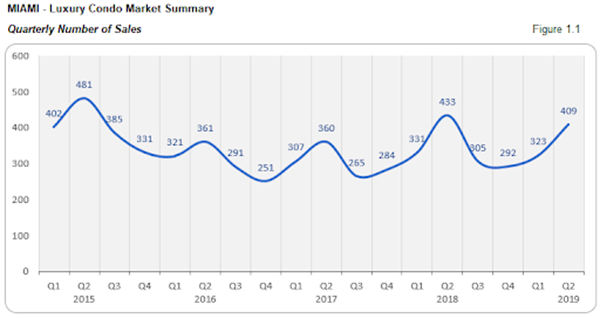
Monthly Number of Sales - Miami Luxury Condo Market Overall
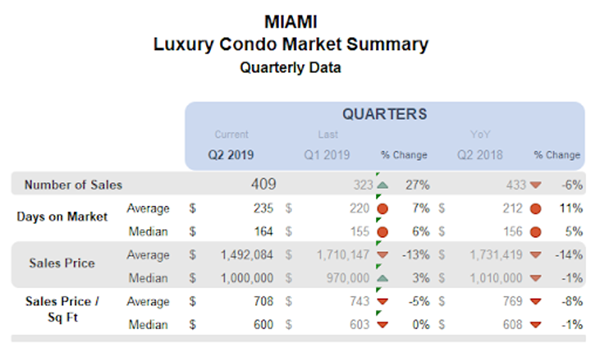
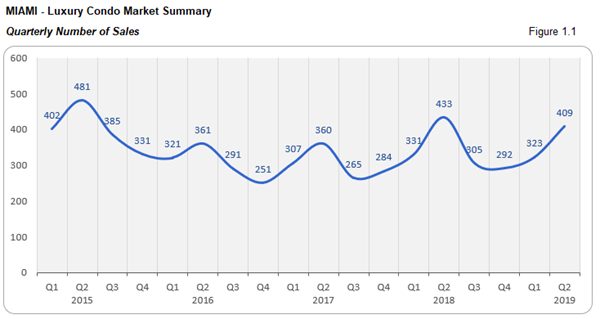
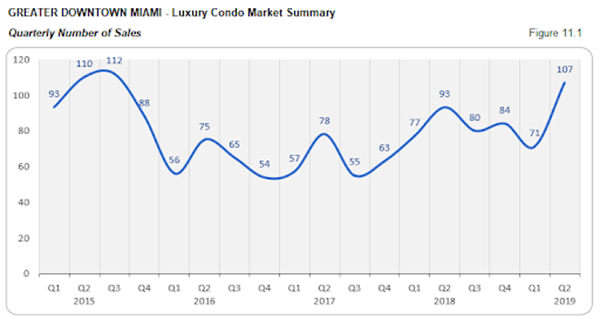
QoQ sales post 27% improvement with positive trend line, even as YoY numbers slack. Second quarter sales have historically been the best of the year, and we see the trend continuing this year as well. Overall, the luxury condo market has registered a spike of 27% over Q1 2019. So, even as Q2’s sales slacked 6% against Q2 2018, they posted a marked improvement over Q2 2017 and Q2 2016 (figure 1.1).
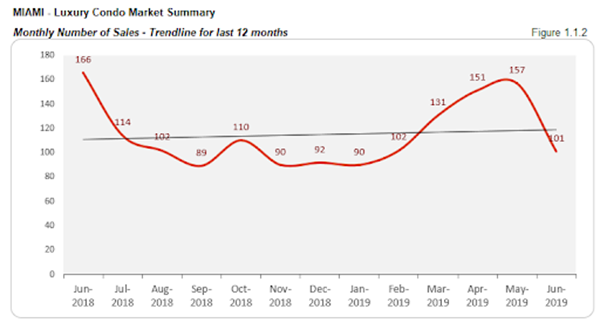
This momentum has also helped the trend line in figure 1.1.2 stay positive, which had been maintaining a negative slope over the past couple of quarters. Hopefully, the positive trend continues into the next half of the year, and the luxury condo market can regain its balance by mid-2020.
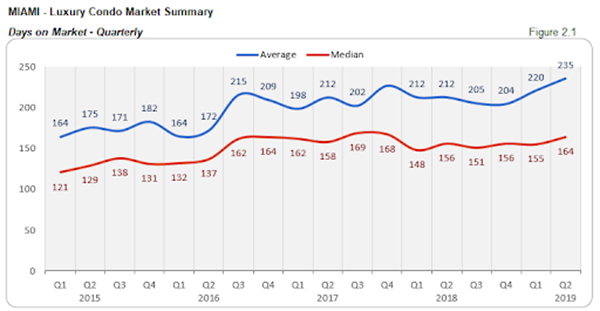
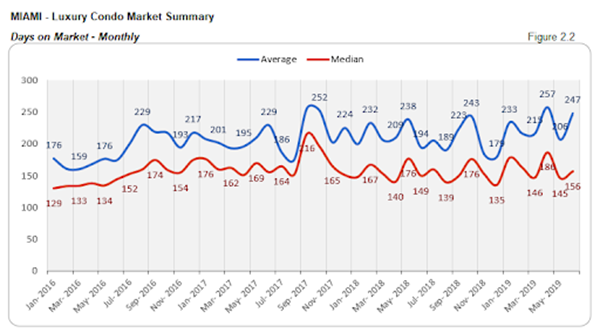
Days on Market - Miami Luxury Condo Market Overall
"Days on market" are the total number of days from when a property is active to the day it goes under contract.
Uptick in QoQ and YoY numbers shows buyer apprehension. Overall, luxury condos spent 8 days longer on the market compared to the same quarter last year, this is the highest days on market since Q4 2017 (figure 2.1). The increase in the metric goes on to show that plenty of buyers are still sitting on the fence, waiting to see where the market settles before they can jump in. It also may be signaling that sellers who have had their units on the market a long time are finally relenting and making deals.
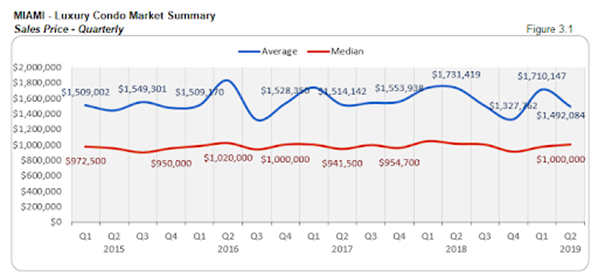
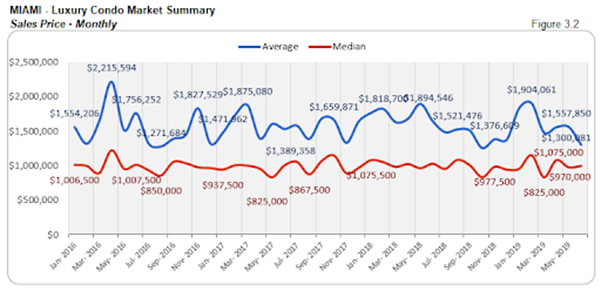
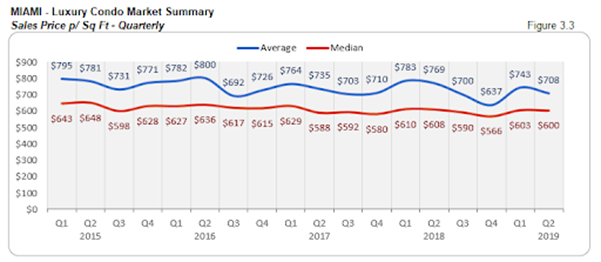
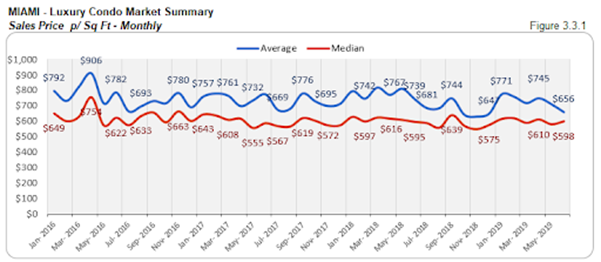
Sales Price Trends - Miami Luxury Condo Market Overall
Overall prices hover. In our year-over-year analysis, we see that the median prices for the luxury condo market in Miami have more or less stayed put. There is only a 1% decline in the median price (fig. 3.1) and price per sq. ft. (fig. 3.3) compared to the same quarter last year. Closing the quarter at $600 per sq. ft. overall, it’s easy to see how the current buyer’s market has continued to exert its pressure on negotiations.
Below is a detailed analysis of how prices added up on the basis of age of construction for luxury condos in Miami.
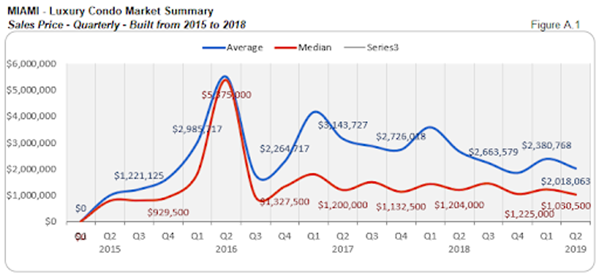
Sales Price Trends considering Building year - Miami Luxury Condo Market Overall
BUILDINGS (2015 to 2018)
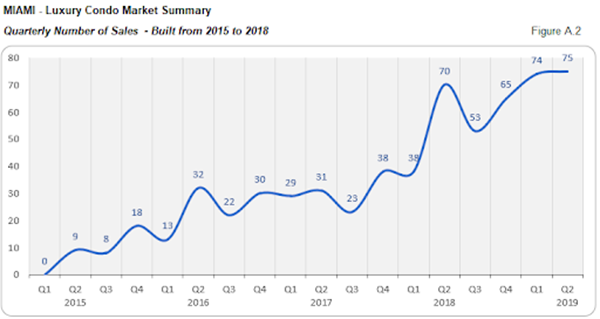
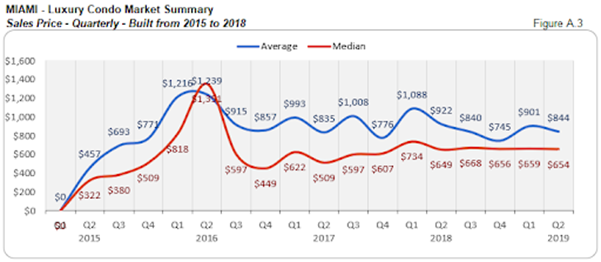
YoY price per sq. ft. increases for luxury condos built 2015 to 2018. As the sales of luxury condos built 2015-2018 went up from 70 in Q2 2018 to 75 in Q2 2019, we see that the price per sq. ft. also moved in tandem (figure A.2). The median price per sq. ft. for such condos went up from $649 in Q2 2018 to $654 in Q2 2019 (figure A.3).
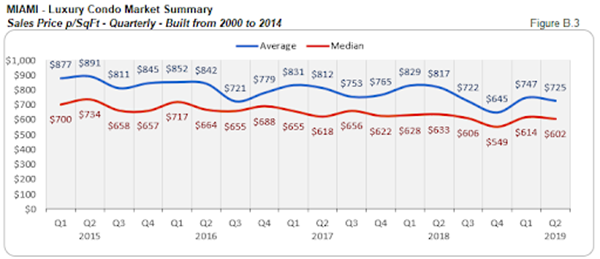
BUILDINGS from 2000 to 2014
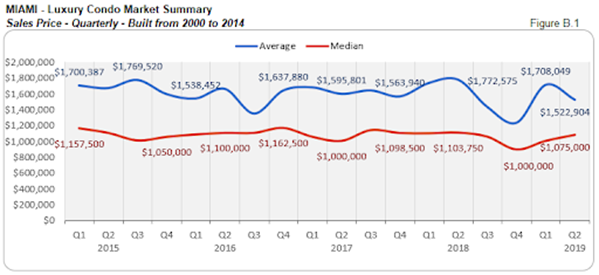
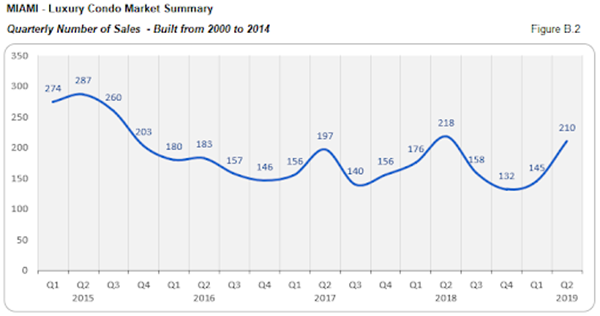
YoY price per sq. ft. dips for luxury condos built 2000 to 2014. Fig. B.3 clearly shows how the median price per sq. ft. dropped significantly from last year’s $633 to $602 this quarter, despite an increase in sales volume (figure B.2).
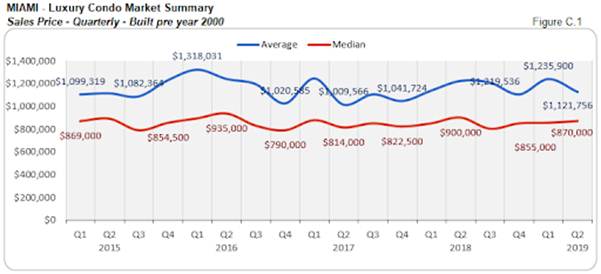
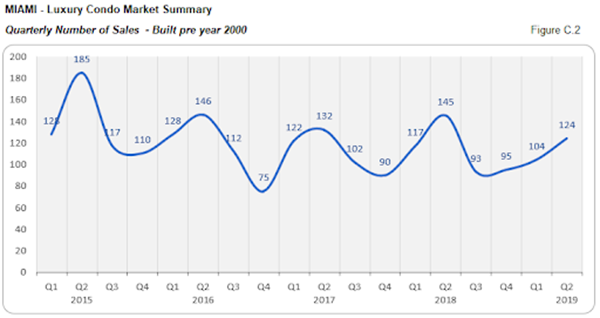
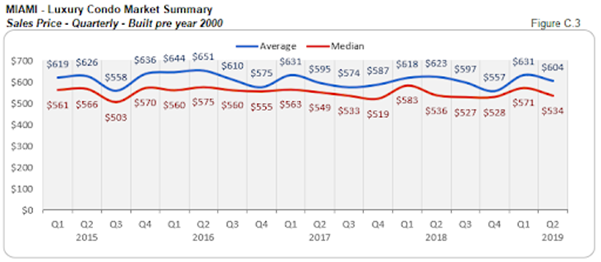
BUILDINGS from 1999 and older
YoY price per sq. ft. slips for luxury condos built pre-2000. The year-over-year sales volume (fig. C.2) and price per sq. ft. declined for condos built before 1999. The median price per sq. ft. closed at $534 for the second quarter, which is marginally lower than last year’s $536.
End of year built report
Inventory Trends - Miami Luxury Condo Market Overall
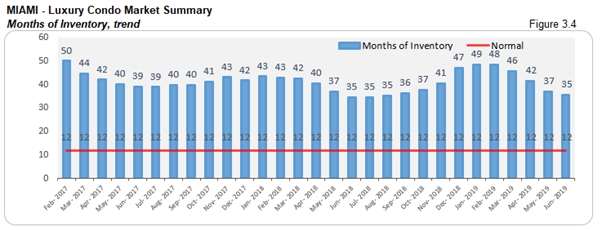
A balanced market will only have 9-12 months of inventory. The months of inventory are calculated as – no. of active listings + no. of pending listings divided by the average number of deals in the last 6 months.
*From this year, we are only going to consider properties priced $1 million and upwards for our luxury condo study, instead of the previous $600K benchmark. This means, that while the historical data featured in our inventory charts compares to condos priced $600K and above, starting January 2019, our numbers only represent properties priced $1 million and higher.
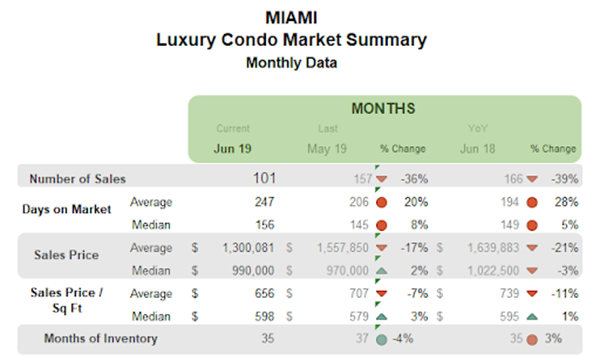
Inventory deflates to previous year numbers. Looking at figure 3.4 below, we see a consistent decline in the months of inventory over this second quarter. Q2’s 35 months are almost at par with Q2 2018 numbers, along with being much lower than Q1’s closing of 46 months. However, the metric has a long way to go to reach its ideal 9 to 12 months of a balanced market. This indicates that buyers still have the upper hand in negotiations and that the market will continue to be buyer-friendly for the rest of the year, at least.
City and Neighborhood Market Reports
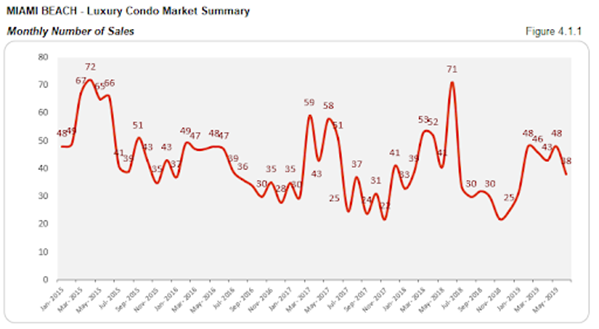
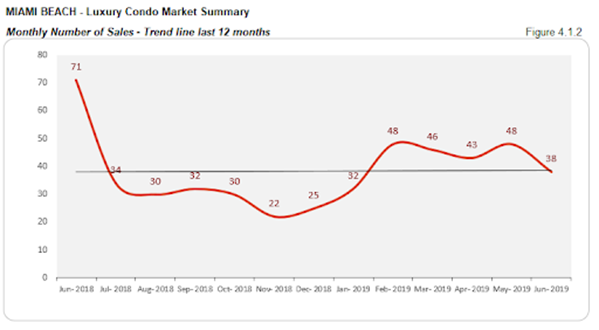
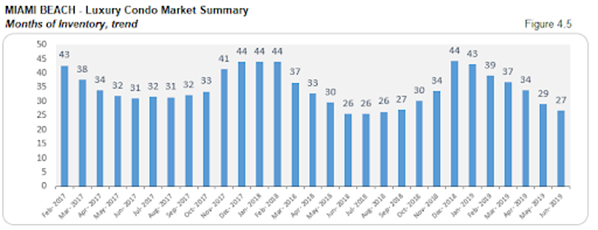
Miami Beach Luxury Condo Market Summary

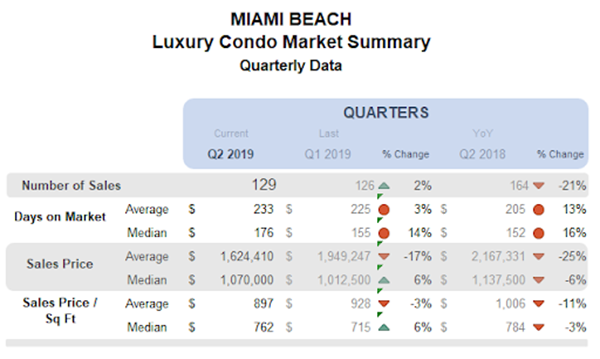
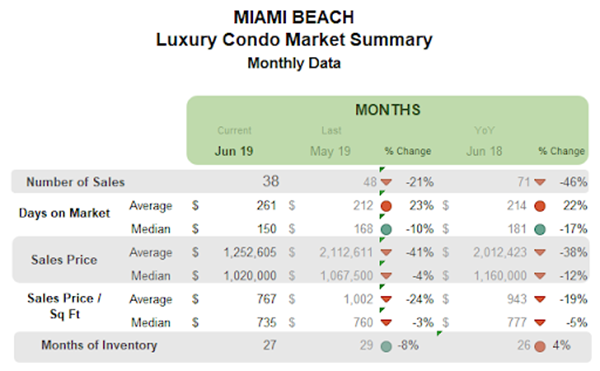
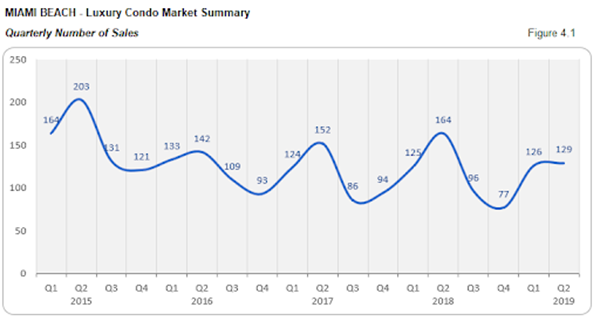
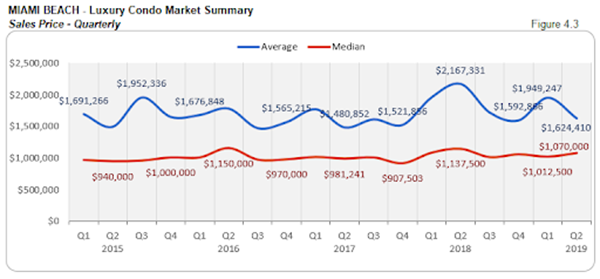
QoQ sales up marginally with flat trend line, even as YoY numbers take a hit. Overall, the luxury condo sales report for Miami Beach came back with a 21% decline year-over-year. Further looking into figure 4.1, we also notice that this is the weakest second quarter since 2015, as it has the lowest recorded sales for the period under review.
However, the coastal neighborhood does post a 2% improvement over Q1 2019, which is perhaps the only reason why we see a flat trend line in figure 4.1.2 (that had been on a negative curve for the past couple of quarters).
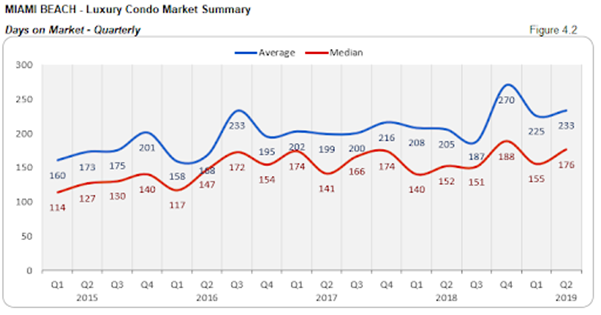
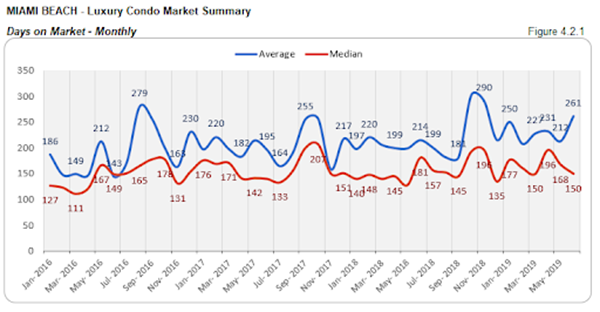
Days on market inch up QoQ and YoY. Luxury condos spent 21 more days on the market compared to Q1 2019 and 24 more days in comparison to the same quarter last year. This increase indicates that buyers and sellers found it tougher to see eye to eye on negotiations in Miami Beach.
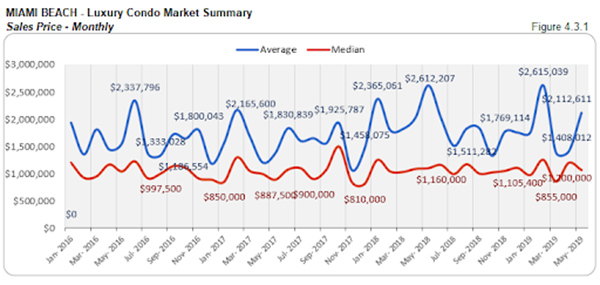
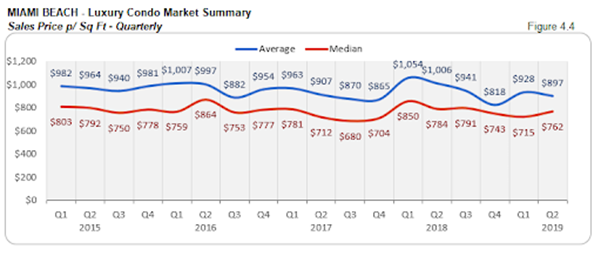
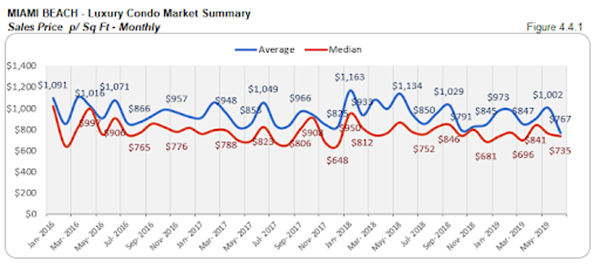
QoQ prices bump up, but remain 6% lower YoY. We see that even though the median sales price has declined year-over-year, it posts a 6% increase over the first quarter of 2019. This could be due to a couple of sales of newer or higher-end luxury condos that tend to nudge up prices. With this, the quarter closes at a median price of $762 per sq. ft. in Miami Beach. (see fig. 4.3, 4.3.1, 4.4 and 4.4.1 below)
Inventory descends over Q2, cutting it close to previous year numbers. Miami Beach posts a sharp and constant decline over the second quarter in its months of inventory. This helps close Q2 at 27 months, which is 27% lower than Q1’s closing of 37. However, the metric is still a tad higher than the previous year’s 26 months and far from reaching its ideal 9 to 12 months of inventory. This gives buyers plenty of time and opportunity to bargain for deals as they search Miami Beach condos for sale here.
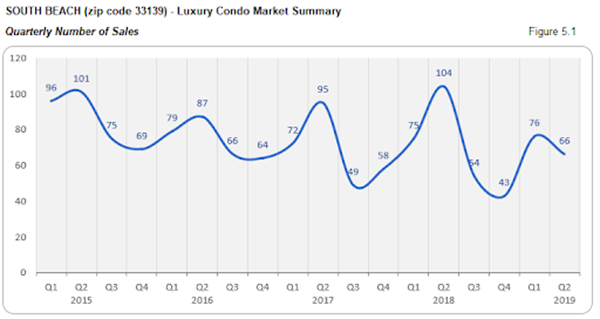
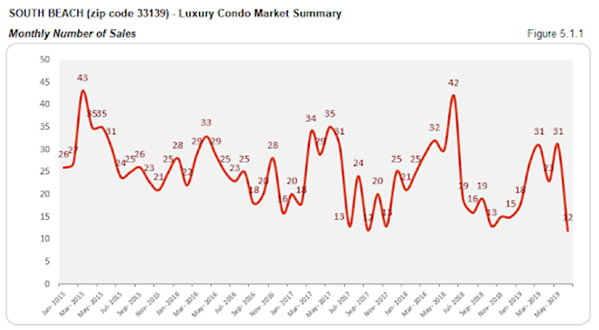
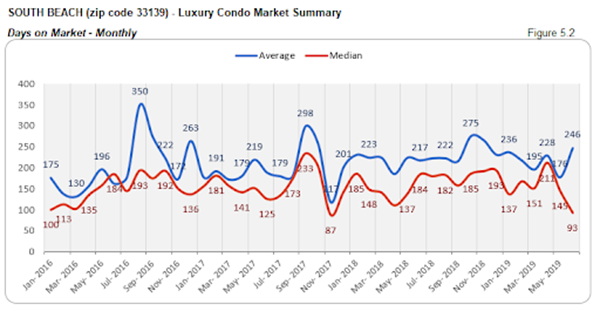
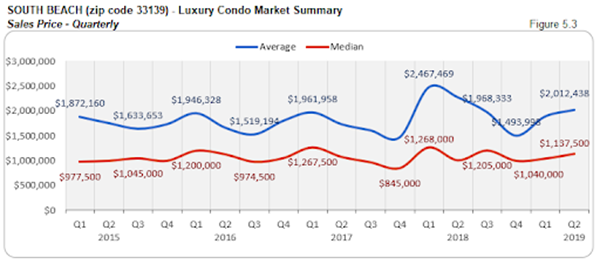
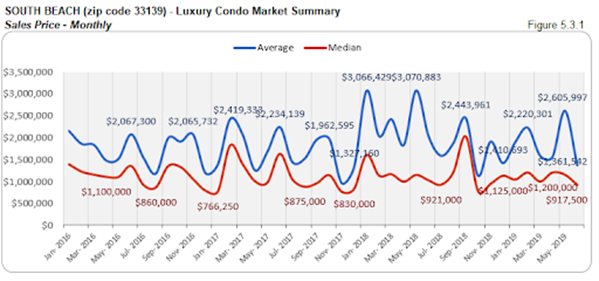
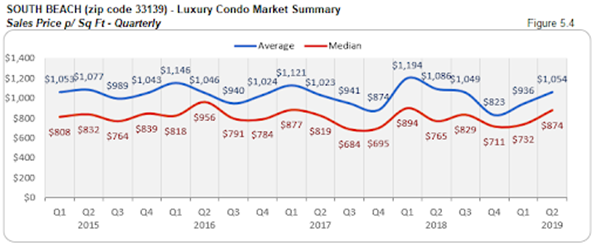
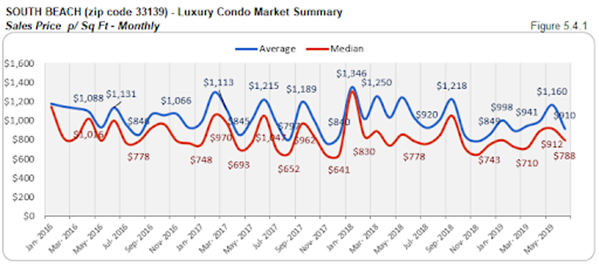
South Beach Luxury Condo Market Summary (33139 zip)
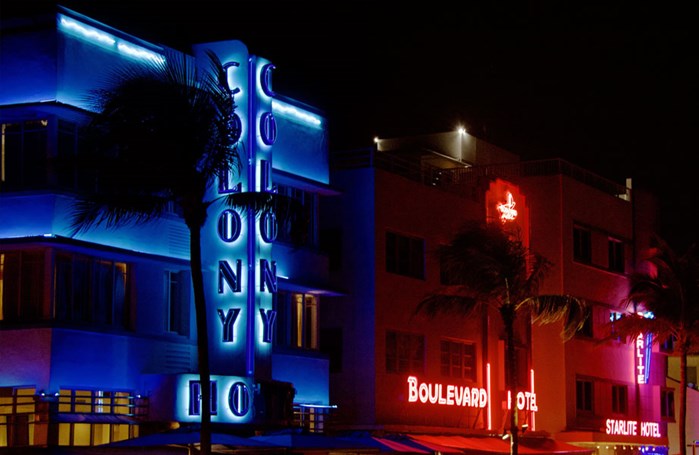
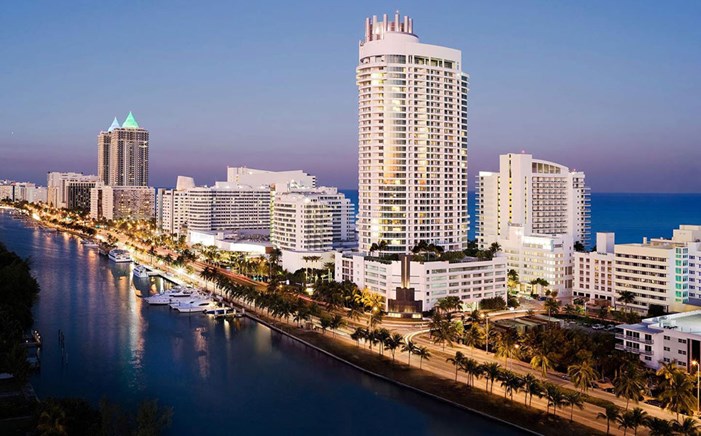
Ocean Drive, South Beach Florida. Photo credit: Valerie
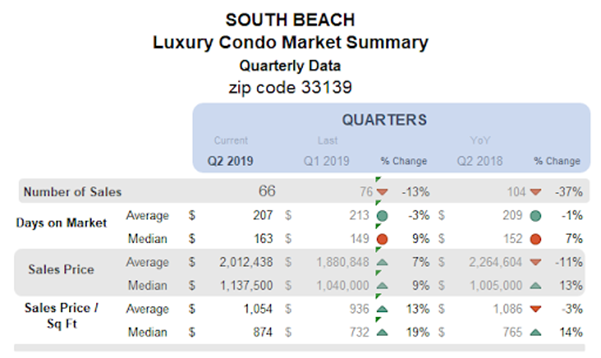
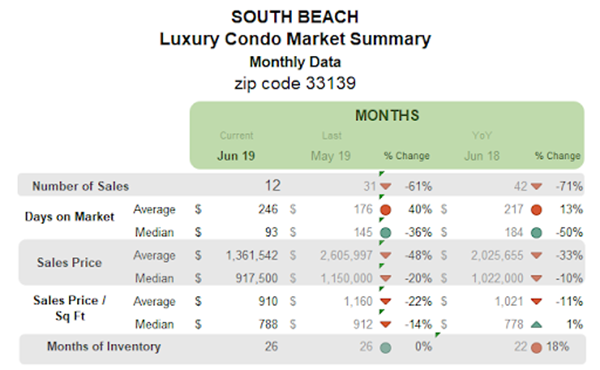
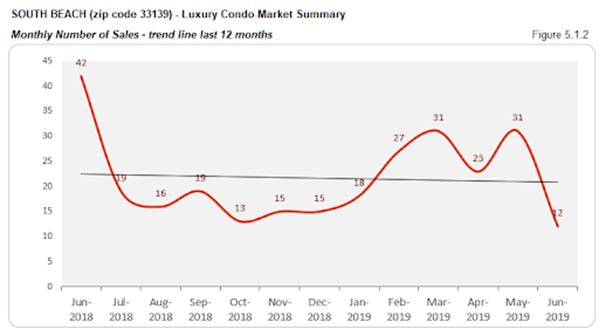
QoQ and YoY sales decline with negative trend line. Even though the second quarter has historically proven to be the best of the year, we see a 13% decline in sales compared to Q1 2019 in South Beach. There is also a 37% decrease to report over the same quarter last year. This slack in numbers is further reflected in the negative sloping trend line of figure 5.1.2.
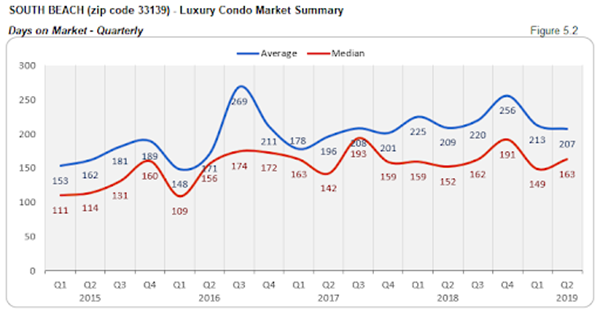
Days on market post QoQ and YoY uptick. Luxury condos spent 14 more days on the market compared to Q1 2019, and 11 more days (on median) compared to the same quarter last year. This goes on to show a slower dialogue between buyers and sellers in South Beach.
Prices nudge higher QoQ and YoY. The luxury condo market in South Beach reports an increase in its median sales price despite a slowdown in sales. There is a 9% surge over Q1 2019, and 13% increase over the same quarter last year. This could perhaps be due to the sale of newly constructed or ultra-luxury condos in the area. With this, the quarter closed at a median price of $874 per sq. ft. (see figure 5.3, 5.3.1, 5.4 and 5.4.1 below)
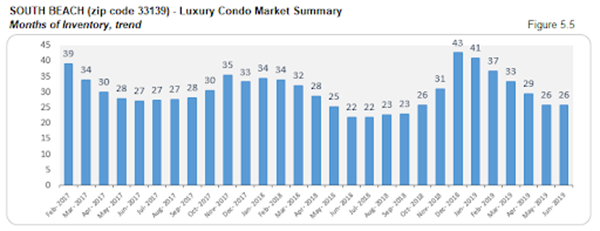
Inventory declines QoQ, but still more than the previous year. This second quarter reports a 21% decline in inventory against March’s closing of 33 months. The metric is now much lower than the peak of December 2018. However, even at 26 months, we see that inventory is 18% higher than same time last year and far from its ideal benchmark of 9 to 12 months. This gives buyers a broad window of opportunity to look for deals as they search South Beach condos for sale here, or take a tour of the neighborhood here.
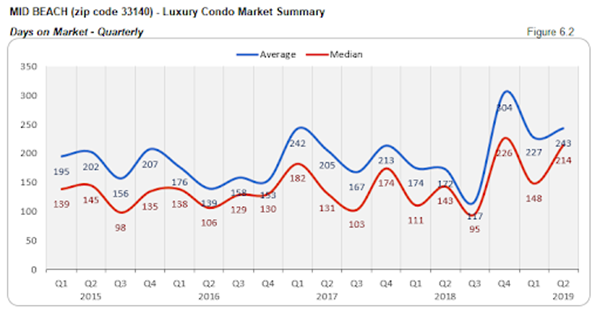
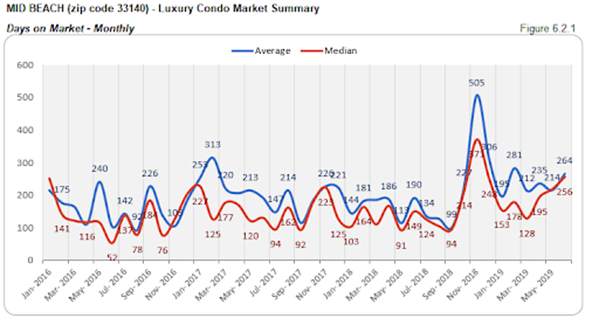
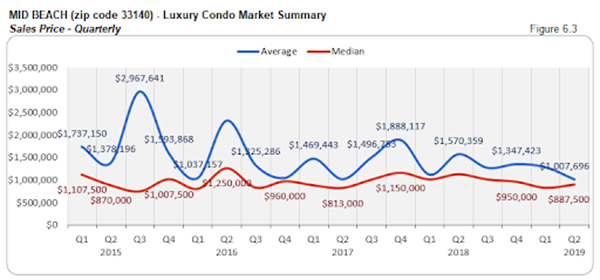
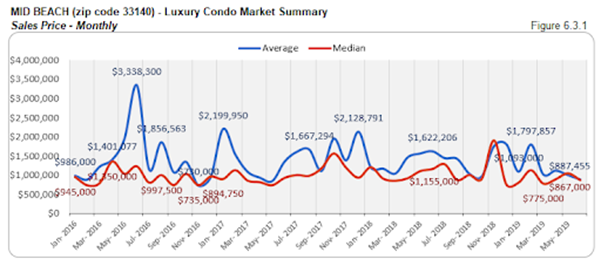
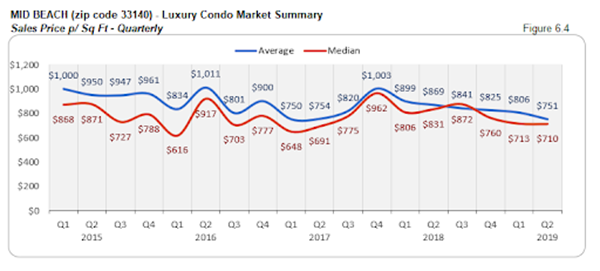
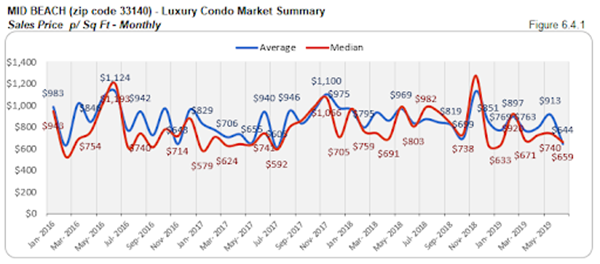
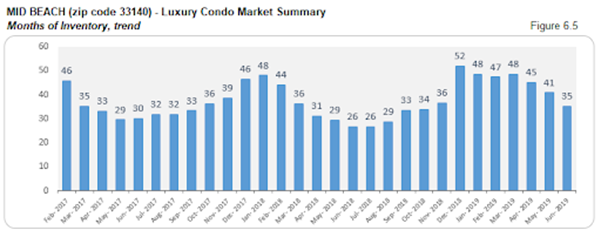
Mid-Beach Luxury Condo Market Summary (33140 zip)
Marina at Fountainebleau, Mid-Beach FL. Photo credit: Miamiandbeaches.com
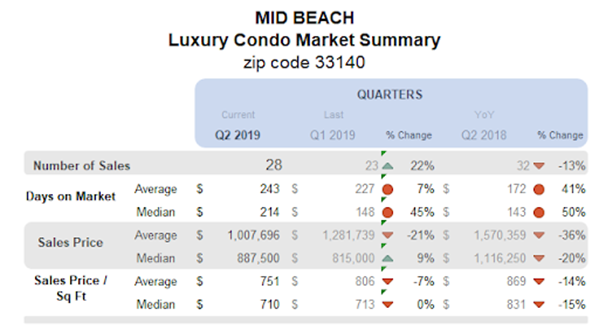
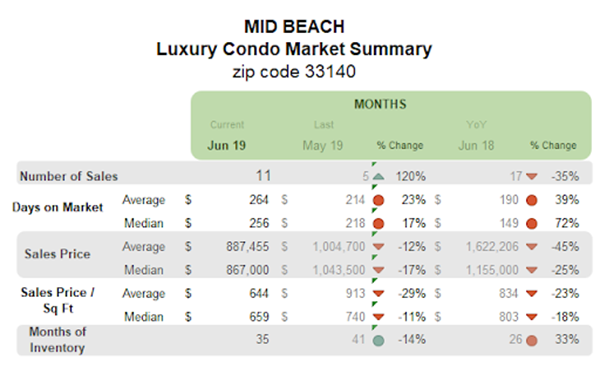
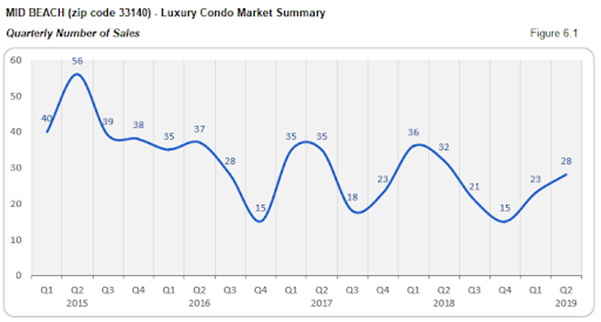
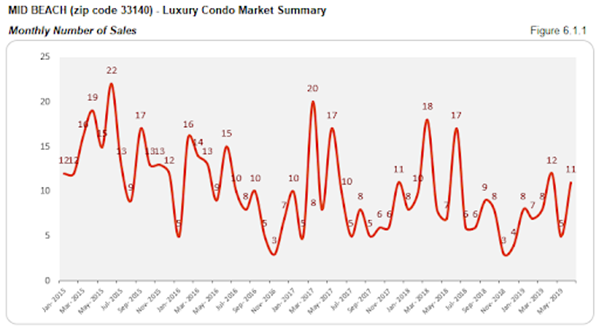
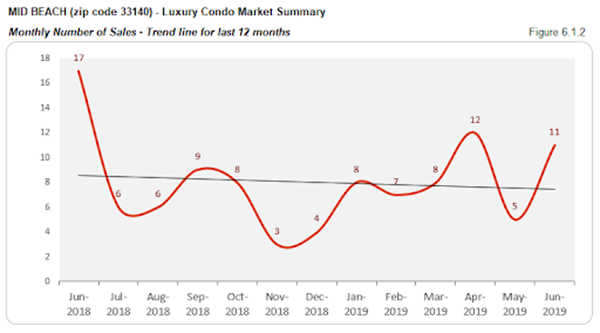
QoQ sales post upswing, but slack YoY with negative trend line. Although there is a big leap between the sales of May and June, we still see a 13% decline in the year-over-year numbers. So, even as the quarter-over-quarter sales post an uptick of 22%, there is a negative trend line to report in figure 6.1.2.
Days on market escalate QoQ and YoY. Buyers and sellers seem to have had a very tough time reaching a consensus in Mid-Beach, as both the quarter-over-quarter and year-over-year numbers post an almost 50% increase. Luxury condos sat 66 days longer on the market compared to Q1 2019 and 71 days longer compared to Q2 2018.
YoY prices reduce, but post slight uptick QoQ. We see the year-over-year median prices post a 20% decline in Mid-Beach, which shows the impact this current buyer-friendly market is having on deals. However, the neighborhood still reports a 9% increase over Q1, which could be due to sales of some higher-end luxury condos. The second quarter closed with a median price of $710 per sq. ft. in Mid-Beach. (see fig. 6.3, 6.3.1, 6.4, and 6.4.1 below)
Inventory descends over Q2, but is 33% higher YoY. At 35 months, inventory closed this second quarter 27% lower than March’s 48 months. However, this is still 33% higher compared to June 2018 and the ideal 9 to12 months of a balanced market. Buyers can easily take this as an opportunity to grab deals by searching Mid-Beach condos for sale here, or starting out with a tour here.
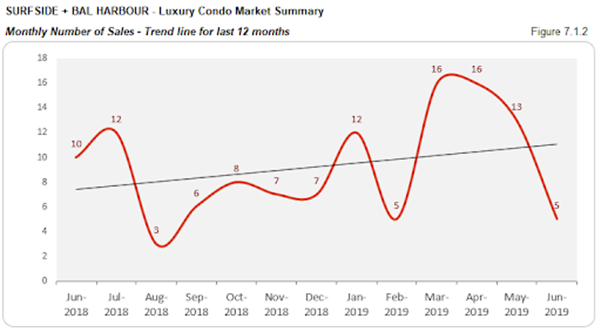
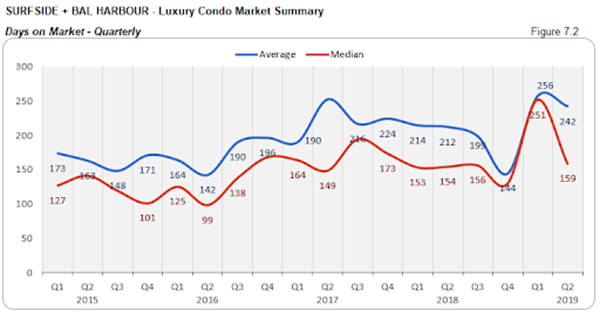
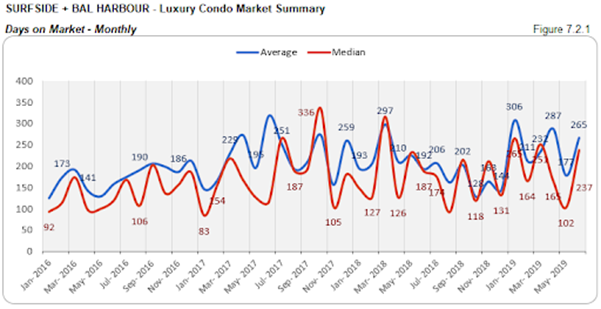
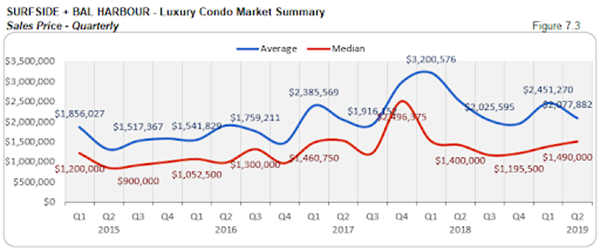
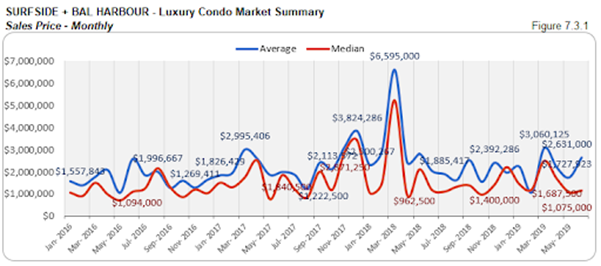
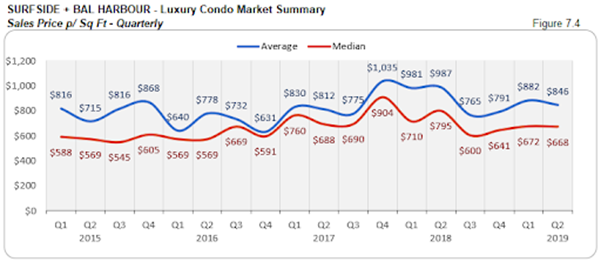
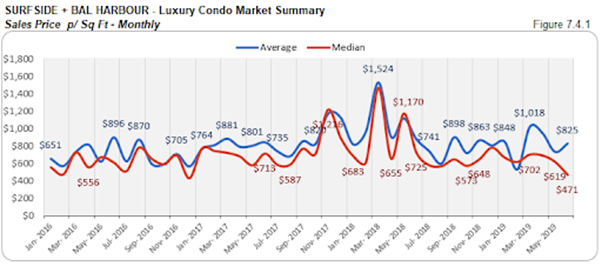
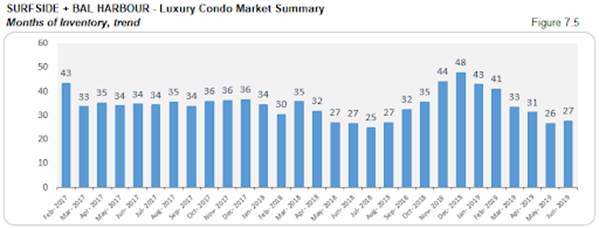
Surfside + Bal Harbour Luxury Condo Market Summary
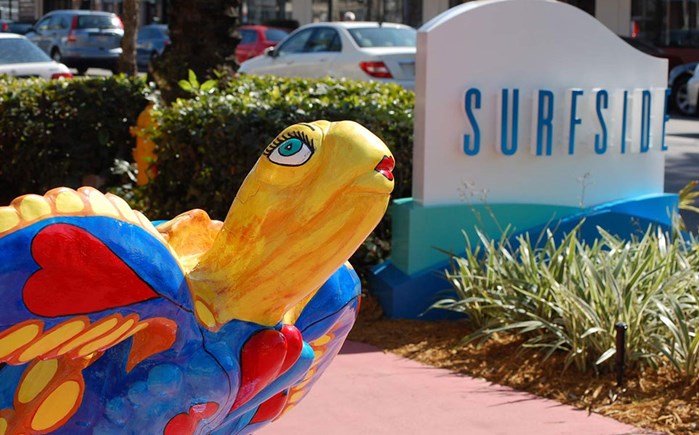
Turtles, Surfside FL. Photo credit: Miamiandbeaches.com
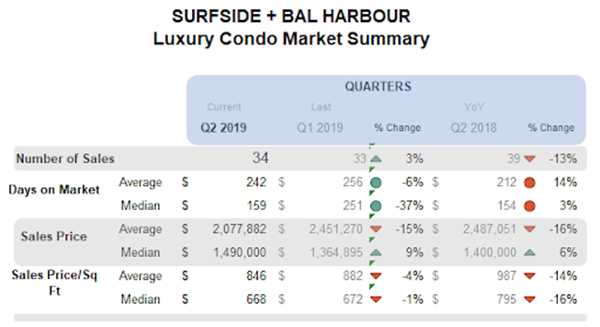
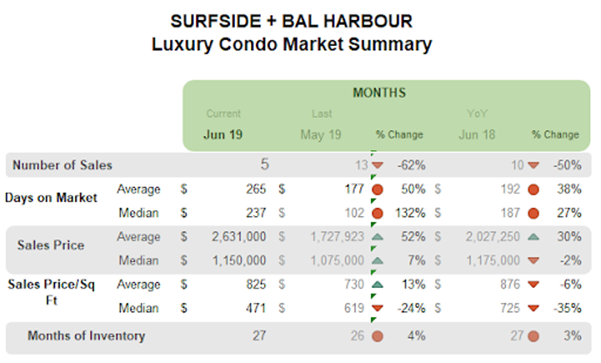
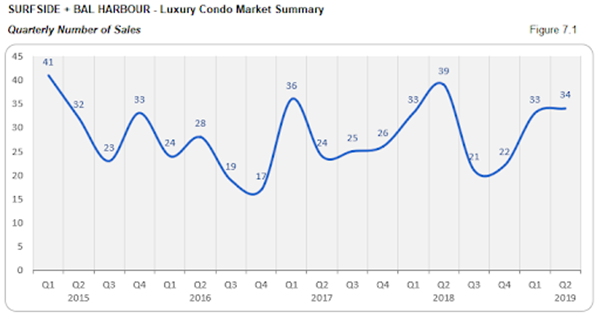
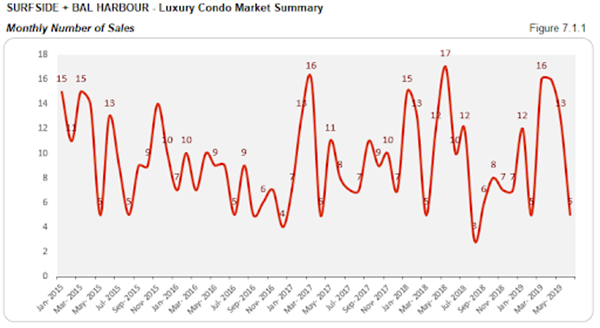
QoQ sales improve marginally with positive trend line, but stay lower YoY. Even though this combined district reports a 13% decrease in its year-over-year sales, there is a 3% improvement to report over the first quarter. Despite low June figures, the good amount of sales registered from March to May have fueled this increase and also pushed the trend line up to the positive we see in figure 7.1.2. This second quarter has also outdone sales from Q2 2017, Q2 2016 and Q2 2015 (figure 7.1).
Days on market post QoQ reduction, but hover YoY. This grouping reports a better dialogue between buyers and sellers during the second quarter, with a 37% reduction in the median days on market. There is, also, only a slight difference of 5 days between the year-over-year numbers, which is a positive indicator for the Surfside-Bal Harbour neighborhood.
QoQ and YoY prices post slight uptick. We see a 9% increase in the quarter-over-quarter median sales price and 6% increase in year-over-year numbers. This inflation could possibly be due to the sale of a few ultra-luxury condo properties in this grouping. This combined district closed the quarter at a median price of $668 per sq. ft. (see fig. 7.3., 7.3.1, 7.4 and 7.4.1 below)
Inventory reduces in Q2 to match previous year levels. Posting quite a reduction from its March closing of 33 months, inventory levels are almost back to match previous year figures. At 27 months, inventory reports only a 3% uptick year-over-year. However, the metric is still far from reaching the ideal 9 to 12 months of a balanced market, giving buyers ample opportunity to scout for deals as they search for Bal Harbour condos for sale here and Surfside condos for sale here, or see what lifestyle makes up Bal Harbour or Surfside here.
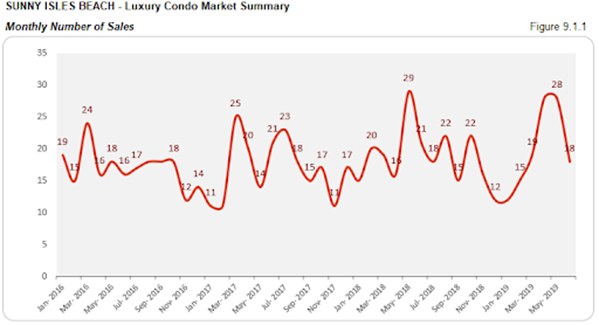
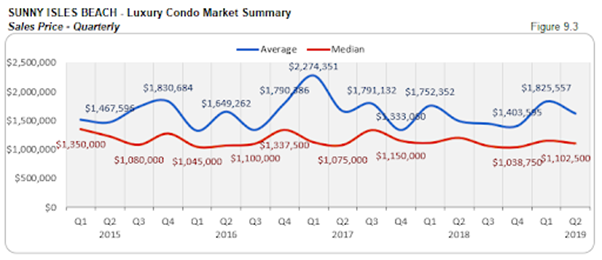
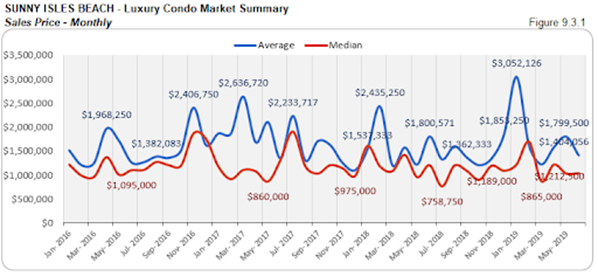
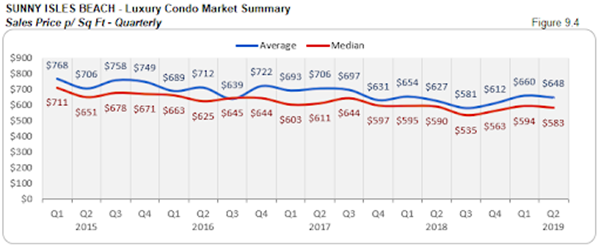
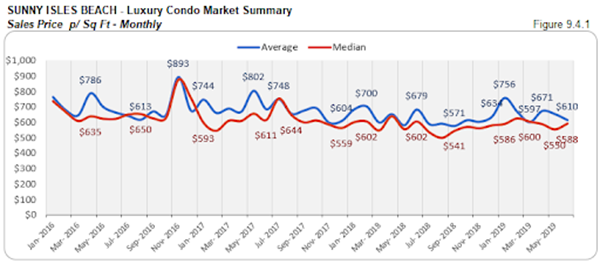
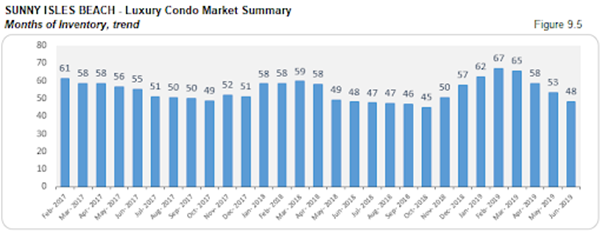
Sunny Isles Beach Luxury Condo Market Summary
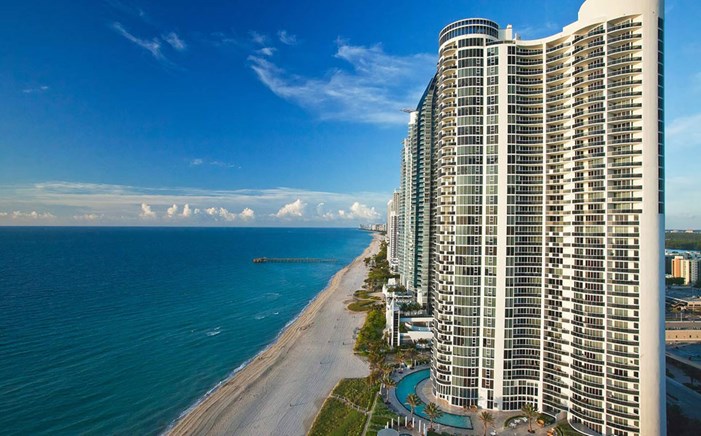
Sunny Isles Beach FL. Photo credit: Miamiandbeaches.com
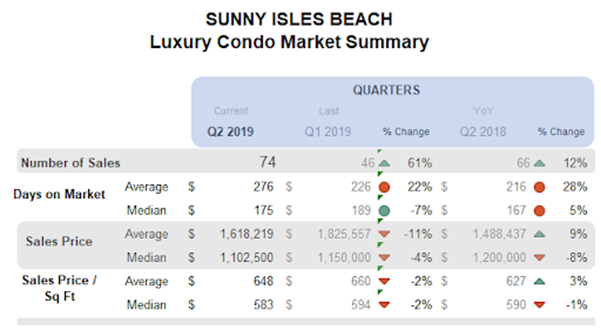
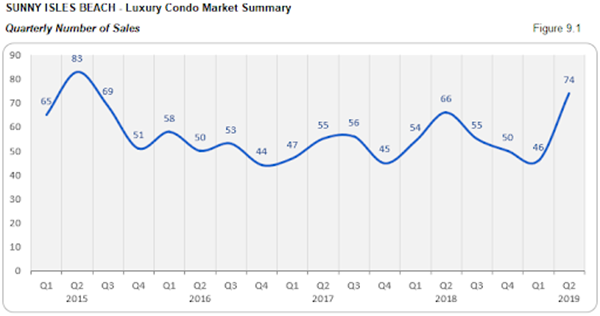
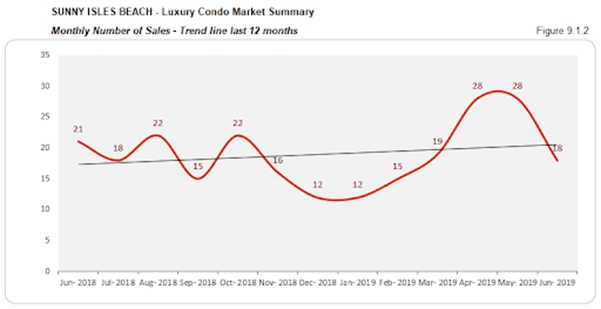
QoQ and YoY sales soar with positive trend line. In quite a contrast to other neighborhoods in this study, Sunny Isles Beach comes with a significant uptick in its sales numbers. This branded condo corridor reports an astounding 61% jump in quarter-over-quarter figures and a 12% increase compared to Q2 2018. It has also outdone sales from Q2 2017 and Q2 2016 (figure 9.1). This marked improvement further shows its impact on the positive sloping trend line of figure 9.9.2.
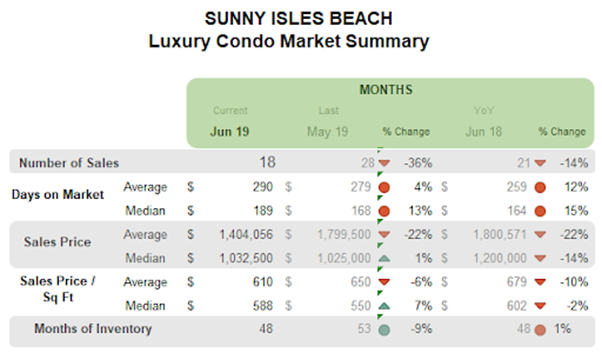
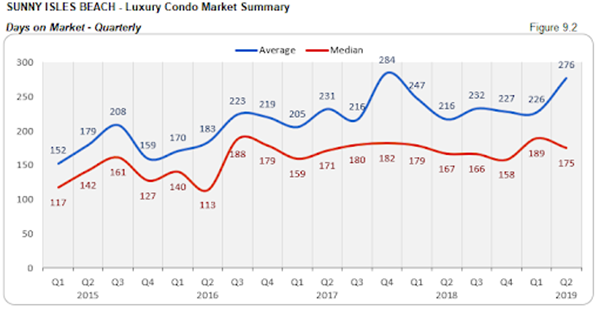
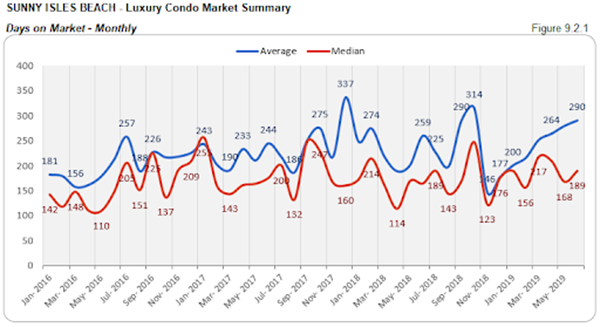
Days on market reduce QoQ, but not YoY. Luxury condos spent 14 less days on market quarter-over-quarter, but 8 days more against Q2 2018. This metric shows that even though buyers and sellers had an improved dialogue over this second quarter, it could not match up to the momentum of the previous year.
Prices deflate QoQ and YoY. We see a 4% reduction in the quarter-over-quarter and 8% reduction in the year-over-year median sales prices in this coastal neighborhood. This decrease shows how the current buyers’ market has been exerting its influence on deals and negotiations. Luxury condos in Sunny Isles Beach closed the quarter with a median price of $583 per sq. ft. (see fig. 9.3, 9.3.1, 9.4 and 9.4.1)
Inventory drops drastically QoQ, hovers YoY. At 48 months, inventory is much lower than the 65 months of March’s closing and has almost matched last year’s level. Despite this huge dive, the numbers are still far from reaching the 9 to 12 months mark of a balanced market. Buyers should take this as a cue and scout for deals as they search Sunny Isles Beach condos for sale here or begin by exploring the lifestyle options here.
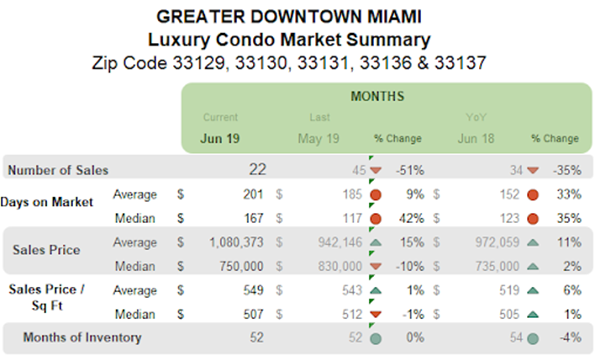
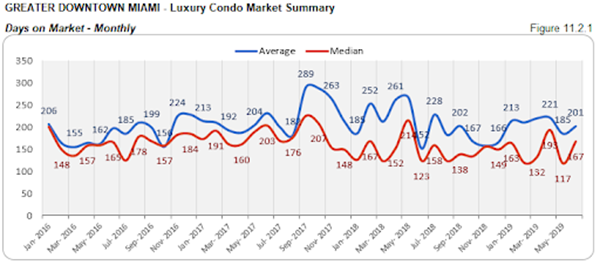
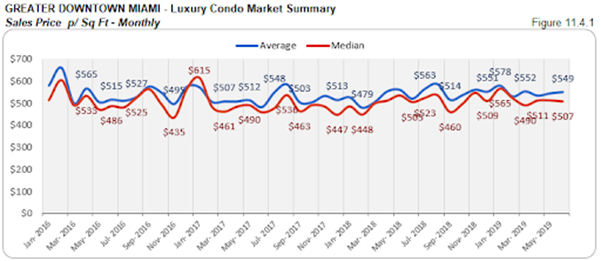
Greater Downtown Miami Luxury Condo Market Summary (33129, 33130, 33131, 33136, 33137 zips)
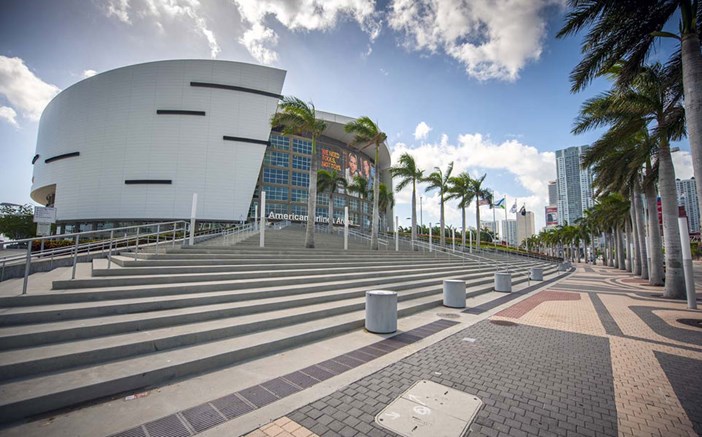
American Airlines Arena, Downtown - Miami FL. Photo credit: Miamiandbeaches.com
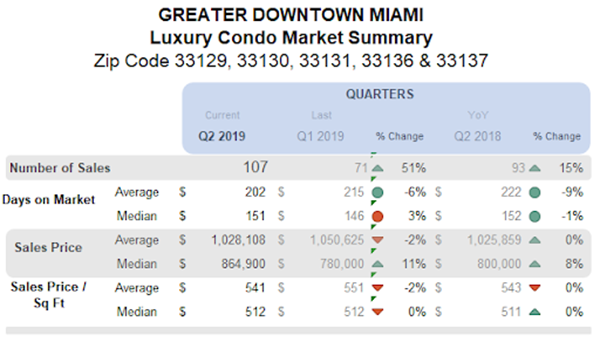
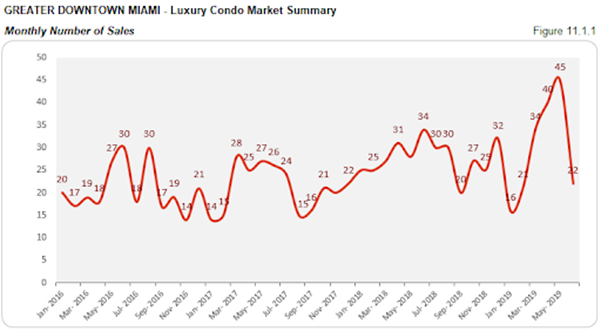
Sales outshine historical figures with positive trendline. This is one of the only two neighborhoods in our study to report an increase in sales over Q2 2018. The Greater Downtown Miami area reports a whopping 51% increase in quarter-over-quarter sales and 15% increase in year-over-year numbers. Not just that, the district also reports an increase over the sales of Q2 2017 and Q2 2016, almost matching the peak of Q2 2015 (figure 11.1). This impressive performance is attributed to the outstanding sales of April and May (figure 11.1.1).
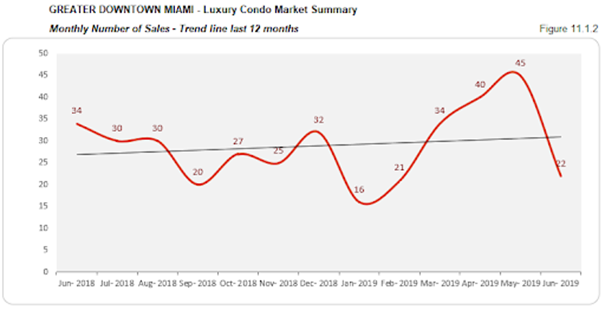
We also see the impact of this immense growth in the positive sloping trend line of figure 11.1.2, which is a refreshing change from the negative we’ve been noting over the past couple of quarters.
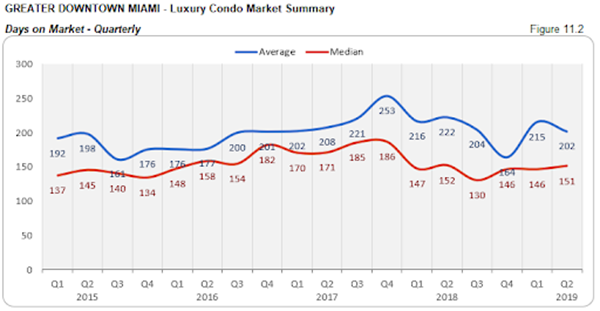
Days on market hover QoQ and YoY. On a median, luxury condos spent 5 more days on market compared to Q1, and almost the same time as Q2 2018. This indicates that buyers and sellers have more or less been on the same page (in terms of expectations) in the area.
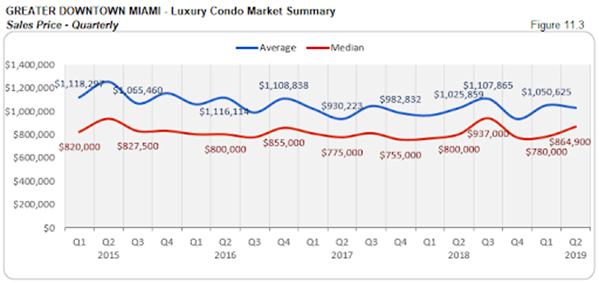
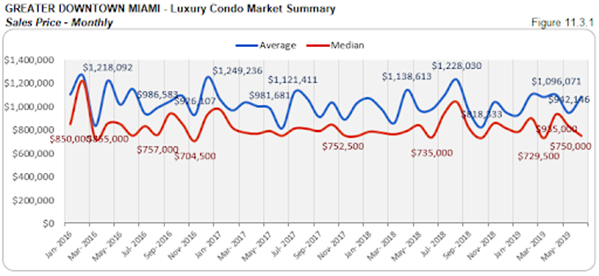
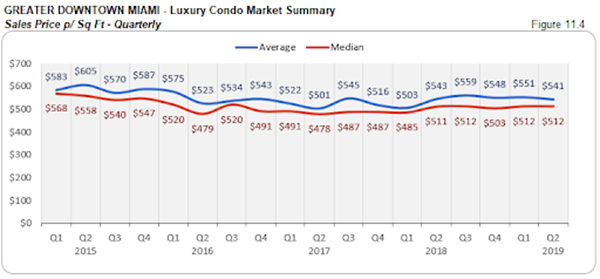
Prices rise QoQ and YoY. We see the prices increase by 11% quarter-over-quarter and 8% year-over-year in Greater Downtown Miami. This could be due to the sale of newly constructed condos. This closed the quarter at a median price of $512 per sq. ft. (the same as Q1 2019). (see fig. 11.3, 11.3.1, 11.4, and 11.4.1 below)
Inventory declines over Q2 to below previous year levels. We see the months of inventory dive from 64 during March’s closing to 52 this quarter-end. The metric is now also 4% lower than the previous year. Still, the district has one of the highest levels of inventory in our study, which is also way off the 9 to 12 months benchmark of a balanced market. This gives buyers a broader window of opportunity to explore the Greater Downtown Miami area here for some outstanding bargains.

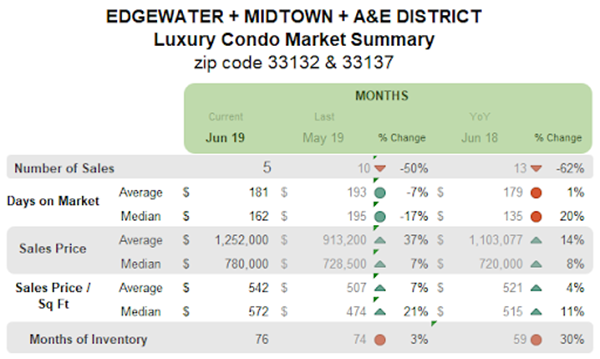
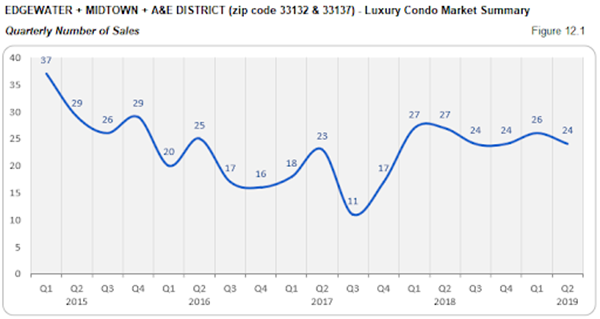
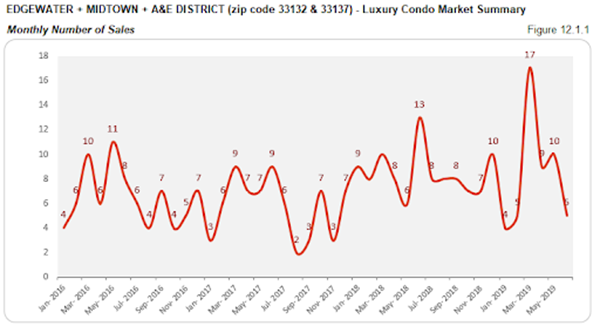
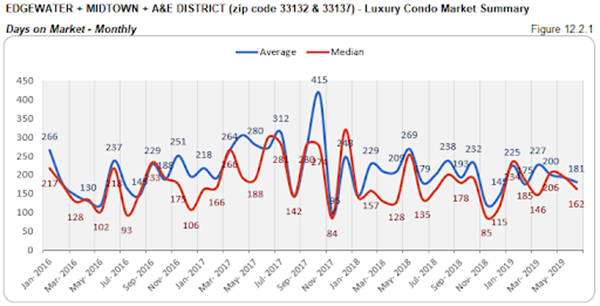
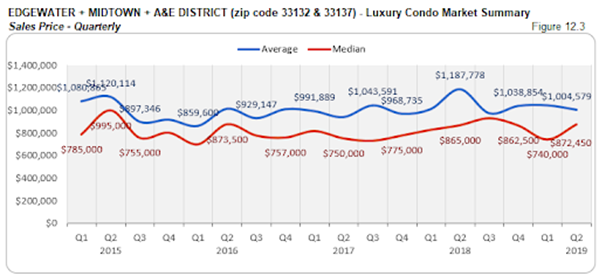
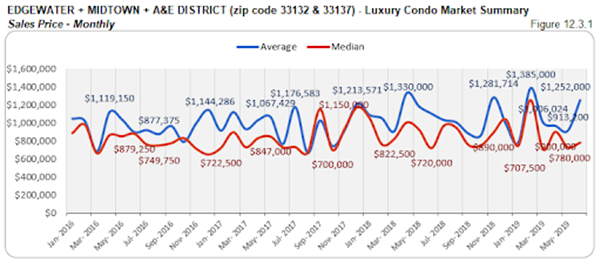
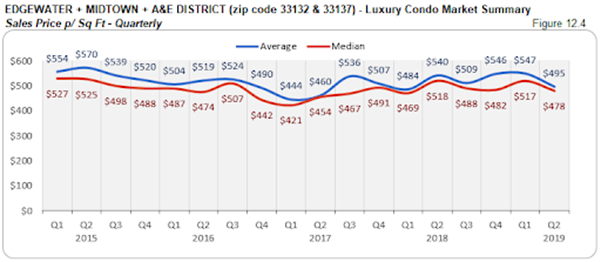
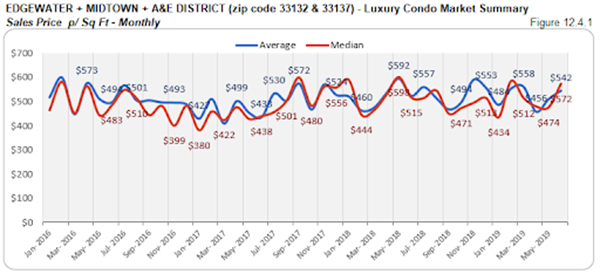
Edgewater + Midtown + A&E District Luxury Condo Market Summary (33132 + 33137 zip)
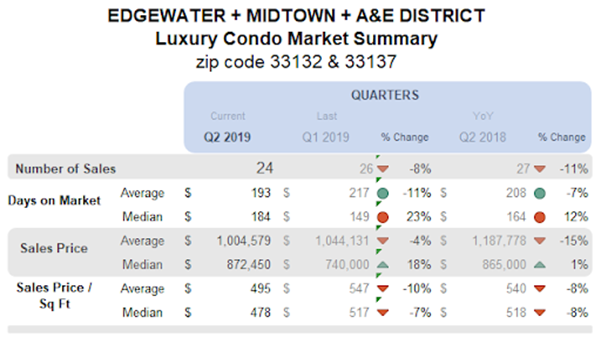
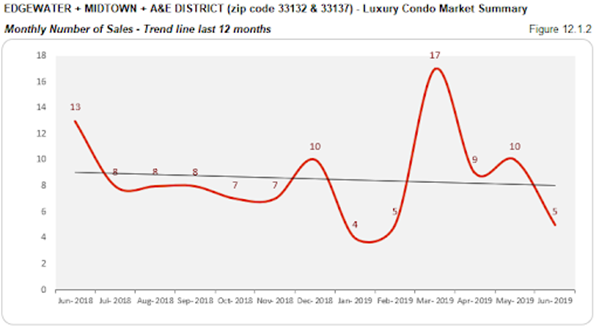
QoQ and YoY sales slip with negative trend line. Going against the historical trend of a good second quarter, we see this grouping post a decrease of 8% in its quarter-over-quarter sales and decline of 11% in year-over-year sales. This downtrend further makes it impact visible on the negatively sloping trend line of figure 12.1.2.
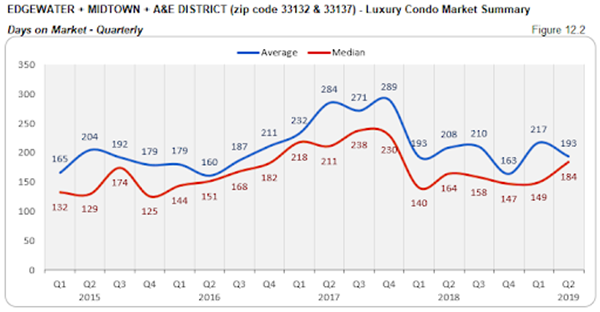
Days on market inch up QoQ and YoY. Luxury condos spent 35 days longer on the market compared to Q1, and 20 days longer against the same quarter last year in this grouping.
Prices post uptrend QoQ and YoY. We see a general increase in the median sales price of this grouping. There is an 18% increase in the quarter-over-quarter prices and a marginal uptick of 1% in the year-over-year figures. By quarter-end, the median price per sq. ft. closed at $478. (see fig. 12.3, 12.3.1, 12.4 and 12.4.1)
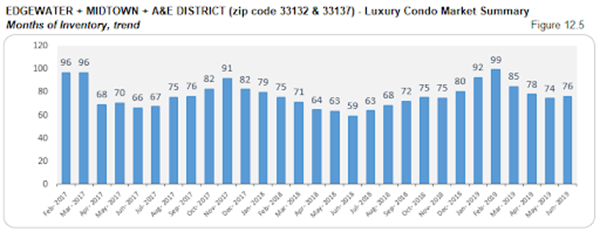
Inventory up 30% YoY. This grouping has had one of the highest levels of inventory in our study. And, although inventory has fallen significantly to 76 months from March’s closing of 85 months, it is still way higher than last year’s 59 months. With levels still being one of the furthest from reaching the 9 to 12 months mark of a balanced market, buyers have ample time and options to steer negotiations in their favor, as they browse through Edgewater condos for sale here or begin by exploring the individual lifestyle plus condo options in Edgewater, Midtown and Arts & Entertainment District.
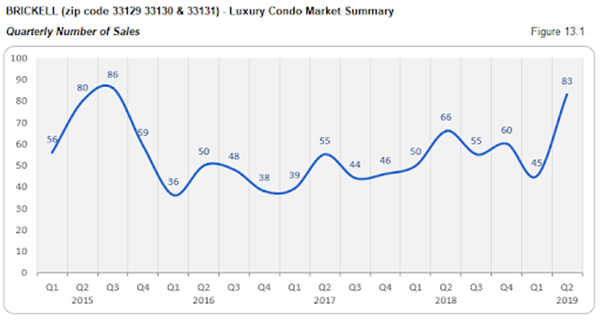
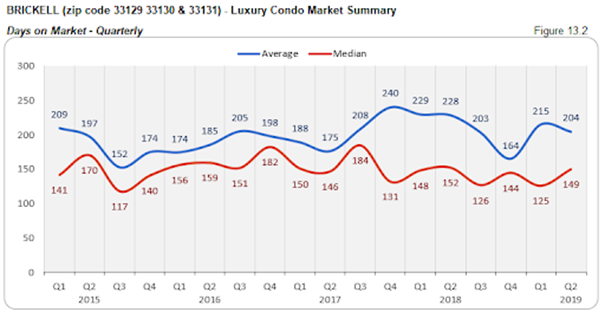
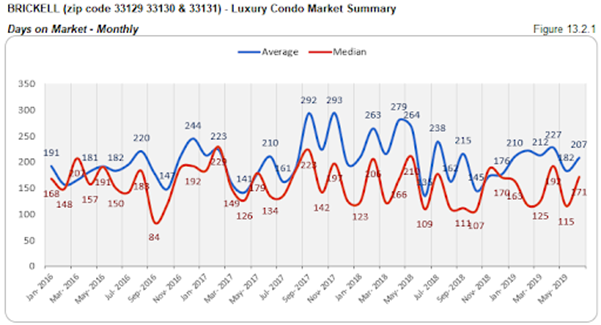
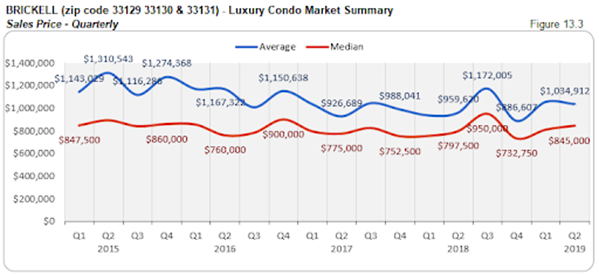
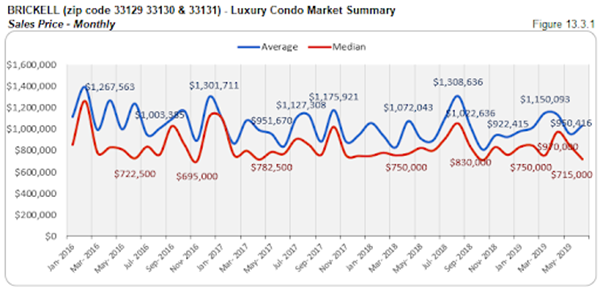
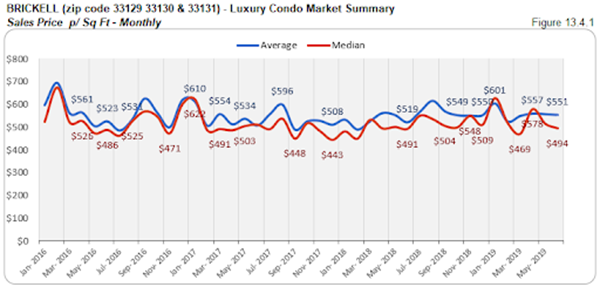
Brickell Luxury Condo Market Summary (33129, 33130, 33131 zip)
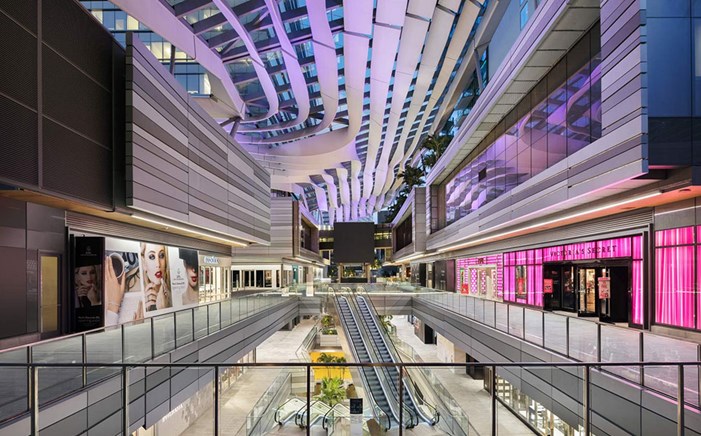
Brickell City Centre, Brickell - Miami FL. Photo credit: Miamiandbeaches.com
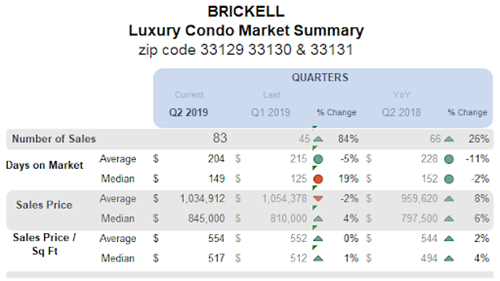
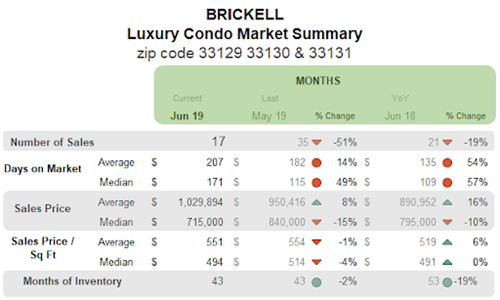
QoQ and YOY sales soar high with positive trendline. This is one of the only two neighborhoods in our study to report an improvement in sales over Q2 2018. The financial district posts an astounding 84% increase in its quarter-over-quarter sales and 26% improvement in the year-over-year numbers.
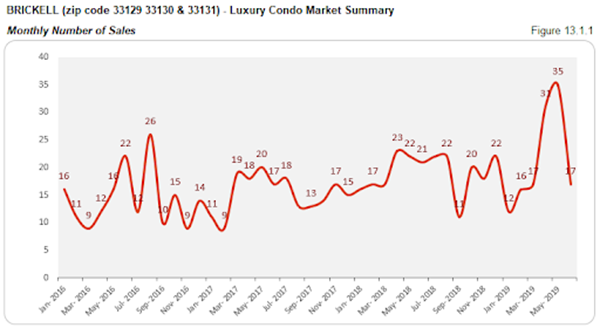
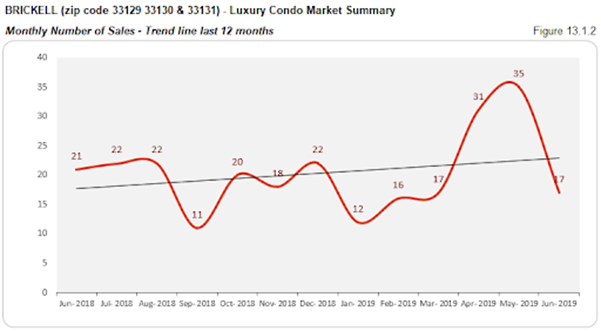
This peak is attributed to the high sales of April and May (figure 13.1.1), so much so that the numbers have outperformed Q2 2017 and Q2 2016, plus matched the peak of Q2 2015 (figure 13.1). This momentum further shows its impact with an ascending trend line in figure 13.1.2.
Days on market up QoQ, but hover YoY. Luxury condos spent 24 days longer on the market compared to Q1 and 3 days less on median year-over-year.
QoQ and YoY prices inch up. This second quarter reports a 4% increase in its median sales price over Q1 2019 and 6% increase over Q2 2018. This surge could be explained due to sales of newly constructed or a higher-end product in the neighborhood. By quarter-end, luxury condos closed at a median price of $517 per sq. ft. (see fig. 13.3, 13.3.1, 13.4 and 13.4.1 below)
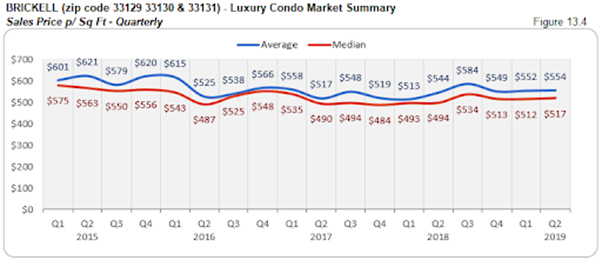
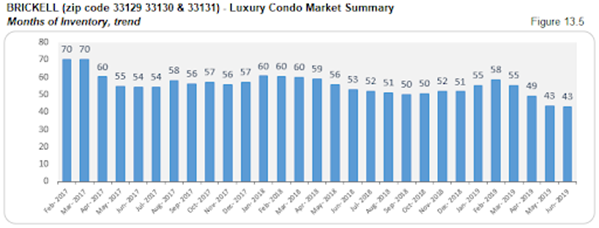
Inventory historically at lowest. At 43 months, inventory is at its lowest for the entire period under review in our study. It is now 19% lower than the previous year, showing a great deal of progress for the neighborhood. However, with levels still far from the ideal 9 to 12 months of a balanced market, buyers should hurry to seize this opportunity of getting favorably-priced deals by searching Brickell condos for sale here or taking a tour through Brickell here.
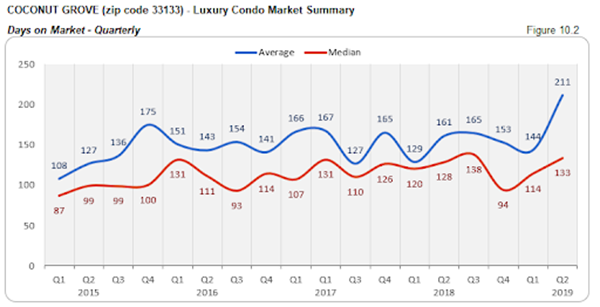
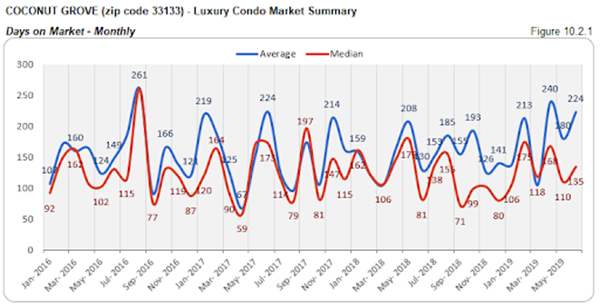
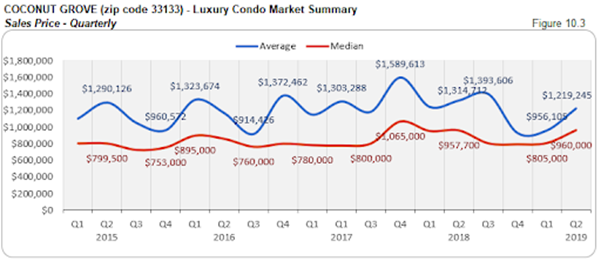
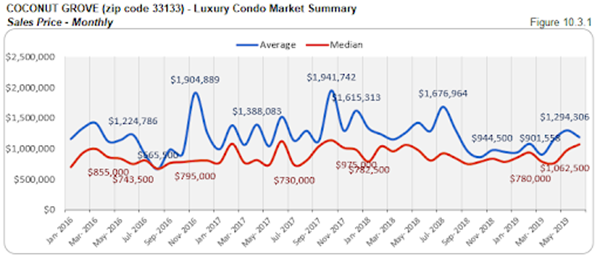
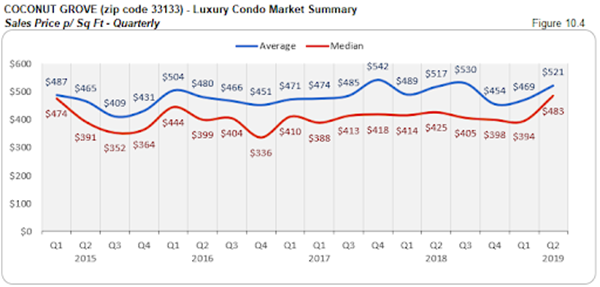
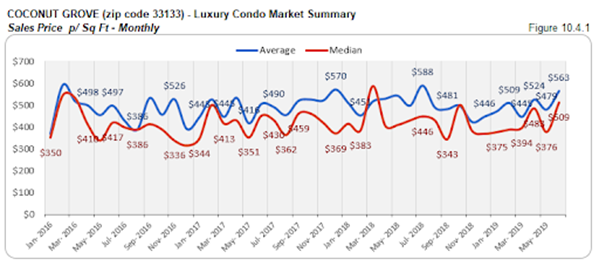
Coconut Grove Luxury Condo Market Summary (33133 zip)

Main Highway, Coconut Grove - Miami FL. Photo credit: Miamiandbeaches.com
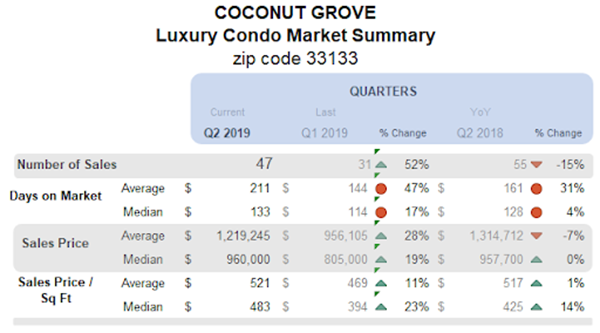
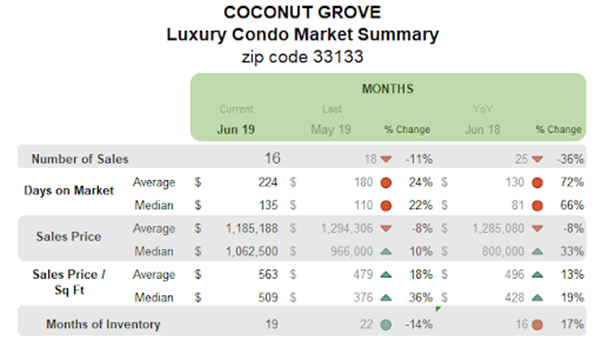
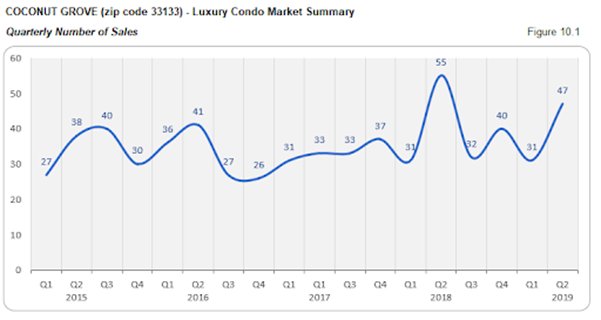
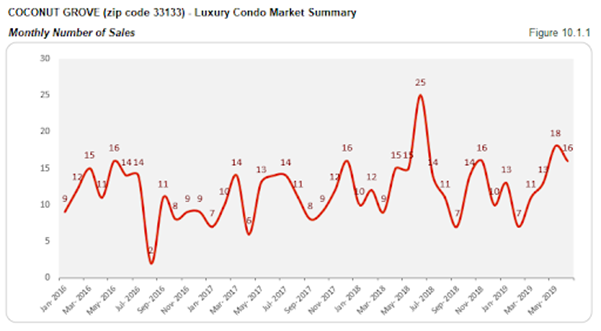
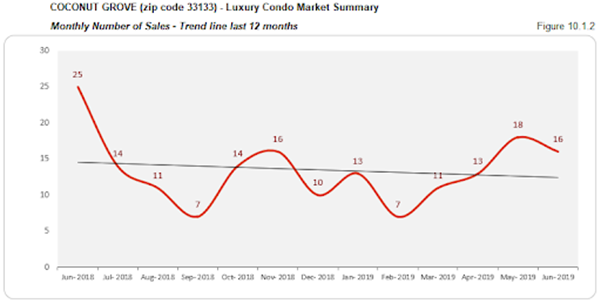
QoQ sales jump, but fall short YoY with negative trend line. Q2 is generally the best quarter of the year, and we see that reflected in the charts with a 52% increase over Q1 2019. However, the year-over-year numbers fell short by 15%, the impact of which is clearly visible in the negative sloping trend line of figure 10.1.2. Nonetheless, a closer look at figure 10.1 reveals that the momentum is not totally lost for this vibrant neighborhood, as this second quarter outdoes sales from Q2 2015, Q2 2016 and Q2 2017 (figure 10.1).
A higher days on market in Coconut Grove. Luxury condos spent 19 days longer on the market compared to Q1, and 5 more days compared to the same quarter last year. Though this may not be a very huge difference, it still indicates a sense of hesitation between buyers and sellers.
Prices inflate QoQ, but hover YoY. The median sales price in Coconut Grove did not deviate much from previous year levels, however, they did move 19% higher compared to Q1 2019. This had this vibrant neighborhood close the quarter with a median price of $483 per sq. ft. (see fig. 10.3, 10.3.1, 10.4 and 10.4.1 below)
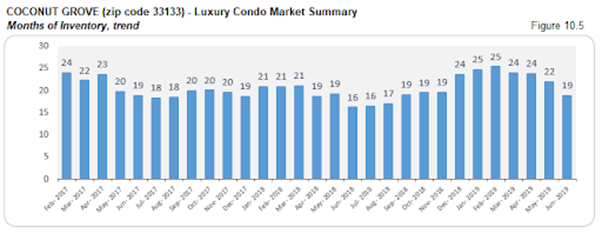
Inventory drops over Q2, but higher than previous year. Even as inventory decreased over this second quarter, we see a 17% increase over the same quarter-end last year. At 19 months, Coconut Grove has the lowest months of inventory in our study, and is the closest to reaching the ideal 9 to 12 months of a balanced market. With the luxury condo market picking up momentum, buyers have only a limited period to get favorable deals as they search Coconut Grove condos for sale here, or check out what lifestyle makes this vibrant neighborhood here.
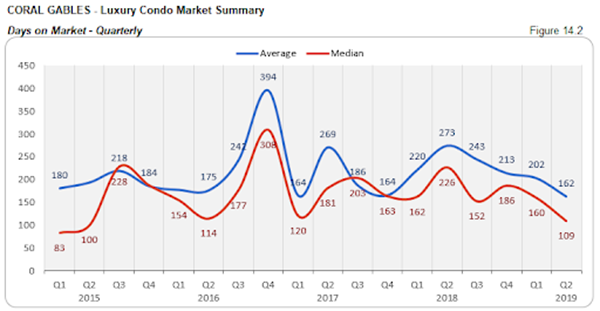
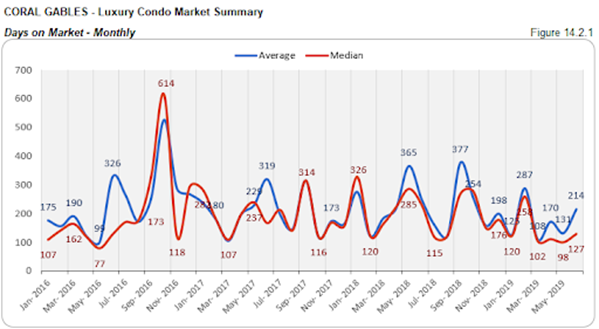
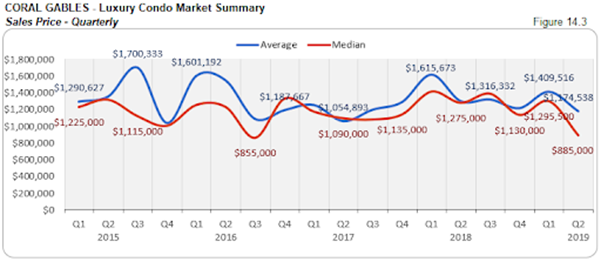
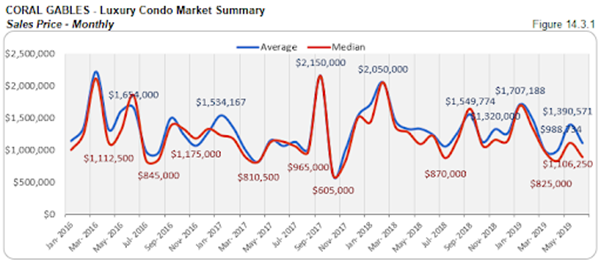
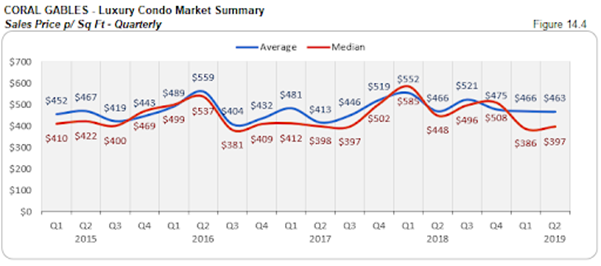
Coral Gables Luxury Condo Market Summary
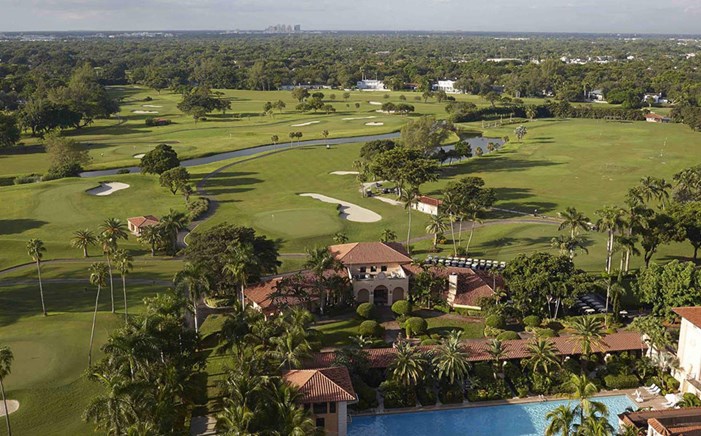
Biltmore Golf Course, Coral Gables - Miami FL. Photo credit: Miamiandbeaches.com
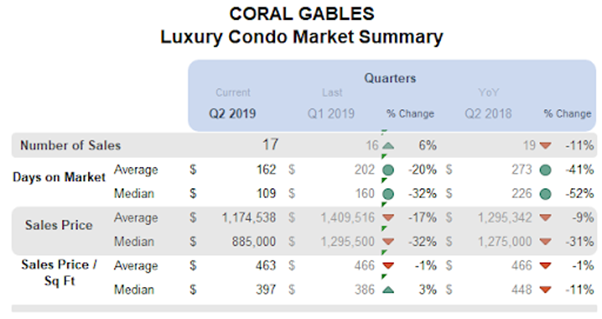
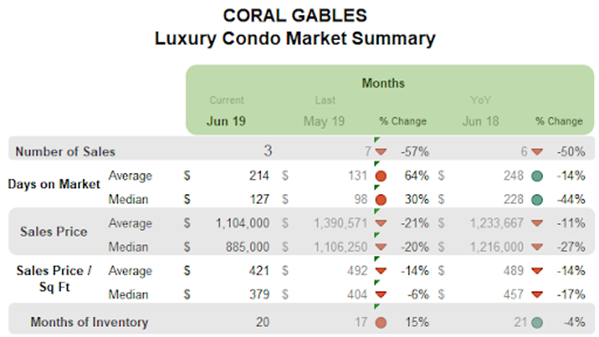
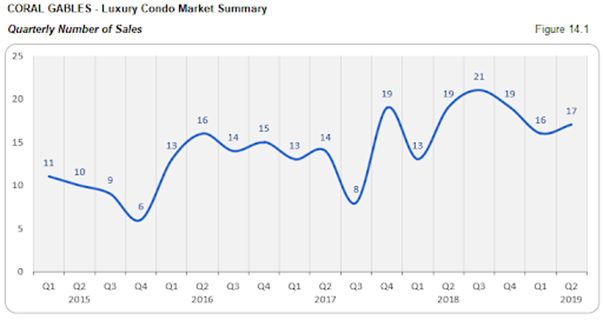
QoQ sales uptrend even if YoY sales slack. Q2 reports 6% higher sales than Q1 2019. On the other hand, the year-over-year numbers fell 11% short. But, a closer look at figure 14.1 reveals that this second quarter outperformed Q2 2017, Q2 2016 and Q2 2015, showing a great deal of progress for the neighborhood.
Days on market drop significantly QoQ and YoY. In what is a positive indication, we see the days on market drop 32% against the previous quarter and 52% against the same quarter last year. This means that buyers and sellers found it much easier to come to an understanding in City Beautiful over the course of the year.
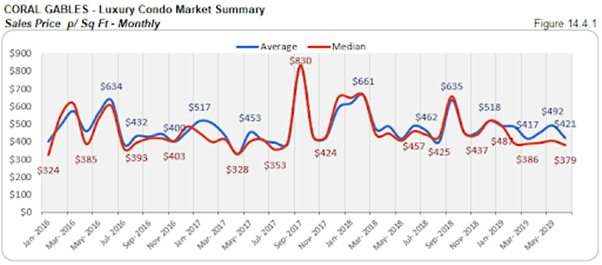
Prices drop QoQ and YoY. This smaller market for luxury condos posts a significant drop in its median sales price quarter-over-quarter and year-over-year, showing the impact this current buyer-friendly market is having on negotiations. The quarter closed with a median price of $397 per sq. ft., as the median sales price declined by 32% from Q1 2019. (see fig. 14.3, 14.3.1, 14.4 and 14.4.1 below)
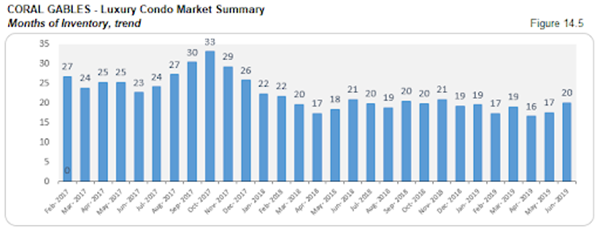
Inventory goes down 4% YoY. This is the only neighborhood in our study to report an increase in inventory by the end of this second quarter. However, at 20 months, it is still lower than last year’s 21 months of inventory. Nonetheless, the trend is far from reaching the 9 to 12 months ideal of a balanced market, indicating that buyers still have the upper hand in negotiations as they search Coral Gables condos for sale here, or start by checking out the lifestyle options in Coral Gables here.
Conclusion
High levels of inventory keep buyers in control of the market. With the second quarter generally being the best of the year, we see numbers coming through for most of the neighborhoods in our study. However, inventory levels still run high due to most of the pre-construction getting delivered over the last couple of months. This again gives buyers the advantage of time and ample choices to put negotiations in their favor.
Moving forward into 2019, we will be looking very carefully into trends to see when the market’s disposition finally starts to change. And, we still stand by our belief that the market should rebalance by the first or second quarter of 2020.
Love what you see? Don’t forget to share our blog and subscribe (see the subscribe link on the top menu) to receive the latest market news in your inbox.
Have any questions? Or see something wrong with the stats? Please contact Sep at sniakan (at) hbroswell.com or call 305-725-0566.
Share your thoughts with us

Your Miami Condo Awaits
Recent Posts


 (305) 697-7667
 (786) 321-7233
  contact@condoblackbook.com

