Luxury Miami Condo Market Trends: April 2018 Report

May 28, 2018 May 28, 2018
Miami Luxury Condo Report Overall Market Summary
City and Neighborhood Luxury Condo Reports
Miami Beach Luxury Condo Report
South Beach Luxury Condo Report
Bal Harbour Luxury Condo Report
Sunny Isles Beach Luxury Condo Report
Greater Downtown Miami Luxury Condo Report
Edgewater / Midtown / A&E District Luxury Condo Report
Coconut Grove Luxury Condo Report
Coral Gables Luxury Condo Report
Miami Luxury Condo Market Report: Summary back to top
The first month of the second quarter has come in with some good numbers. Sales pick up pace and months of inventory begin their descent. Read on to see if the rest of the metrics line up to push this buyer-dominated luxury condo market into a balance.
For the purpose of this luxury condo report, we have only considered properties priced $600,000 and above. Also, properties priced $5 million and higher have been referred to as ultra-luxury.
Overall Market Highlights:
- Sales post an uptick in Month-to-Month and Year-over-Year analysis for most neighborhoods
- Overall days on market initiate downward shift
- Ultra-luxury deals keep price trends up
- All neighborhoods come up with a reduction in inventory
- Market garners good momentum, but buyers still in control
Overall sales post healthy upswing. We see a healthy uptick in sales this April for a majority of the neighborhoods. Perhaps the prolonged winter and new SALT tax laws have been working their wonder. It also seems that the initial shock of a stronger Dollar is finally wearing off, with many of our South American and European buyers coming back. There is also increased interest from domestic buyers in recent months.
Overall days on market decline. A decline in the days on market is a positive indicator, showing that properties took less time getting sold this April.
Overall prices push higher. We see a price increase in most of the charts in our study. This is mostly due to brand new condos selling on the market, which are more expensive to begin with. Even resales of these freshly delivered condos keep pushed this metric higher. On the other hand, the luxury segment ($600K to $5 million) has kept its pricing modest.
Months of inventory drop to post a positive. We have most neighborhoods report a decline in inventory this April, against last month and year. Even though this is quite a positive, the change is not massive enough to make a dent in this current glut of inventory.
Overall, the market has received a slight push this April. However, these trends need to keep in order to bring the luxury condo market back into balance. Till then, buyers can enjoy the luxury that ample inventory brings along with it.
Where Does the Market Go From Here? back to top
Buyers continue to retain their hold of the market for over a year now. However, if the following factors come through, the luxury condo market could regain its footing in Miami:
- Tax cuts keep pushing new residents our way. As the impact of the new SALT tax deduction limits come through, we see more and more inquiries by the wealthy to move to Miami. This also seems to have trickled through the good number of sales we see this month. Hopefully, the trend continues forward, as here’s all the taxes you save being a resident of Florida.
- Softer U.S. Dollar brings back foreign buyer attention. We see the Dollar has weakened against the Euro and some Latin American currencies, giving them the confidence to come back. We also anecdotally see more people from France and Italy inquiring. The Canadian Dollar too has had modest gains in recent months. So, with a mixed bag from overseas, we mostly see an increase in buying power. Though we don’t expect a drastic change in people’s appetites for buying in Miami, we also don’t see anything to deter them from the dollar stand point.
- Brand new inventory to infuse fresh energy. There is a significant amount of pre-construction condos set to be delivered this year. While this will, no doubt, infuse more inventory into the market, it will also bring with it a mixed bag of brand new excitement to keep buyers intrigued.
- Sun, sand and warmer shores. While winter is officially over, many northerners in the U.S. have experienced an extended chill. If this especially difficult and prolonged winter had any influence, we could see people plan ahead and scoop up something in Miami to avoid the same next year.
Below is an insight into Miami’s overall and neighborhood-level luxury condo trends for April 2018:
Monthly Number of Sales - Miami Luxury Condo Market Overall back to top
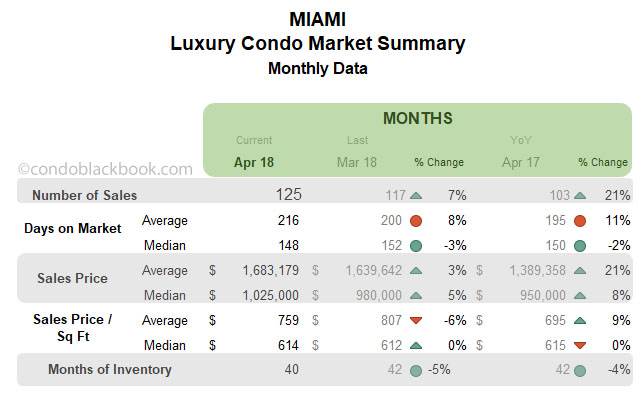
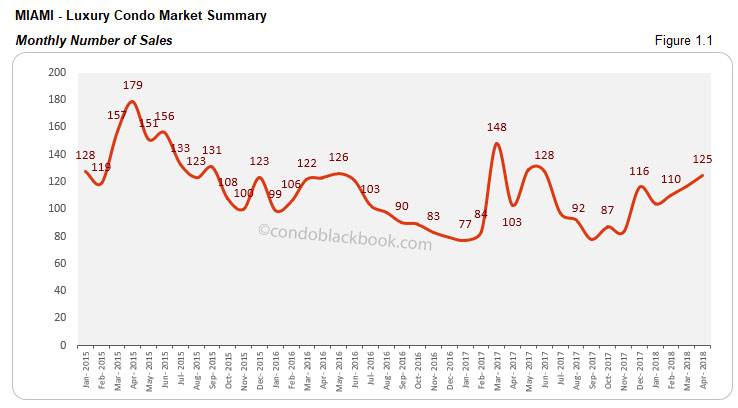
Sales post upswing YOY and month-to-month. We see April deliver good numbers in fig. 1.1 below for the market overall. There is a 7% increase to report over last month and a 21% increase over same month last year. We also see this momentum make an impact on the 12-month trend line below.
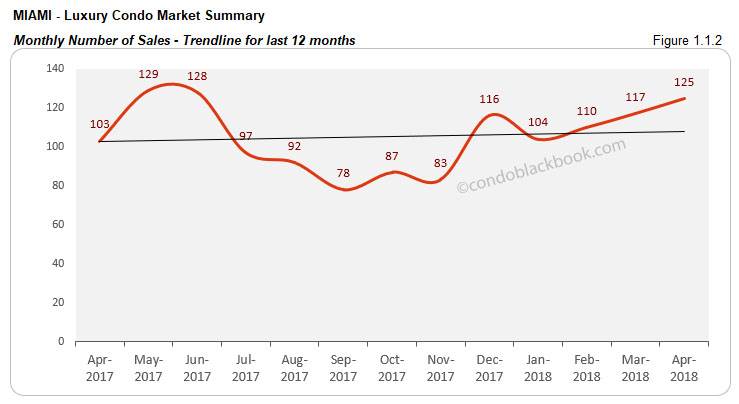
Market momentum pushes up trend line. After posting a negative trend through Q1, it’s refreshing to see the trend line get back up in fig. 1.1.2 below, capturing real progress.
Days on Market - Miami Luxury Condo Market Overall back to top
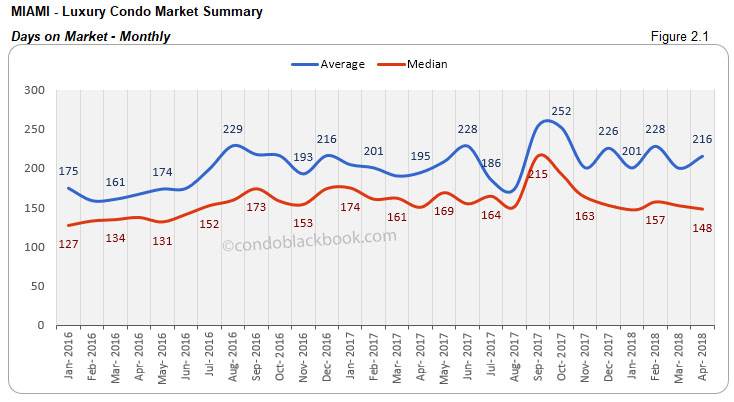
“Days on market” are the total number of days from when a property is active to the day it goes under contract.
Median days on market adjust lower. We see a continuation on last month’s positive trend, as the median days on market deflate 3% month-on-month and 2% year-over-year. (see fig 2.1 below)
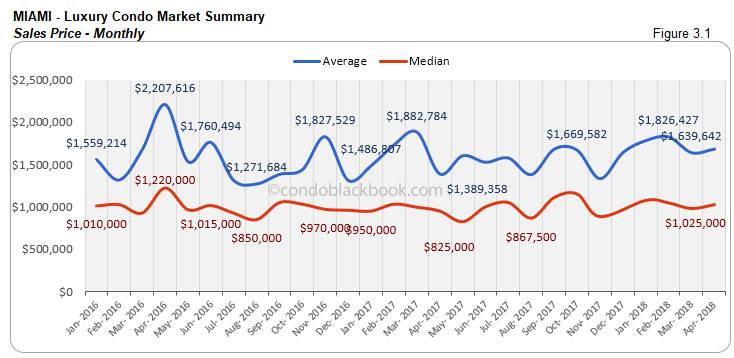
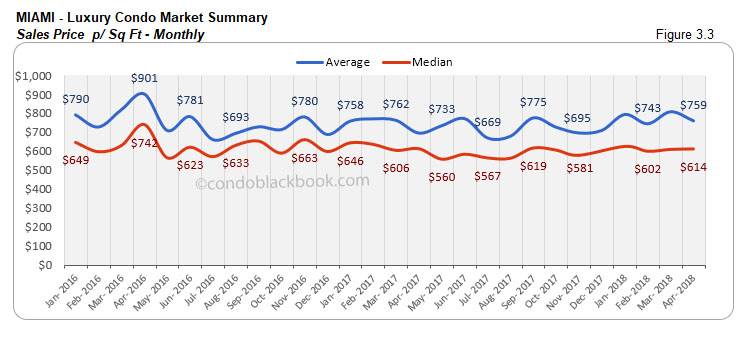
Sales Price Trends - Miami Luxury Condo Market Overall back to top
Prices continue pushing upwards. We see another increase in the sales price and price per sq. ft. for the overall luxury condo market. This upward trend can be attributed to brand new condo product selling on the market, which is inherently more expensive, rather than prices shooting up for existing properties. This month, we see a 5% increase in the month-to-month median prices and 8% year-over-year increase. But . . . if you notice the MEDIAN sales price / sq ft remains flat, which is a better indicator of what is happening in the market. (See fig. 3.1 and 3.3 below)
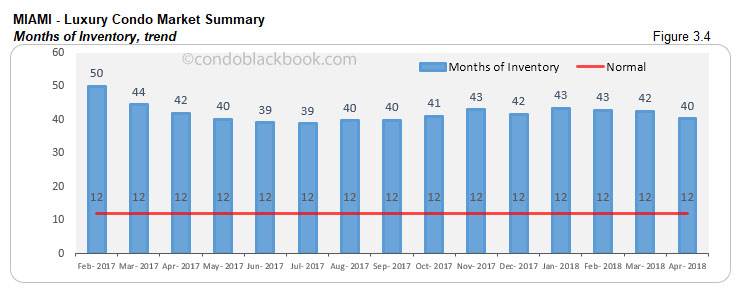
Inventory Trends - Miami Luxury Condo Market Overall back to top
A balanced market will only have 9-12 months of inventory. The months of inventory are calculated as – no. of active listings + no. of pending listings divided by the average number of deals in the last 6 months.
Inventory drops 5%. We see a positive trend in the months of inventory, as it drops 5% month-to-month and 4% year-over-year. However, 40 is still a long way off from the 9-12 months of a balanced market. This puts buyers in control of negotiations and gives them ample opportunity to gain, even as market momentum tries to chip away at the current glut.
City and Neighborhood Market Reports back to top
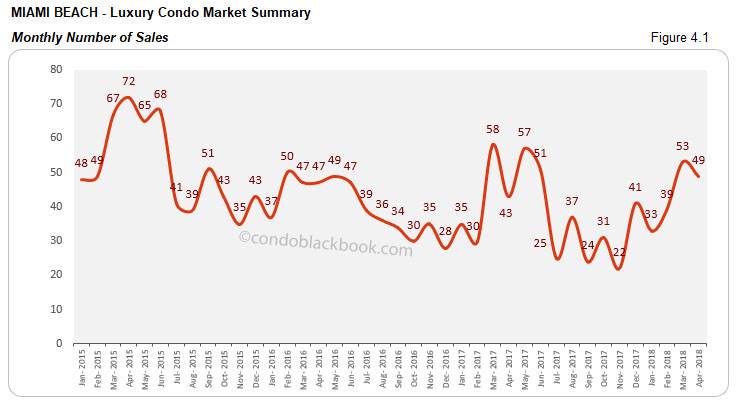
Miami Beach Luxury Condo Market Summary back to top
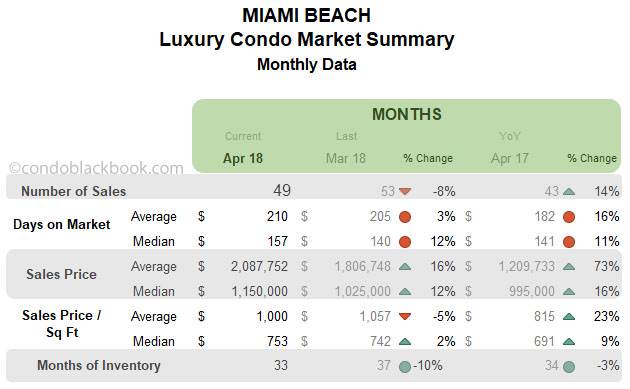
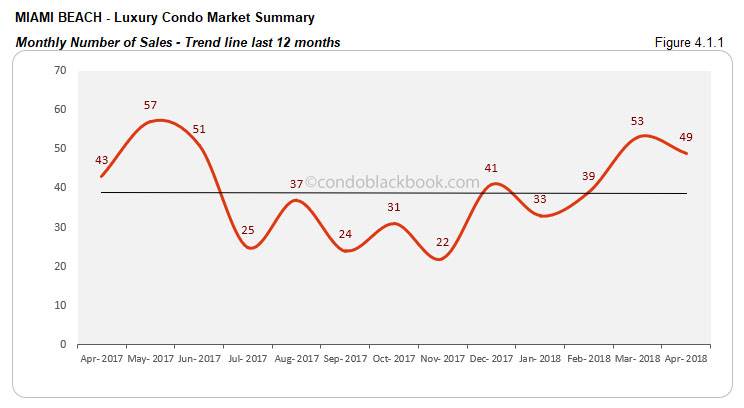
Sales lose some heat but perform year-over-year. We see Miami Beach closing 8% lower compared to March (fig. 4.1). However, the popular neighborhood manages to post a 14% increase in numbers over April 2017. This pushes the trend line in fig. 4.1.1 to become almost flat, a positive compared to its previous decline.
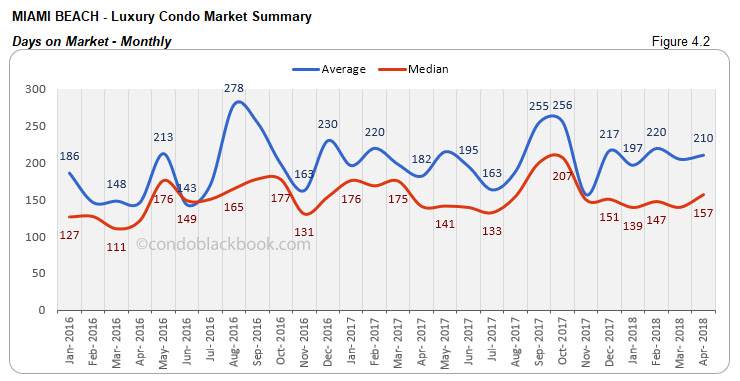
Days on market swell 12%. We see the median days on market increase by 12% month-on-month, showing that properties are still waiting to get off the market.
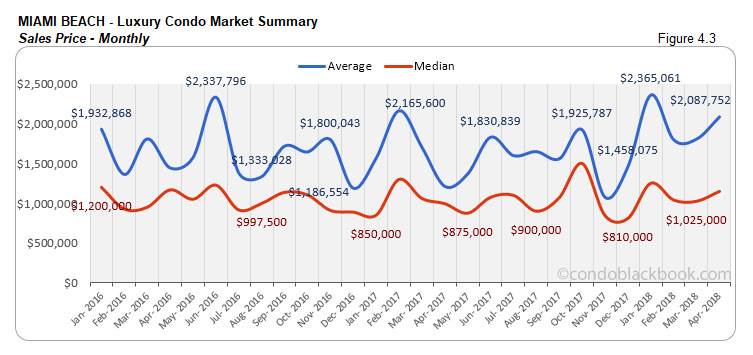
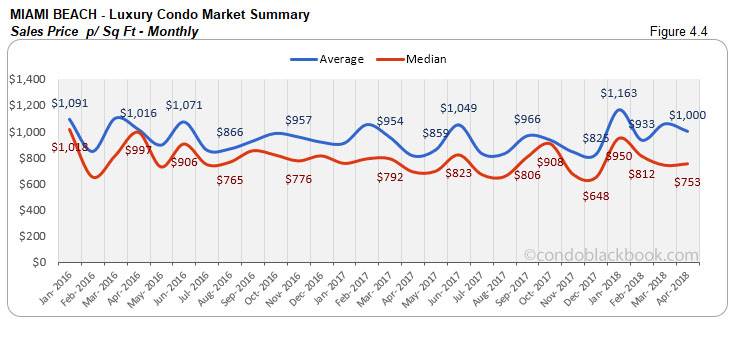
Ultra-luxury pushes prices upwards. In fig. 4.3 and 4.4 below, we see a slight uptick in the sales price and price per sq. ft. This is mostly due to ultra-luxury sales (as high as $10 million) taking place mostly on Fisher Island.
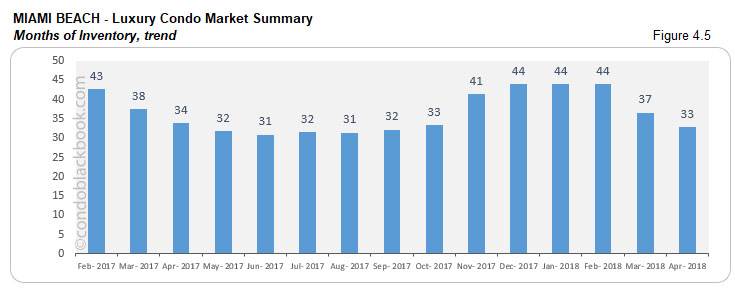
Inventory drops 10%. In another positive cue, we have the months of inventory drop 10% this April. It is also 3% lower compared to same month last year. What’s interesting is that the months of inventory are based on the performance of sale over the last 6 months, which shows that the market dynamic has been on the positive side for the past 6 months. However, with 33 being way off the 9-12-month mark of a normal market, buyers can get their hands on some great deals by searching Miami Beach condos for sale here.
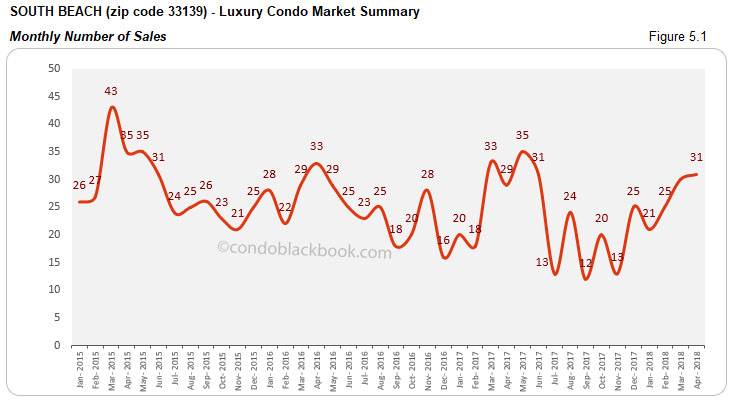
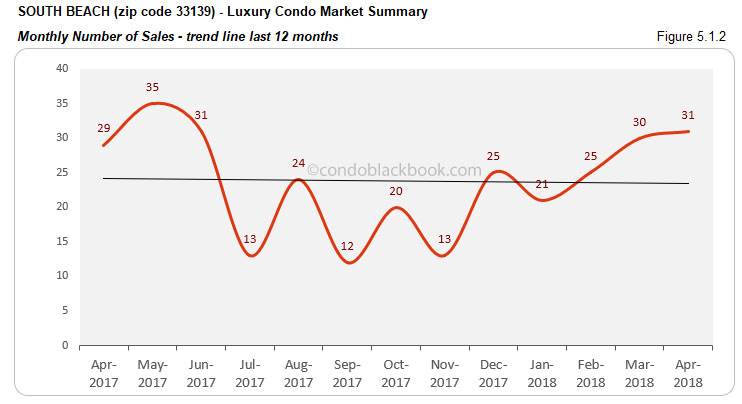
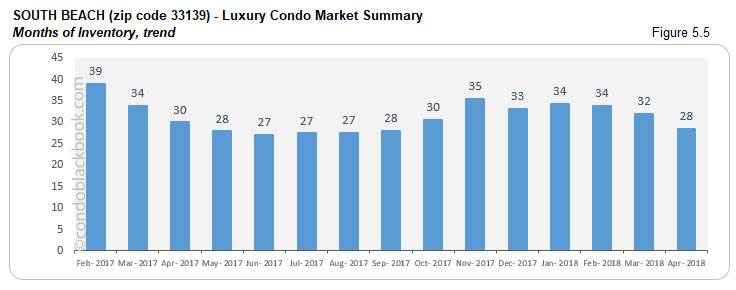
South Beach Luxury Condo Market Summary (33139 zip) back to top
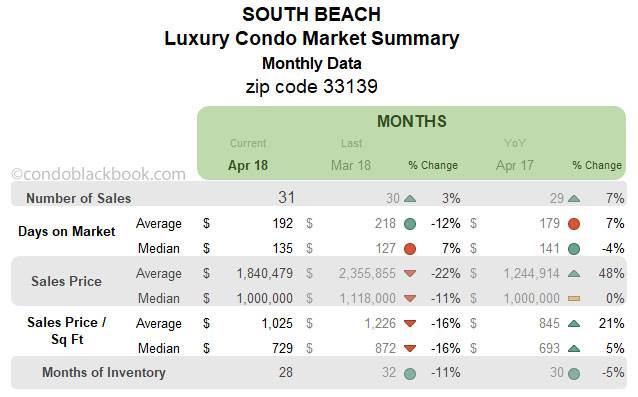
Sales post uptick over previous year and month. South Beach reports a good level of sales, posting a 3% increase over March and 7% uptick year-over-year (fig. 5.1). This begins to bring the trend line in fig. 5.1.2 a bit into balance, however, it still runs negative for the month.
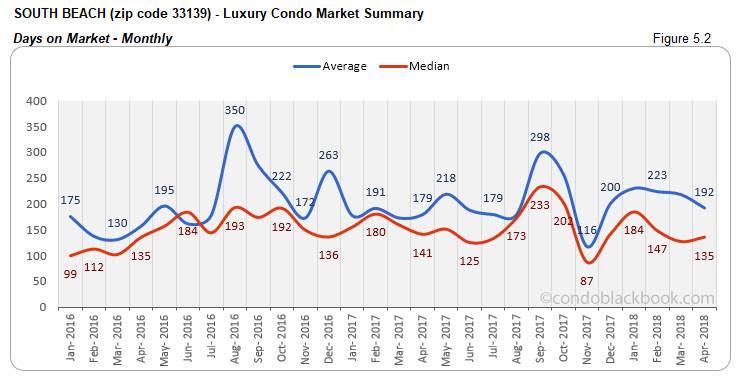
Days on market report increase. We see an upward shift in the median days on market in South Beach, with a 7% month-on-month increase in April.
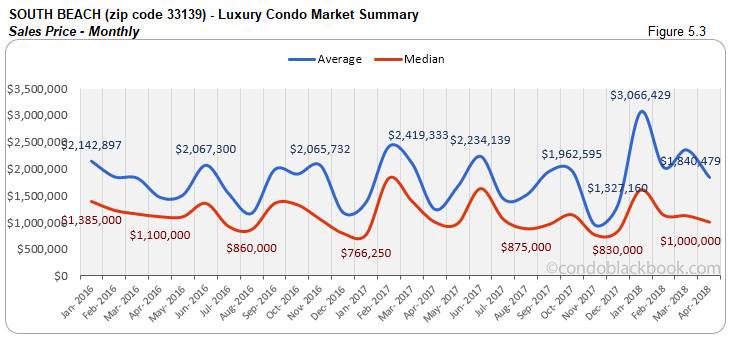
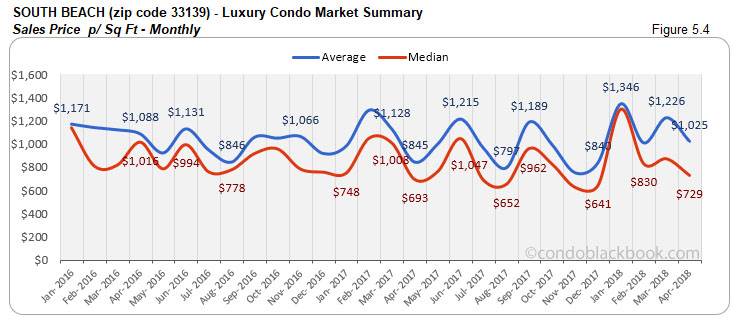
Prices adjust lower. We see the price trends go negative in South Beach this April compared to March. The price per sq. ft. is 16% lower compared to March (fig. 5.4), but the median sale price per sq ft is surprisingly up 5% year over year.. This, as Continuum on South Beach came in with a $9.3 million sale.
Inventory down 11%. We see the months of inventory drop 5% against last year and 11% compared to last month for this lively neighborhood. Even as the trend goes positive, 28 months of inventory is way off the 9-12 months of a normal market. This gives buyers ample opportunity to dictate deals by searching South Beach condos for sale here, or beginning with a tour of this popular vacation destination here.
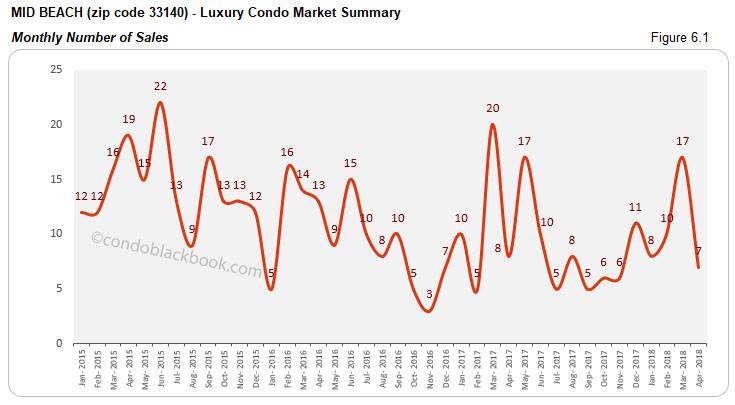
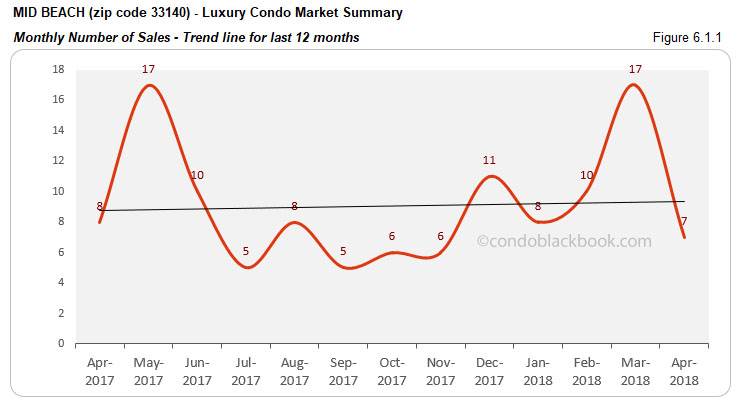
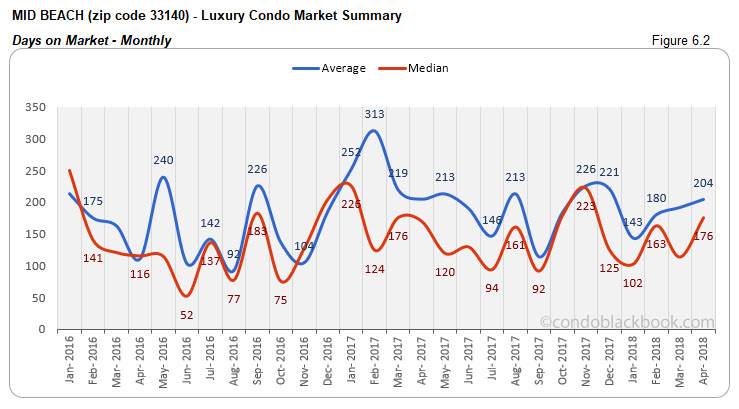
Mid-Beach Luxury Condo Market Summary (33140 zip) back to top
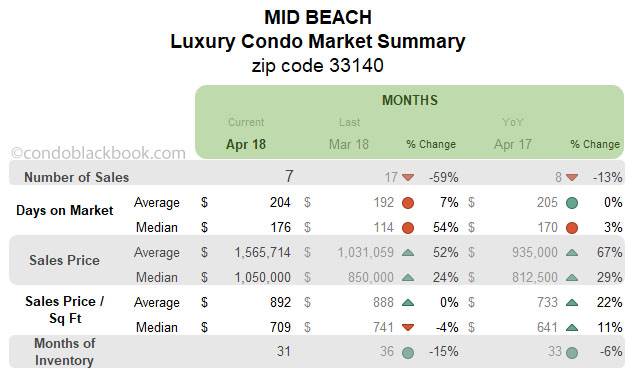
Sales take a breather to decline. It seems the luxury condo market in Mid-Beach is taking a break as sales fall this April. There is a 59% decline in the month-to-month sales and 13% drop in the year-over-year numbers. However, the 12-month trend line stays unaffected by this dip, posting a positive streak in fig. 6.1.1. below.
Days on market shoot up. There is a significant increase in the median days on market for luxury condos in Mid-Beach.
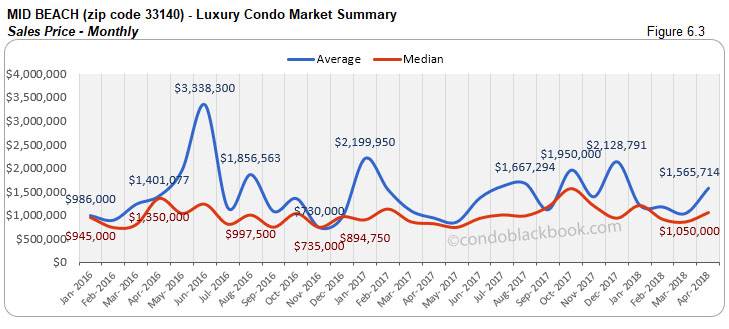
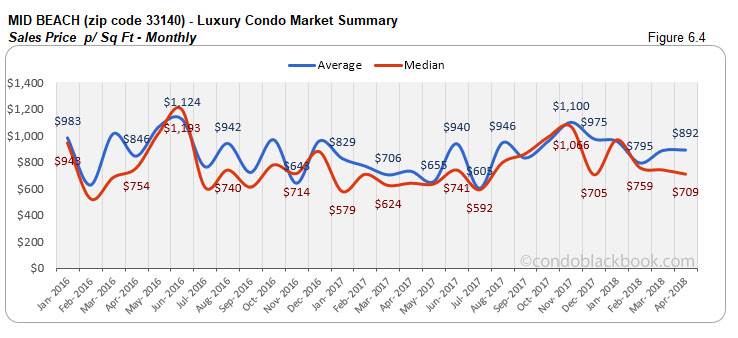
Mixed trends on prices. With the luxury segment keeping a moderation on prices, ultra-luxury sales (as high as $5 million) like that of the Edition Residences are skewing up metrics. This is why we see a 4% decline in the median price per sq. ft., opposed to an increase in the month-to-month prices. (see fig. 6.3 and 6.4 below)
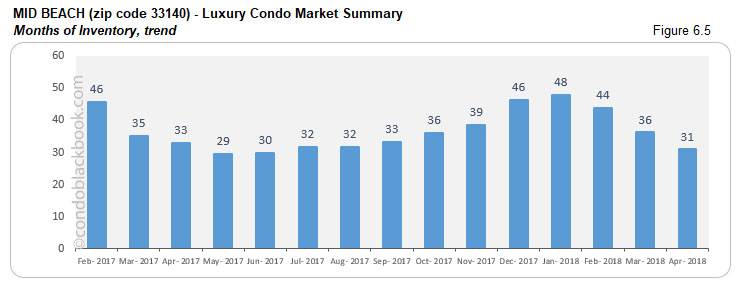
Inventory drops 15%. With levels normalizing to below previous year stats, we see the months of inventory decline 6% year-over-year in Mid-Beach. There is also a 15% drop compared to last month. Even with a positive trend, inventory is way higher than the 9-12 month mark of a balanced market. This keeps the window open for buyers to scout for deals on Mid-Beach condos for sale here, or begin with a tour of the neighborhood here.
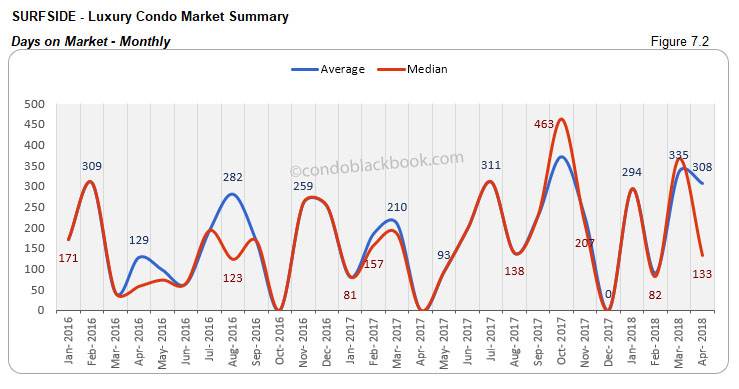
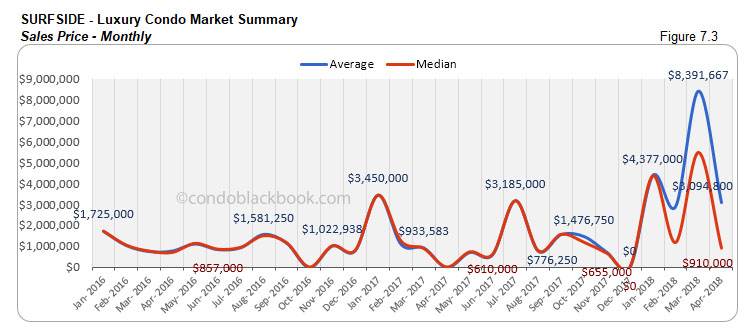
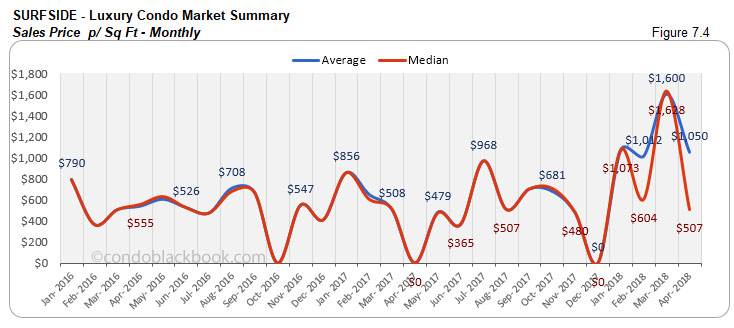
Surfside Luxury Condo Market Summary back to top
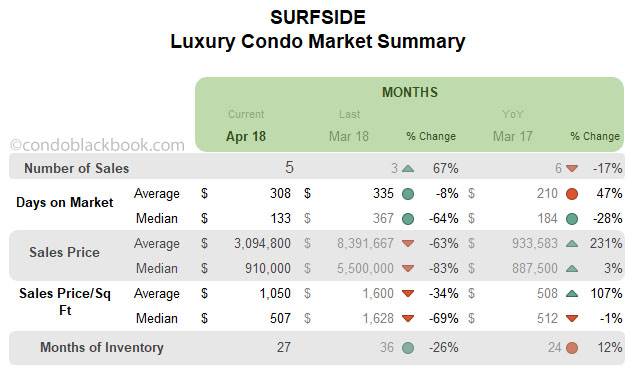
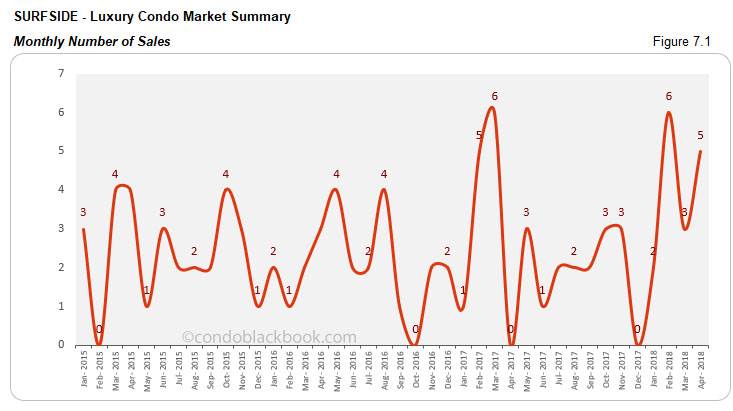
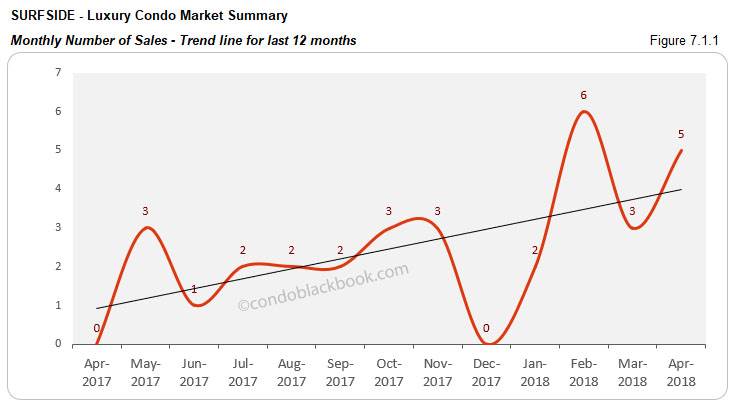
Good numbers push up trend line. We see a good jump in sales here this April (fig. 7.1). Considering Surfside is a small market for luxury condos, even 2 extra sales can end up posting great volatility (67% increase). Nonetheless, this small market has performed in April, posting an increase in both month-to-month and year-over-year trends. This positive movement also makes its impact on the 12-month trend line, giving it a generous push upwards (fig. 7.1.1).
What’s interesting to note here is that April 2017 had zero sales, so to calculate variations we’ve compared metrics to March 2017 instead.
Ultra-luxury sales skew metrics. March closed with an $18.5 million deal for a Fendi Chateau condo. However, April closed with lower priced sales of $7 million for a Surf Club Four Seasons condo and $5 million for a Fendi Chateau. This steep difference in price range is what essentially brings down the pricing in our charts below (fig. 7.3 and 7.4).
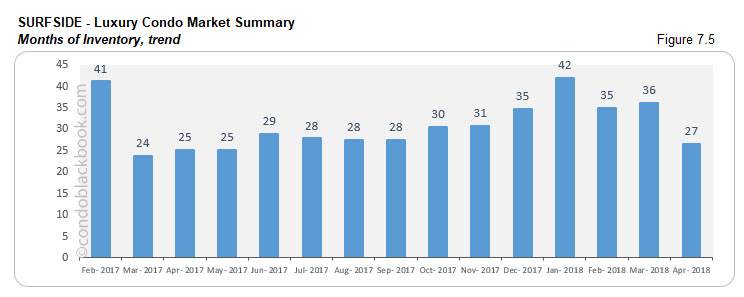
Inventory drops 26%. We see the market dynamic makes its impact on the months of inventory in Surfside too. There is a 26% decrease in inventory compared to March this year. However, 27 is still higher than the 9-12-month standard of a normal market. This gives buyers ample opportunity to drive deals in this beachside town as they search for a Surfside condo for sale here, or see what lifestyle makes up Surfside here.
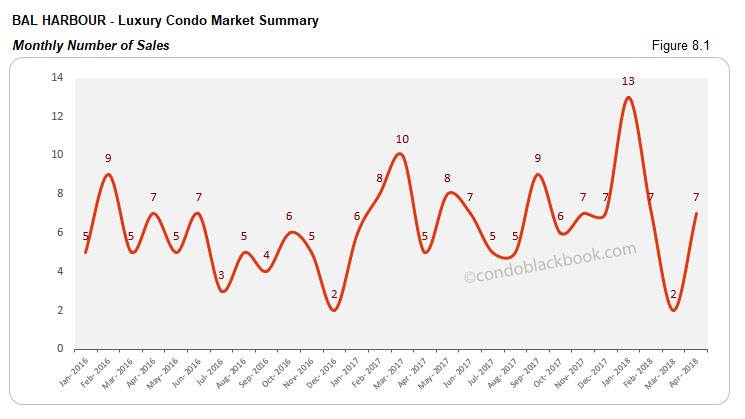
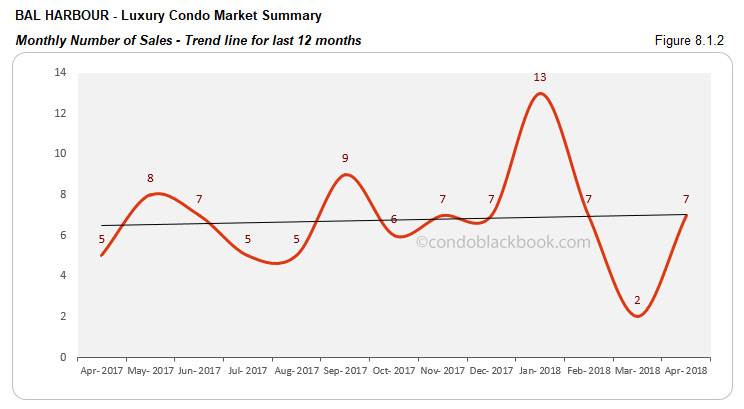
Bal Harbour Luxury Condo Market Summary back to top
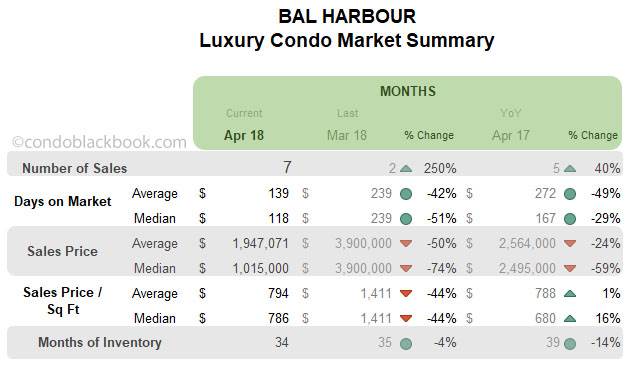
Good sales bring up trend line. We see the market momentum work its magic in Bal Harbour as well. There is a notable increase in the month-to-month and year-over-year sales. This positivity also spills over into the 12-month trend line, giving it an upward nudge (fig. 8.1.2).
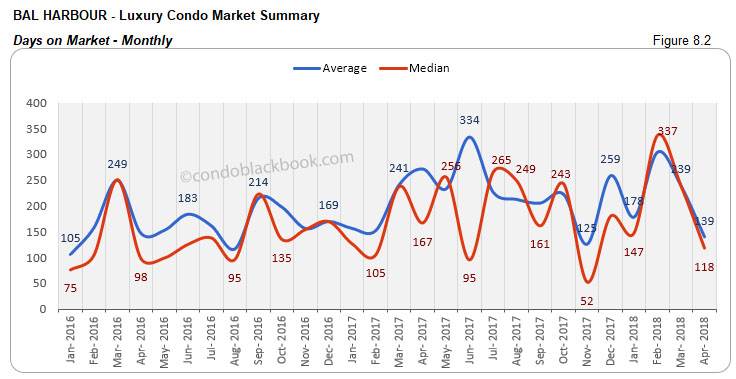
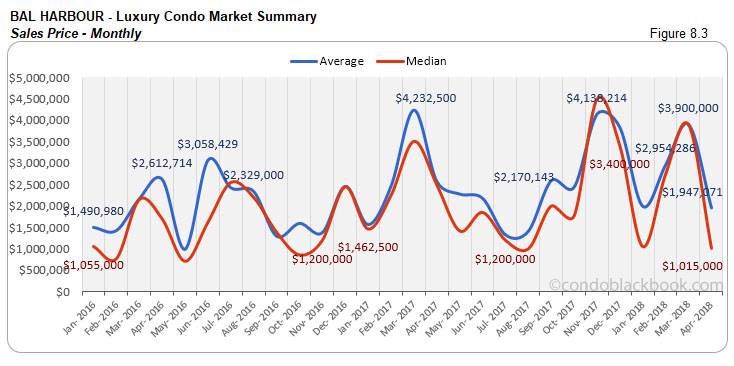
However, considering this is a rather small market for luxury condos, even a handful of sales can lead to huge volatility in metrics, which is clearly visible in the sales, days on market and price charts (see fig. 8.1, 8.2, 8.3 and 8.4 below).
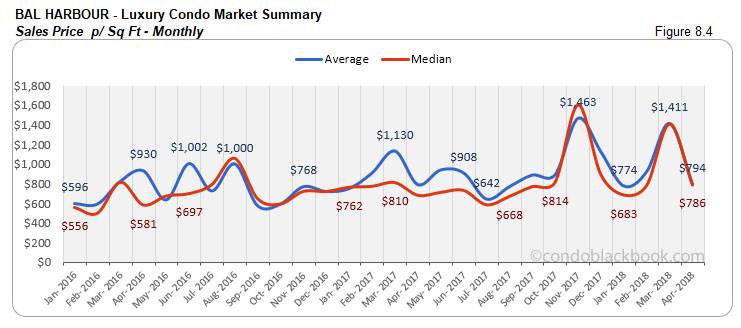
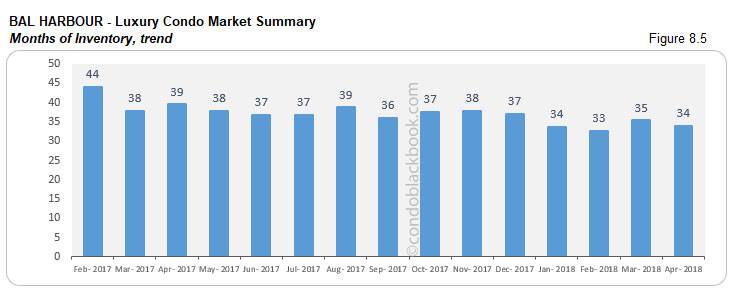
4% reduction in inventory. We see the market momentum bring down inventory 4% against last month and 14% over April 2017 in Bal Harbour. Though an impressive decline, 34 months is way higher than the 9-12 months of a balanced market. This leaves a big window of opportunity open for buyers to strike deals by searching for Bal Harbour condos for sale here, or start by checking out the upscale neighborhood here.
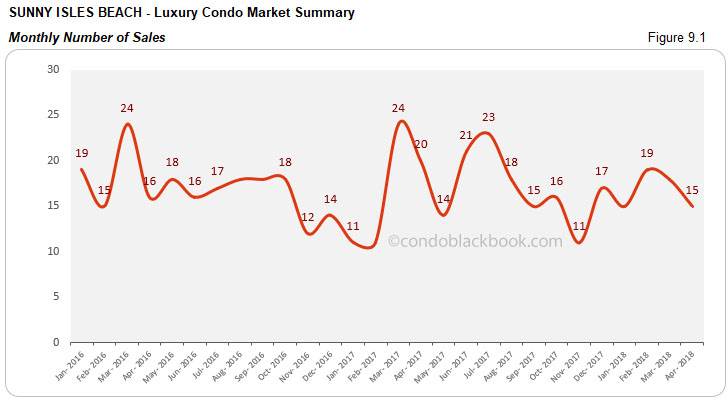
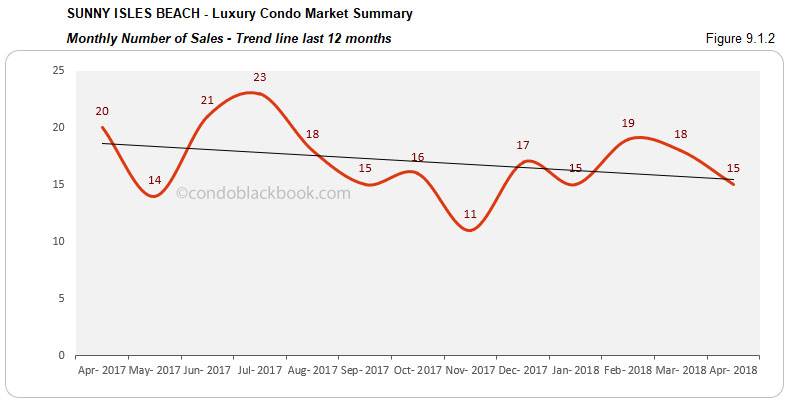
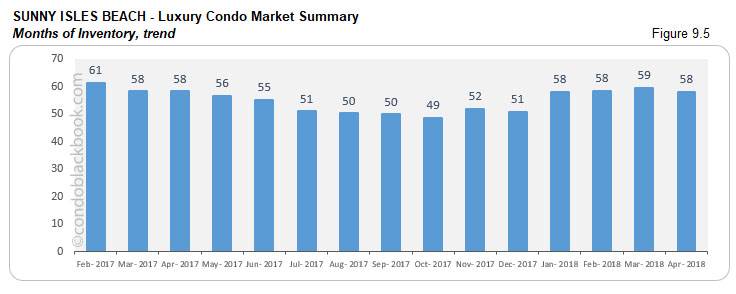
Sunny Isles Beach Luxury Condo Market Summary back to top
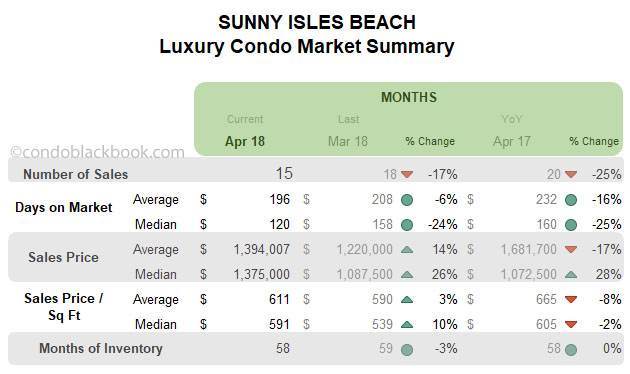
Sales move opposite of the market with a negative trend line. This is one of the few districts in our study to report negative sales this month. We see a 17% month-to-month decline and 25% year-over-year decrease (fig. 9.1). The 12-month sales trend line moves in tandem, posting a downward slant (fig. 9.1.2).
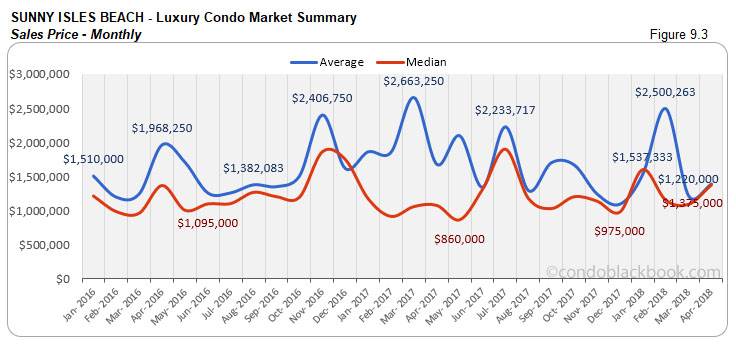
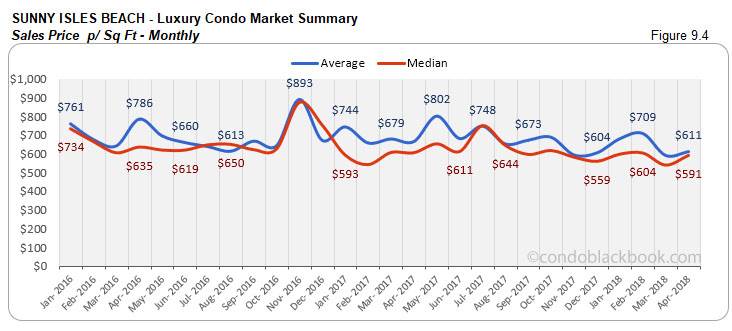
Ultra-luxury sales make prices jump. One would expect the sales price to move lower with a falling number of sales, however, we see the contrary (fig. 9.3 and 9.4). The median price per sq. ft. is 10% more than last month and median price is 26% higher. This upward move in prices can be attributed to ultra-luxury sales (above $5 million) making their presence felt.
Inventory down 3%, but not much improvement. We see inventory drop 3% over March in this sunny neighborhood, however, it still hasn’t moved since last year (fig. 9.5). With 58 months of inventory on the platter, much higher than the 9-12-month mark of a normal market, we see plenty of opportunities for buyers to strike a deal here. You could begin by exploring lifestyle options here or search Sunny Isles Beach condos for sale here.
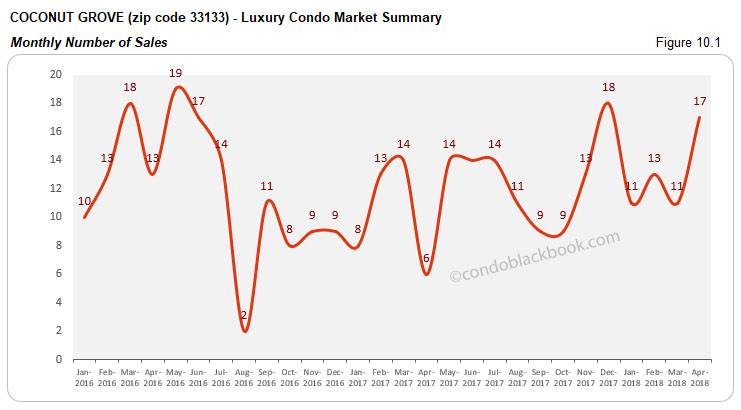
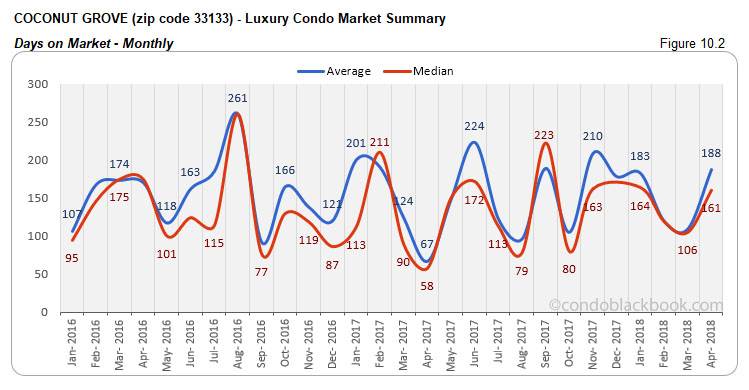
Coconut Grove Luxury Condo Market Summary (33133 zip) back to top
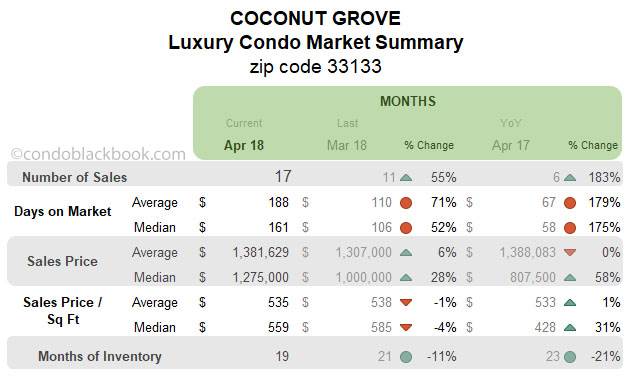
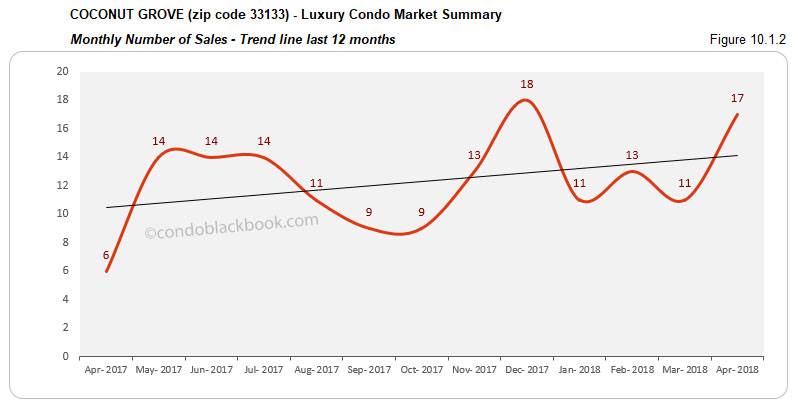
Sales spike takes trend line higher. We see some great movement in this vibrant neighborhood. There is a 55% increase in sales over March and 183% spike over same month last year (fig. 10.1). This positive dynamic also shows its impact on the 12-month trend line, making it soar in fig. 10.1.2.
.
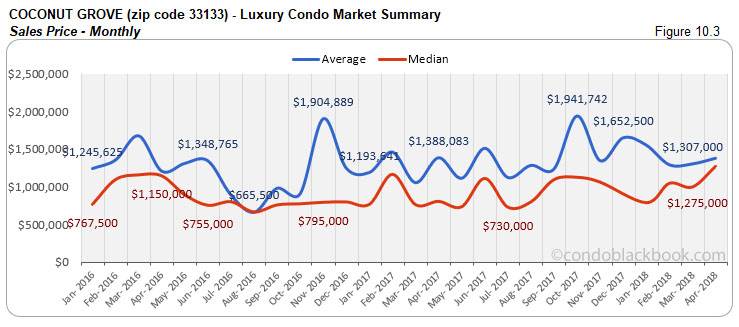
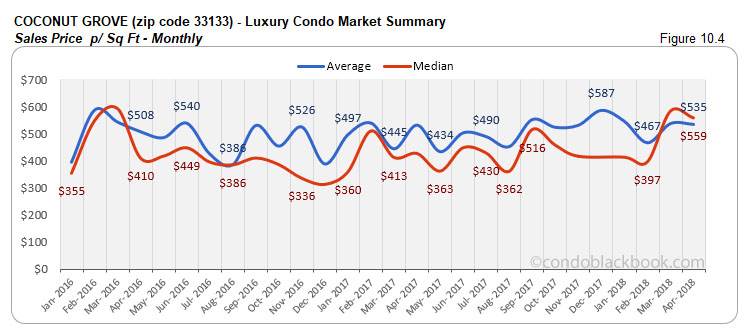
Mixed trends on prices. We see prices moving upwards (fig. 10.3) in Coconut Grove. There is a 28% month-to-month and 58% year-over-year increase to report. On the other hand, we have the price per sq. ft. falling 4%, which can be a positive sign for buyers (fig. 10.4).
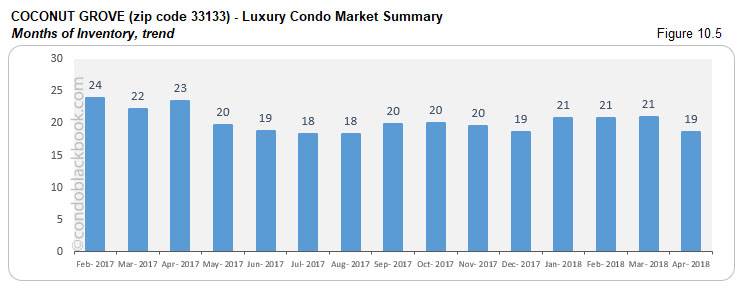
Inventory deflates 11%. We see the positive sales trend make a very visible impact on the months of inventory in Coconut Grove. There is an 11% month-to-month and 21% year-over-year decline. This makes it the most dynamic neighborhood in our study, as it is closest to reaching the ideal 9-12 months (fig. 10.5). Buyers should make haste till trends favor them by searching Coconut Grove condos for sale here, or seeing what lifestyle makes this the fastest selling neighborhood in our luxury condo study here.
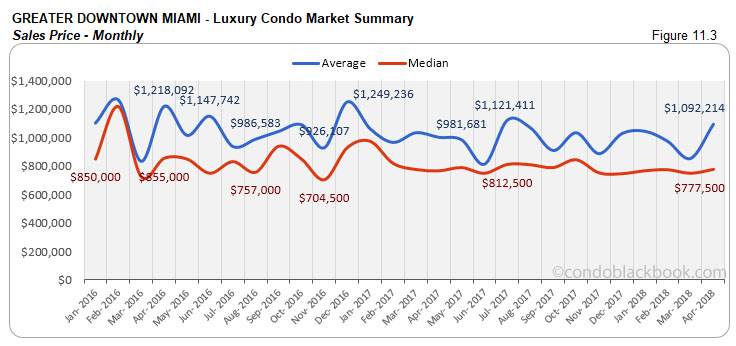
Greater Downtown Miami Luxury Condo Market Summary (33129, 33130, 33131, 33136, 33137 zips) back to top
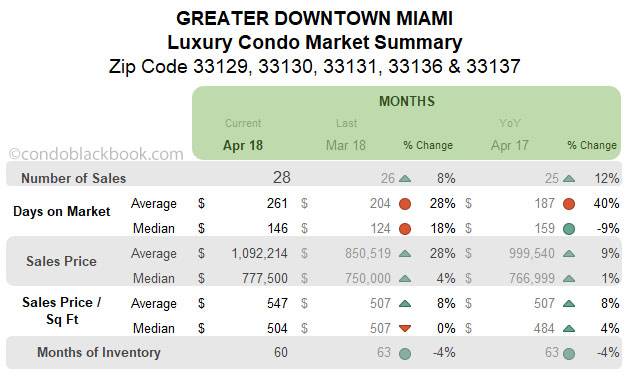
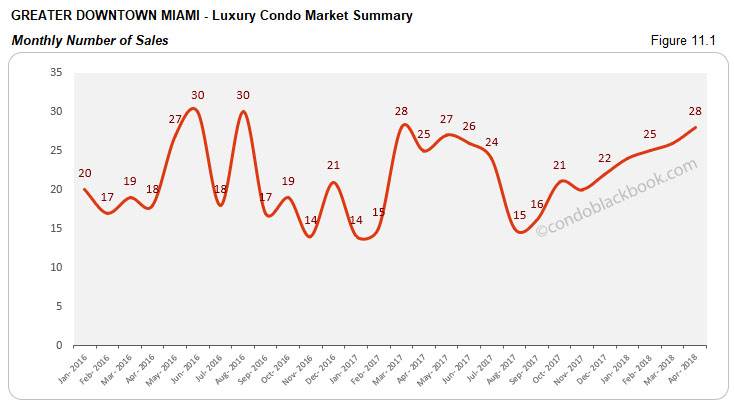
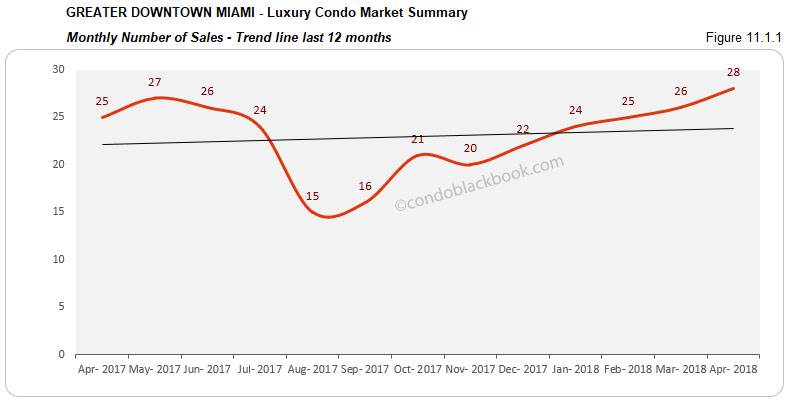
Notable sales uptick with positive trend line. Greater Downtown Miami posts good level of sales this April. There is an 8% month-to-month increase and a 12% year-over-year surge (fig. 11.1). This further pulls up the 12-month trend line into a positive for the month (fig. 11.1.1).
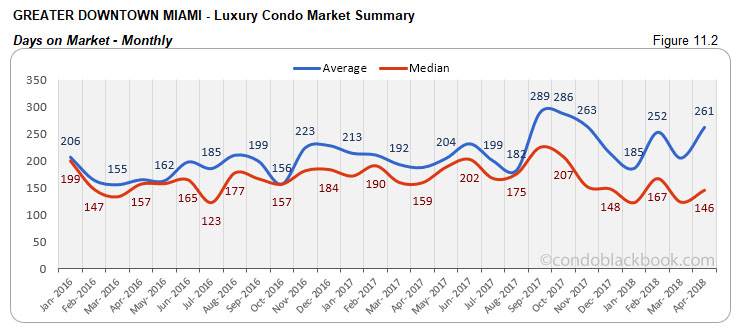
Days on market increase. Luxury condos took 18% longer to get off the market this April (compared to March) after seeing a reduction this past quarter.
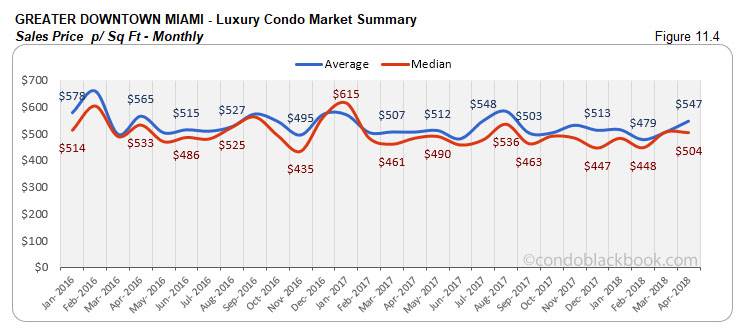
Price trends hover. We don’t see much of a variation in the price trends in this neighborhood. There is only a +/-4% change in the month-to-month median price and price per sq. ft. (See fig. 11.3 and 11.4.)
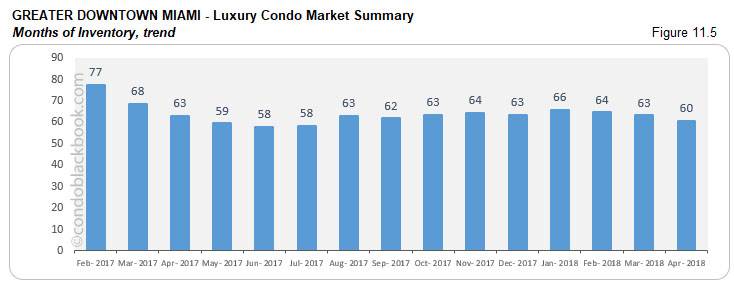
4% reduction in months of inventory. We see the months of inventory decline 4% against the previous month and same month last year (fig. 11.5). However, at 60 months, inventory is still way higher than the 9-12 months of a balanced market. Buyers still have a great opening to dictate deals by searching for opportunities in the Greater Downtown Miami area here.
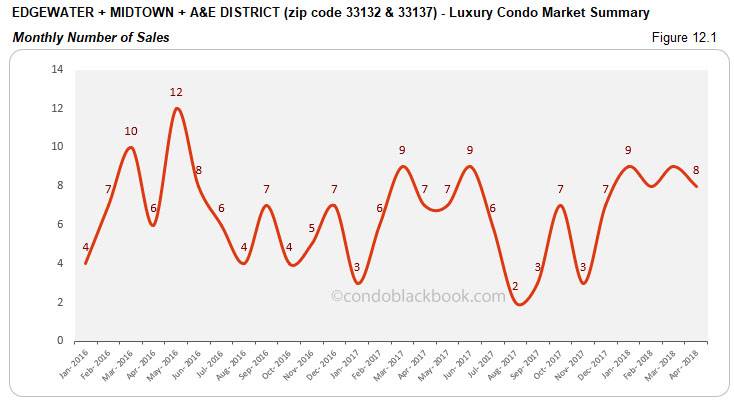
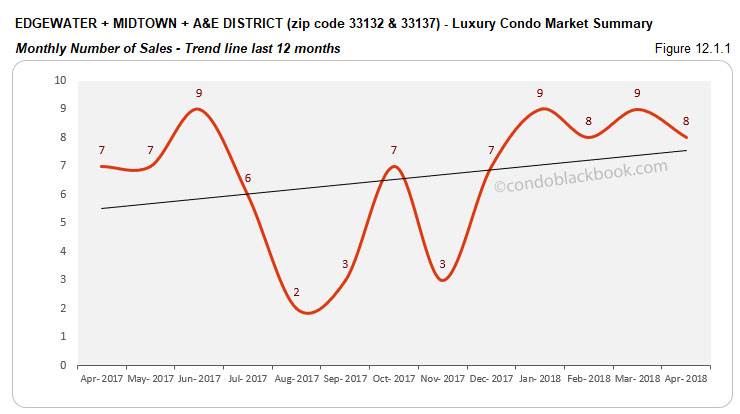
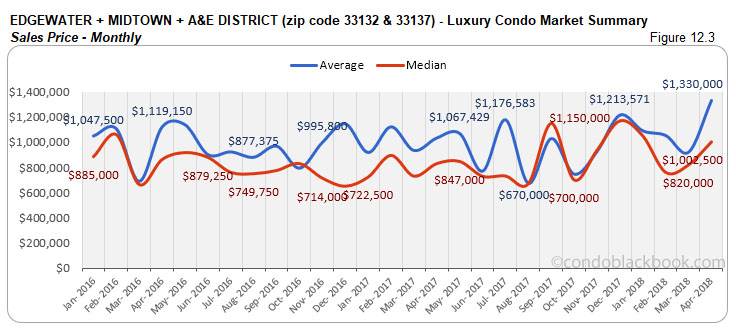
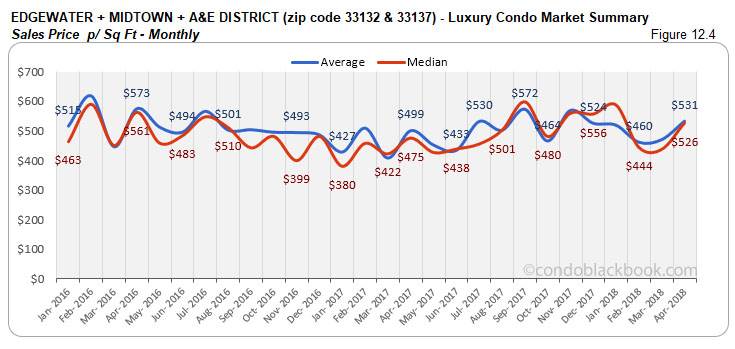
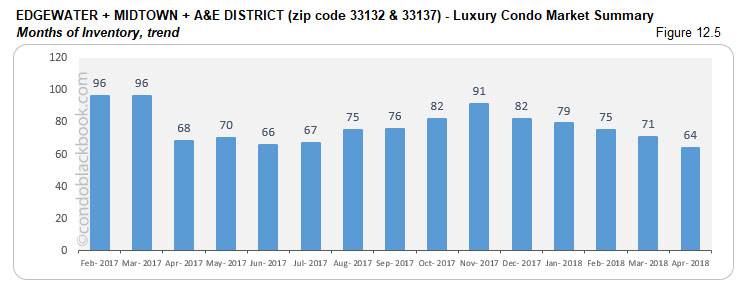
Edgewater + Midtown + A&E District Luxury Condo Market Summary (33132 + 33137 zip) back to top
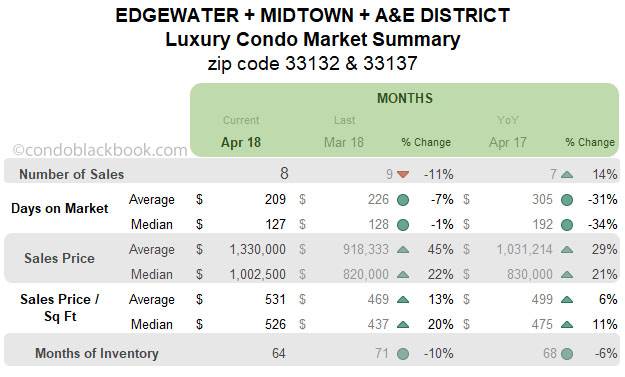
Sales hover with positive trend line. We see sales hover at around 9 or 8 a month for the past couple of months, which is repeated in April. This small market grouping reports a 14% increase in its sales over last year (fig. 12.1). This further helps the 12-month trend line maintain its positive streak in fig. 12.1.1.
Prices inch up. We see the median sales price and price per sq. ft. inch higher this April. There is a 22% increase in the median price as well as a 20% rise in the price per sq. ft. for this grouping (month-on-month). (See fig. 12.3 and 12.4 below)
Inventory deflates 10%. Another positive for this grouping is that the months of inventory is down 10% since last March and 6% lower than last year. Even with a decrease in inventory, this is one of the slowest moving markets in our luxury condos report. At 64, inventory is way higher than the 9-12 month normal of a balanced market. Buyers definitely retain their edge, as they browse through Edgewater condos for sale here or begin by exploring the individual lifestyle and condo options in Edgewater, Midtown and Arts & Entertainment District.
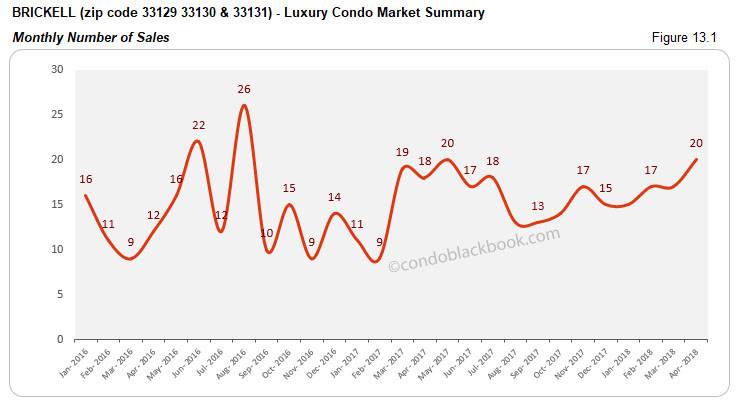
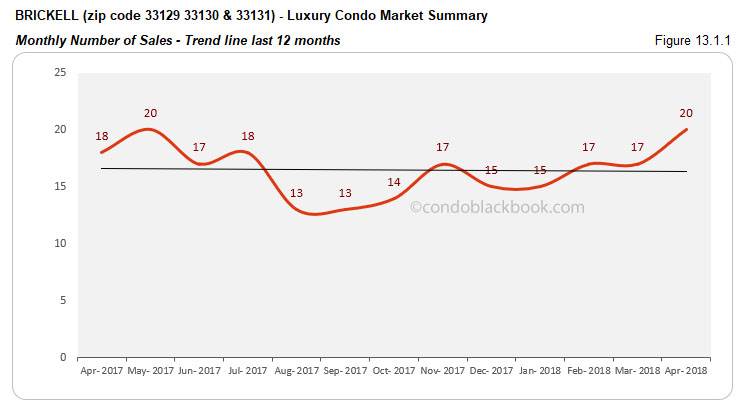
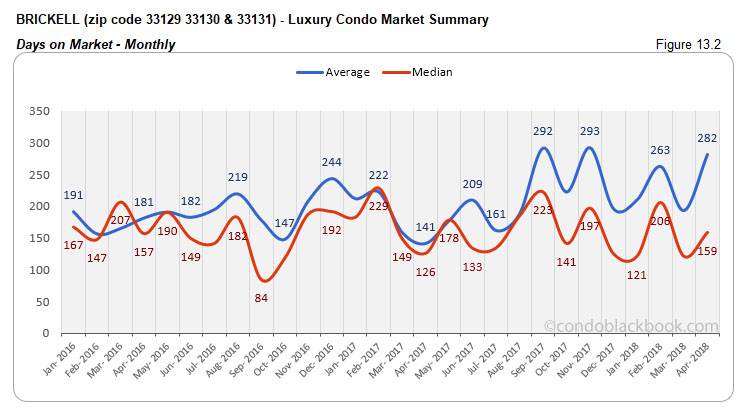
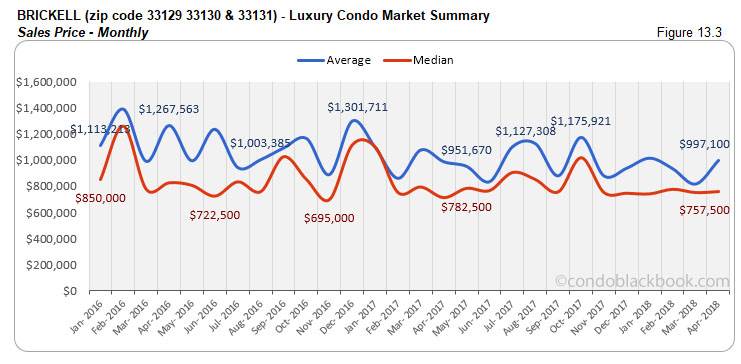
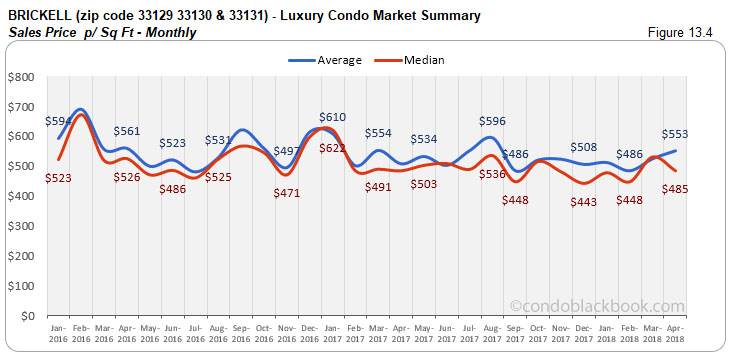
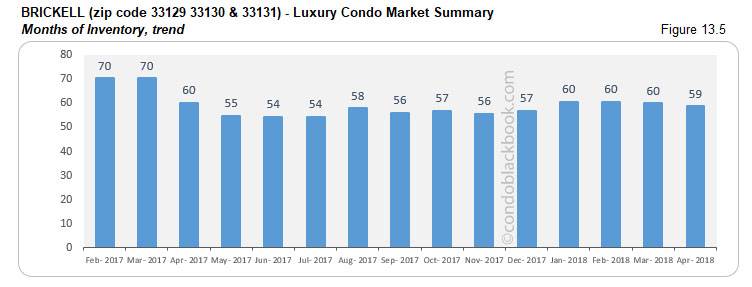
Brickell Luxury Condo Market Summary (33129, 33130, 33131 zip) back to top
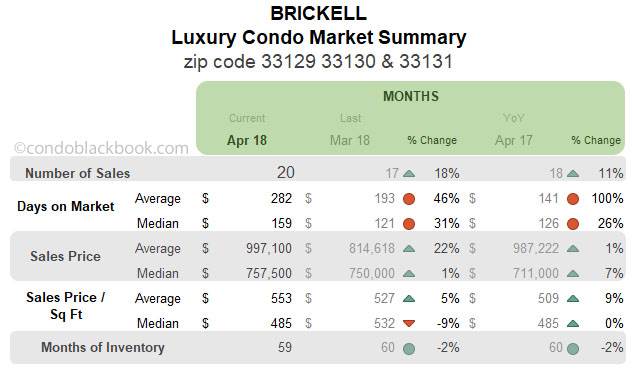
Sales post improvement with negative trend line. Brickell posts an 18% increase over March and 11% growth in sales year-over-year. Even though this is a good level of sales, we see a negative trend line in fig. 13.1.1 due to the past few months being slow.
Days on market nudge up. We see an increase in the days on market in this financial district. Luxury condos had to wait 31% longer than March to get off the market.
Marginal shift in prices. There is only a marginal shift in prices to report for Brickell this month. The median sales price and price per sq. ft. only moved +/-9% compared to March. (See fig. 13.3 and 13.4)
Small dip in otherwise high levels of inventory. We see months of inventory drop 2% against last month and same month last year. Though this is a positive, 59 months is way off the ideal 9-12-month mark of a balanced market. This gives buyers an upper hand in negotiations as they search Brickell condos for sale here or take a tour through Brickell here.
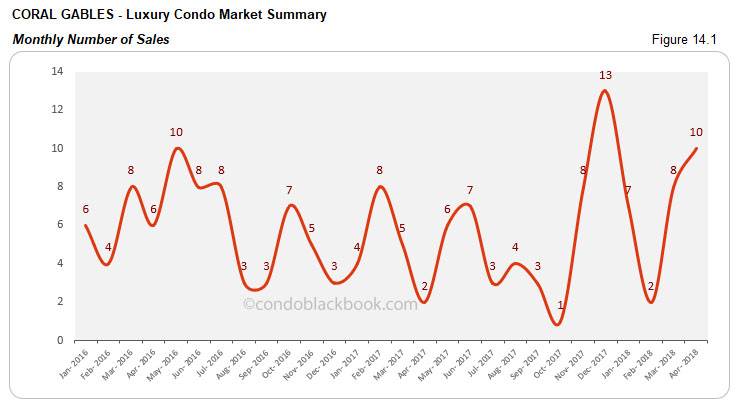
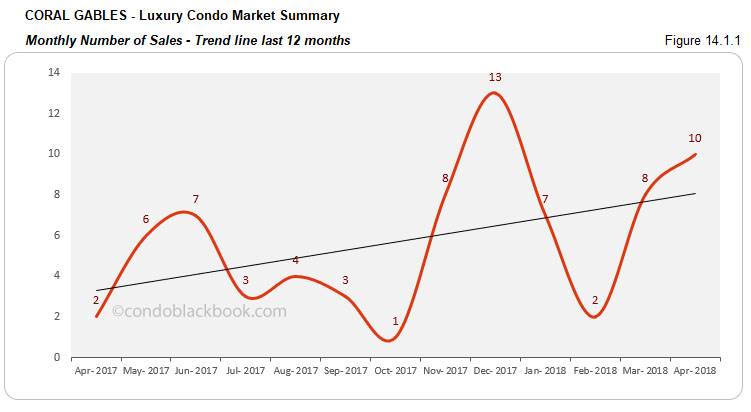
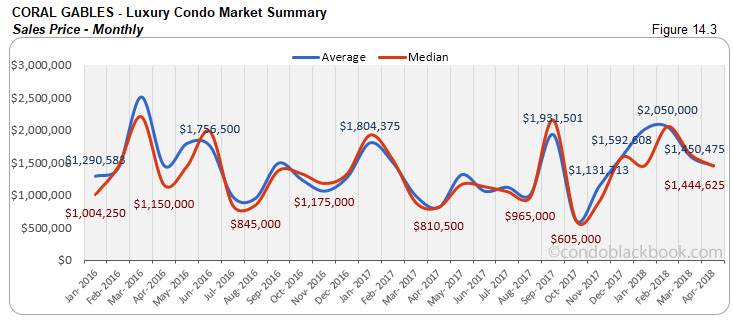
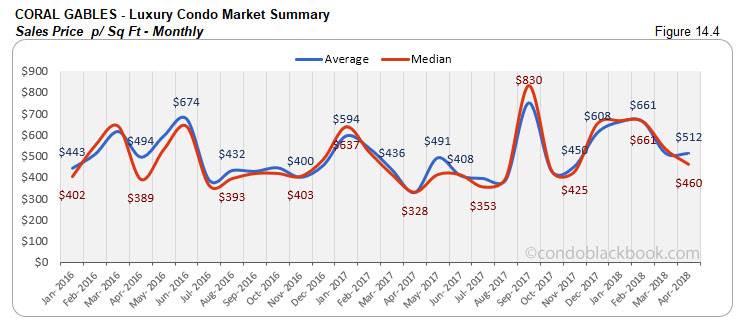
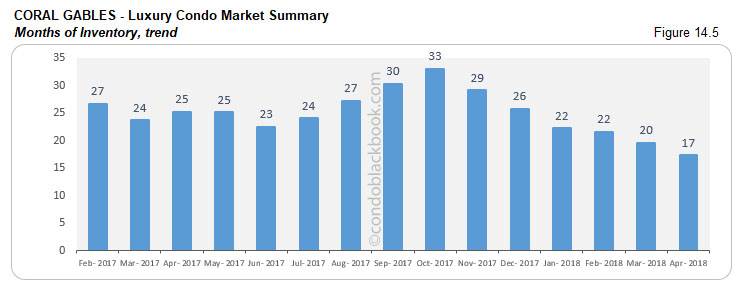
Coral Gables Luxury Condo Market Summary back to top
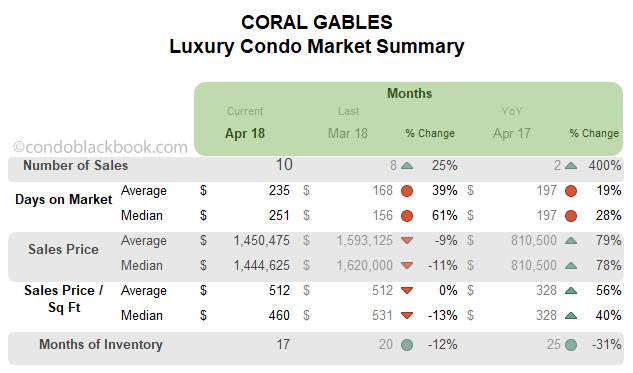
Sales spike to pull up trend line. We see an uptick of 25% in the month-to-month sales and 400% in year-over-year numbers. This gives this historic neighborhood a positive trend line that indicates good momentum over the past 12 months (fig. 14.1.1).
Prices report mixed trends. On one hand, we have the month-on-month median price and price per sq. ft. post declines. On the other, we see an increase of up to 78% in the year-over-year median price. (See fig. 14.3 and 14.4)
Progressive decline in inventory. We see Coral Gables report a 31% drop in inventory against last year and 12% decline compared to last month. Being the closest to achieving the ideal 9-12-month situation of a balanced market, this is one of the most dynamic neighborhoods in our study. With trends moving towards a balance, buyers should be quick to grab deals by searching Coral Gables condos for sale here, or checking out the lifestyle options in Coral Gables here.
Conclusion back to top
Market trends continue favoring buyers. Even as most neighborhoods post an increase in sales, we still see high levels of inventory throughout our study. This points to buyers still being in control and able to dictate deals. Perhaps the market could lower its prices to incentivize buyers and maintain trends to create a shift towards a more balanced scenario.
Love what you see? Don’t forget to share our blog and subscribe (see the subscribe link on the top menu) to receive the latest market news in your inbox.
Have any questions? Or see something wrong with the stats? Please contact Sep at sniakan (at) hbroswell.com or call 305-725-0566.
Share your thoughts with us

Your Miami Condo Awaits
Recent Posts


 (305) 697-7667
 (786) 321-7233
  contact@condoblackbook.com

