Luxury Miami Condo Market Trends: Q1 2019 Report

Apr 26, 2019 April 26, 2019
- Miami Luxury Condo Market Report: Summary
- City and Neighborhood Luxury Condo Reports
Miami Luxury Condo Market Report: Summary
It’s the first quarter of the year, and the numbers are in. Read on to find out what kind of a tone has the luxury condo market set for the rest of the year and what kind of discounts on prices are luring buyers from all corners.
For the purpose of this luxury condo report, we have only considered properties priced $1 million and above (last year we considered $600K and above but adjusted due to feedback). Also, properties priced $5 million and higher have been referred to as ultra-luxury.
Overall Market Highlights:
- Q1 sales try catching up to previous year levels overall
- Market momentum supports positive outlook for next quarter
- Overall days on market hover, showing shared buyer and seller interests
- Prices per sq. ft. drop in most Miami neighborhoods
- Inventory drops through Q1 in most neighborhoods
- Buyers still in control of the market
Soft Q1 acts as an indicator of stronger Q2. Most neighborhoods in our study report soft first quarter numbers against same quarter previous year. The mid-market, which we did not analyze in this report, was strong, while luxury stayed soft. Considering the best quarter of the year is next in line, we can fairly expect a stronger pickup than what we’ve seen in recent years. We also noticed that there were plenty of sales in progress (pending sales) during the publishing of this report, which gives us a stronger belief that the next quarter should come back stronger.
Overall days on market hover with most neighborhoods reporting a decline. This is quite a positive indicator for the luxury condo market in Miami, showing that buyers and sellers have been coming to a consensus sooner and not losing much time over negotiations.
Overall prices post declines, much to the delight of buyers. A majority of the neighborhoods in our study have reported a downward trend in their year-over-year prices. This has been acting as a major motivation factor for buyers, the results of which we expect to see with a stronger Q2 and the rest of the year in general.
Inventory levels predicted to drop. Considering we have raised the minimum parameter for luxury condos from $600K to $1 million, this makes the metric behave a little differently this quarter. This essentially means, we have a narrower class of inventory comparing to a bigger pool of historical numbers, which automatically brings down levels for the quarter. Nonetheless, we still expect inventory levels to actually reduce over the course of the next few quarters, since there is not much new product ready to hit the market in 2019.
Overall, we see 2019 opening in favor of the buyer. However, if Q2 sales come in as expected, we could be looking at a game changer that could nudge the market towards a balance by the end of the year. Until then, buyers should enjoy all the choices and opportunities a buyer’s market brings with it.
Where Does the Condo Market Go From Here?
With 2019 again opening in favor of buyers, here are a few factors that could (and some have even started to) take effect to help push the market back into balance:
- Better priced deals push buyers to act sooner. The one thing we noticed during our Q1 study is that the prevalence of lower prices and good deals has been pushing buyers to pull the trigger on purchases without much hesitation. This comes in as a big contrast to previous months and recent years. So, even though we have a seemingly soft Q1, we do expect to see a better Q2 with a significant jump in sales from recent years.
- Inventory levels to see better momentum. Since there is less new product to be delivered in 2019, as there are not many condos currently under construction, it should get easier to chip away at current inventory levels. Also, with prices reporting a downtrend, many owners may wish to wait out this cycle and pull their units off the market, which would further help take down the luxury condo inventory.
- High tax states continue pushing in new buyers. By now it has become pretty evident that the implementation of the SALT tax laws pushed a significant number of domestic buyers towards tax-saving states like ours. Since a resident of Miami has all these taxes to save, we expect more out-of-towners to come in with inquiries.
- Recent dip in interest rates could act as the perfect nudge. As mortgage interest rates dropped during the past couple of months, this could end up creating renewed interest in people who may have thought that they lost their only chance at nabbing historically ultra-low rates.
Below is an insight into Miami’s overall and neighborhood-level luxury condo trends for Q1 2019:
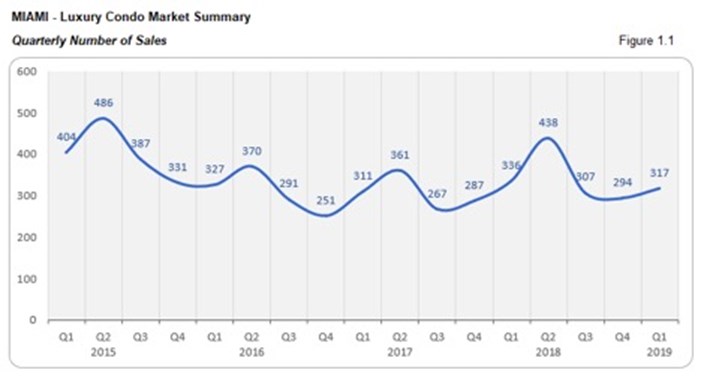
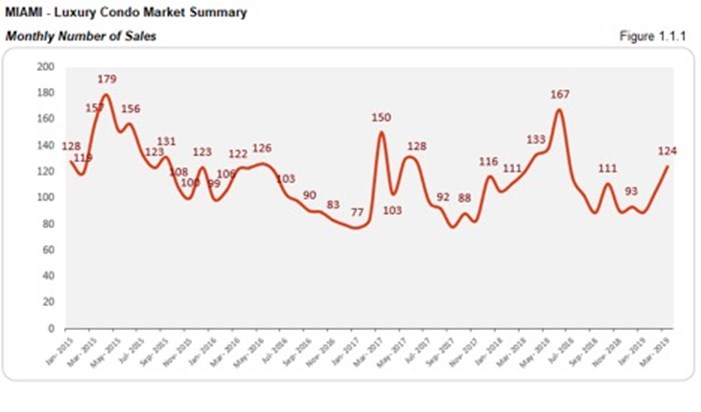
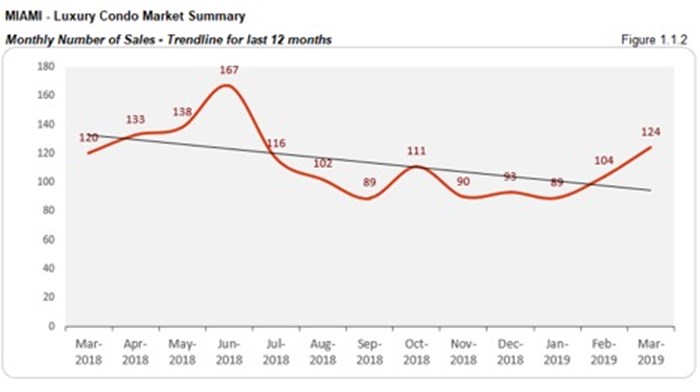
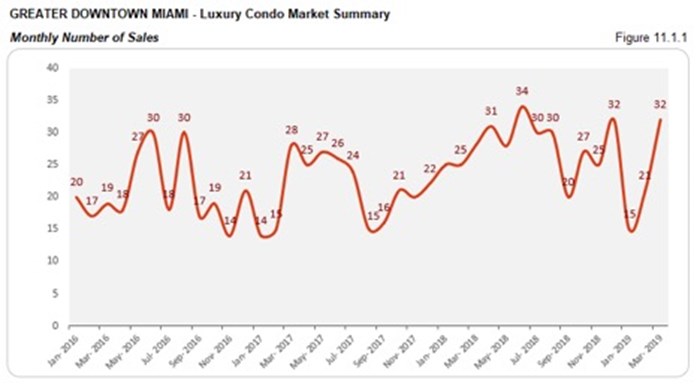
Monthly Number of Sales - Miami Luxury Condo Market Overall
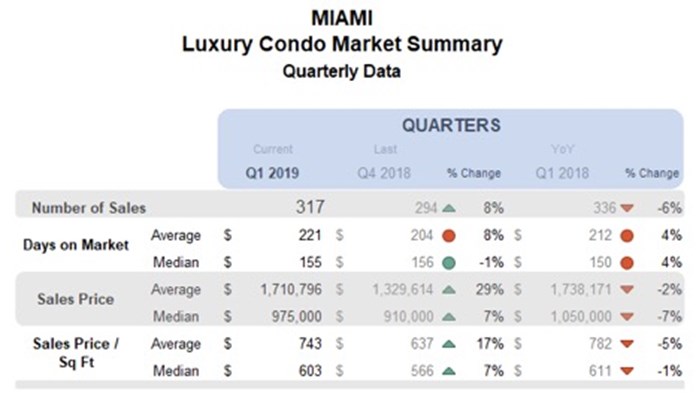
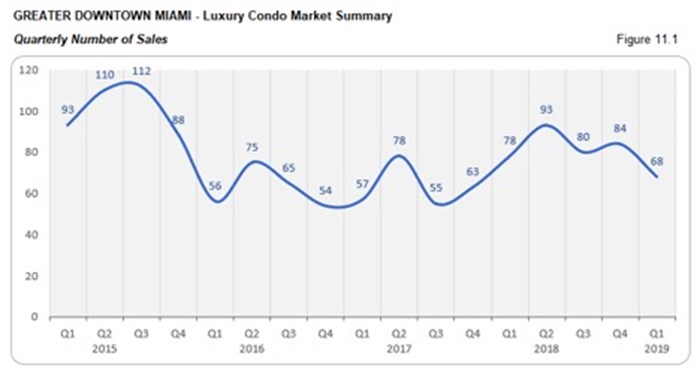
QoQ sales indicate a positive next quarter, even as YoY numbers slack with a negative trend line. It’s the first quarter of the year and sales are already showing signs of a pickup. There is a definite boost of 8% against Q4 last year. And, even though the sales are 6% short of Q1 2018, they are still 2% higher than Q1 2017 (fig. 1.1). However, the luxury condo market’s still looking at a negative trend line as of now (fig. 1.1.2).
Additionally, our internal analysis shows that there are quite a few pending sales that did not make it to this report and hint at a strong Q2. It’s also interesting to note that the first quarter of the year is always second best and a precursor of what to expect next. On the basis of that, we can safely assume that Q2 2019 might just outdo the previous years.
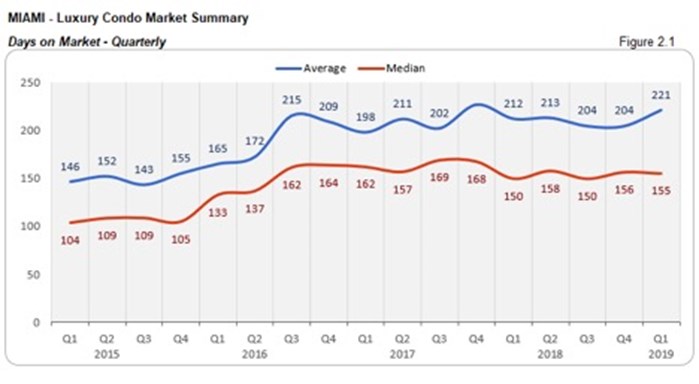
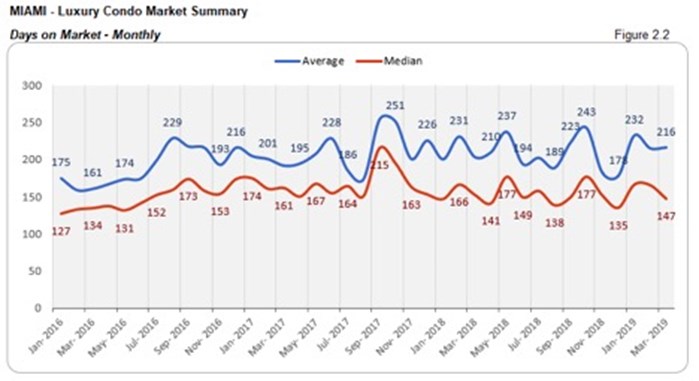
Days on Market - Miami Luxury Condo Market Overall
“Days on market” are the total number of days from when a property is active to the day it goes under contract.
QoQ and YoY numbers hover, showing matched buyer and seller interest. Overall, luxury condos spent almost the same amount of time on market as the previous quarter and Q1 2018 (fig. 2.1). While the median days on market posted a 4% increase against Q1 2018, they did decline by a percent against Q4 2018. This just shows that buyers and sellers weren’t that divided in their interests.
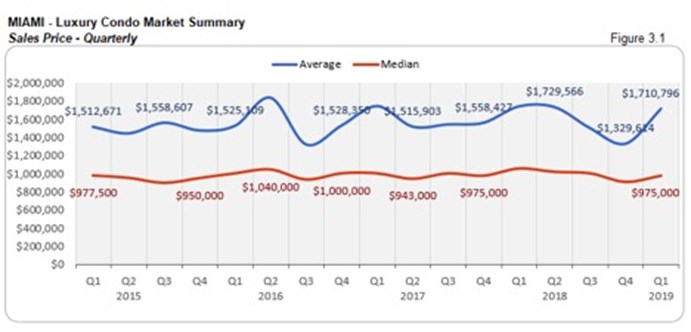
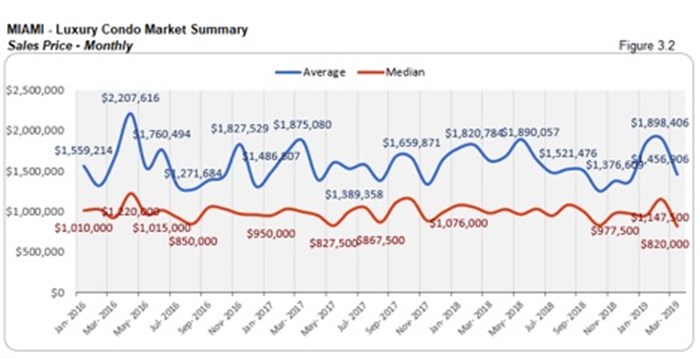
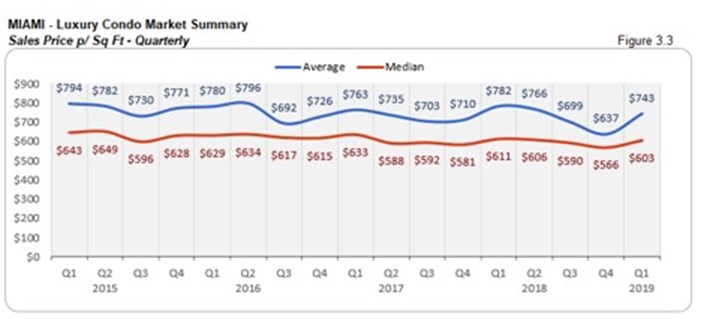
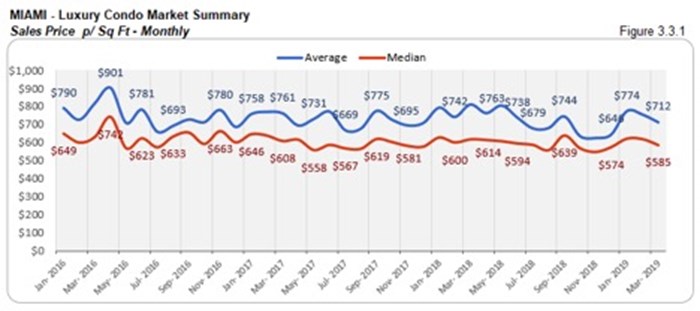
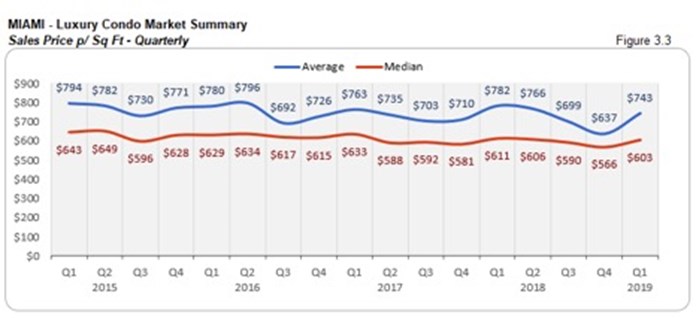
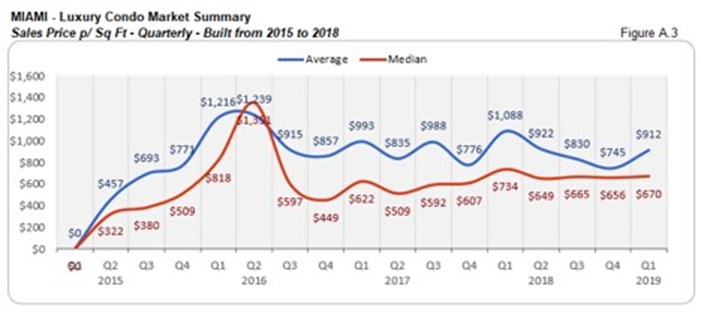
Sales Price Trends - Miami Luxury Condo Market Overall
Overall, YoY prices post decline. In our year-over-year analysis, it becomes pretty evident that there has been a decline in the median prices for the luxury condo market in Miami. There is a 7% dip in the median sale price (fig. 3.1) and 1% dip in the median price per sq. ft. (fig. 3.3) compared to same quarter last year. This shows how a buyer’s market has left its mark on pricing and sales. Below is a detailed analysis of how prices fare on the basis of age of construction for luxury condos in Miami.
YoY price per sq. ft. drops for luxury condos built 2015 to 2018. Q1 reports the median price per sq. ft. for newly built luxury condos as $670 (fig. A.3). This is significantly lower than last year’s $734 per sq. ft. Even with premium amenities, buyers were able to exert pressure on the prices of these newly built condos, showing the impact of this buyer-favoring market.
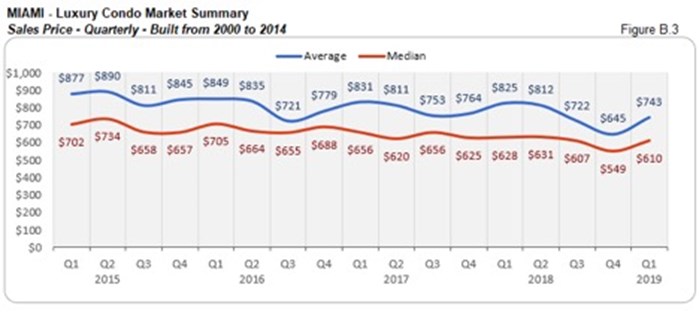
YoY price per sq. ft. dips for luxury condos built 2000 to 2014. Fig. B.3 clearly shows how the median price per sq. ft. has dropped from last year’s $628 to $610 this quarter in this category of condos as well.
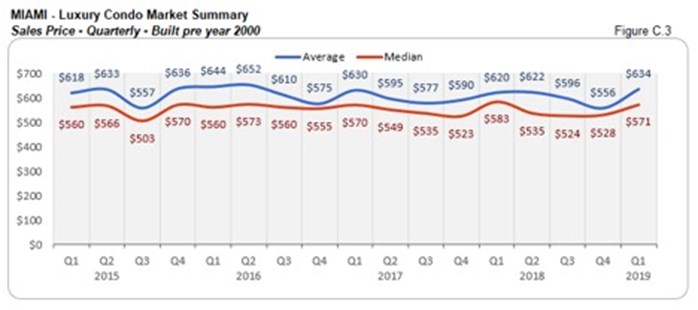
YoY price per sq. ft. slip for luxury condos built pre-2000. The year-over-year sales (fig. C.2) and price per sq. ft. declined for condos built before 1999. The median price per sq. ft. closed at $571 for the first quarter, which is lower than last year’s $583.
Sales Price Trends considering Building year - Miami Luxury Condo Market Overall
ALL BUILDINGS
BUILDINGS (2015 to 2018)
BUILDINGS from 2000 to 2014
BUILDINGS from 1999 and older
End of year built report
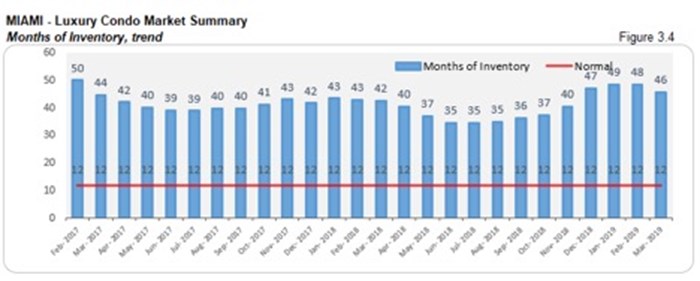
Inventory Trends - Miami Luxury Condo Market Overall
A balanced market will only have 9-12 months of inventory. The months of inventory are calculated as – no. of active listings + no. of pending listings divided by the average number of deals in the last 6 months.
*From this year, we are only going to consider properties priced $1 million and upwards for our luxury condo study, instead of the previous $600K benchmark. This means, that while the historical data featured in our inventory charts compares to condos priced $600K and above, starting January 2019, our numbers only represent properties priced $1 million and higher.
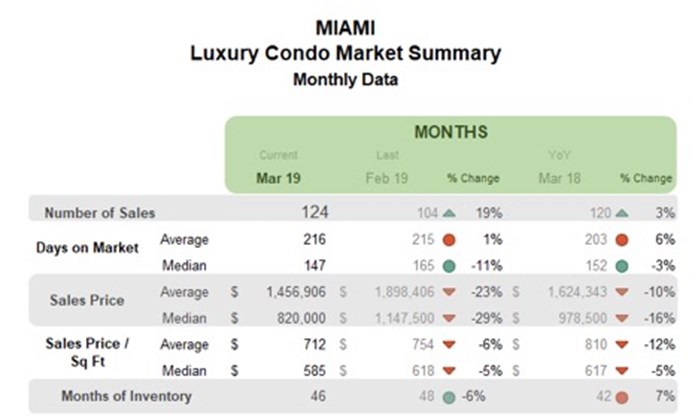
Inventory posts decline over first quarter, but up 7% YoY. We see a steady decline in inventory numbers throughout this first quarter. From January’s 49, months of inventory went down to 46 this March. However, the metric is still far from the ideal 9-12 months mark of a normal market, and 7% higher against last year, showing that buyers can still have a field day going into negotiations.
City and Neighborhood Market Reports
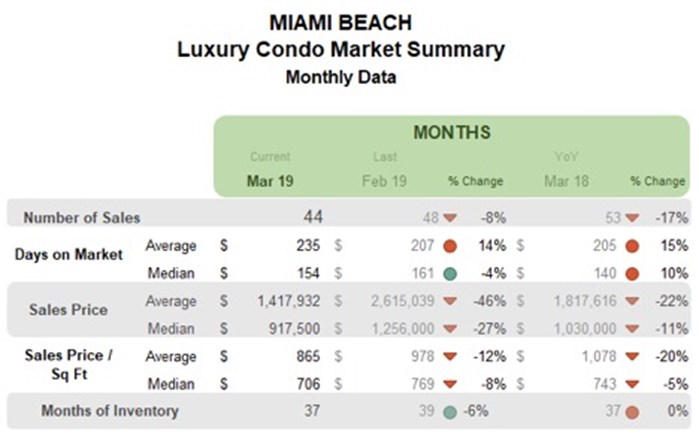
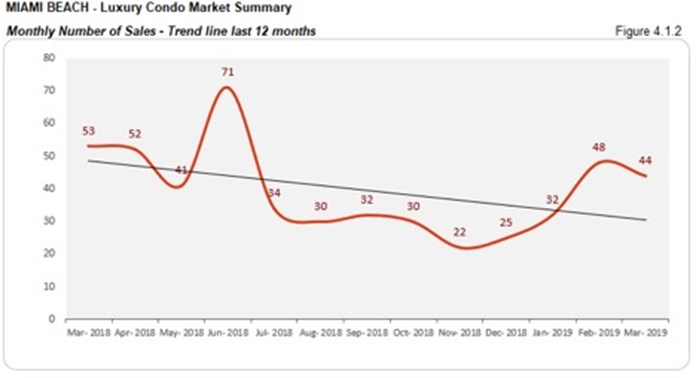
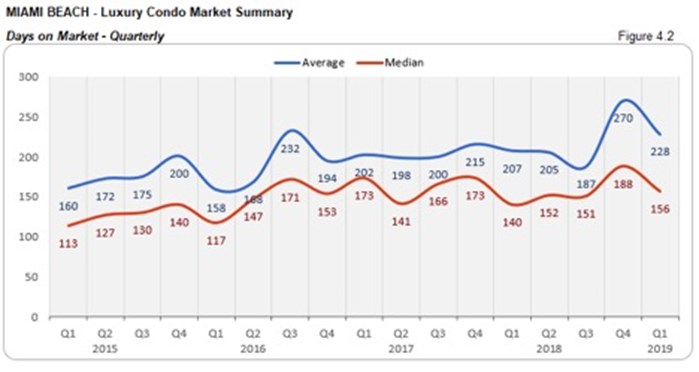
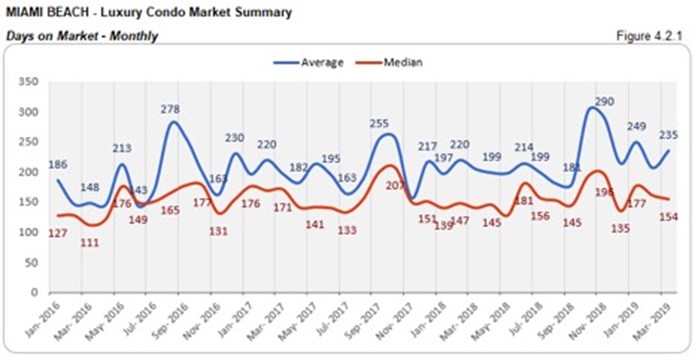
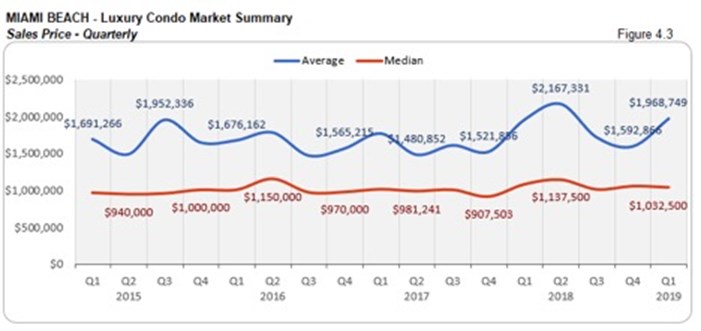
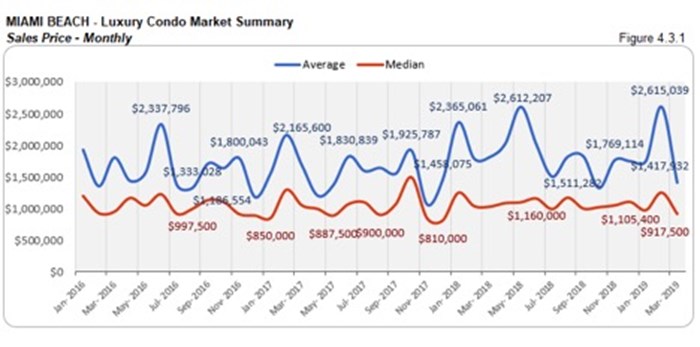
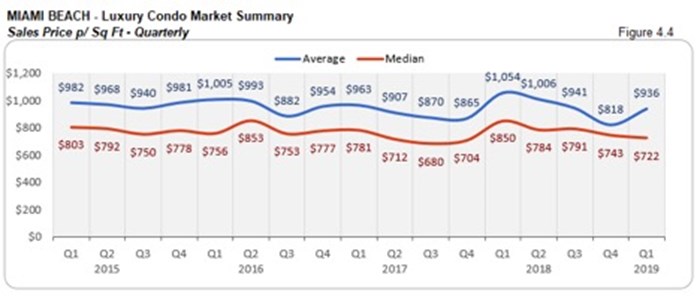
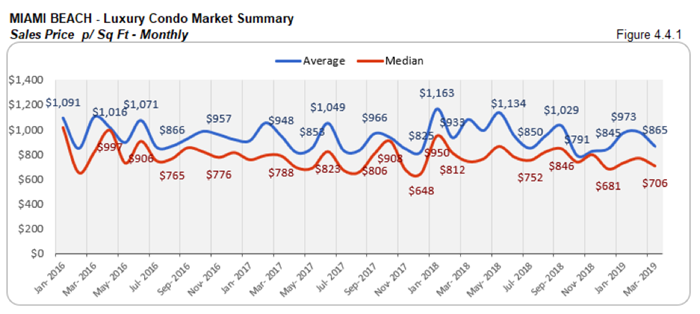
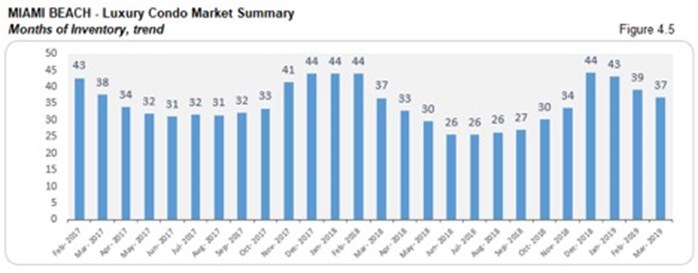
Miami Beach Luxury Condo Market Summary
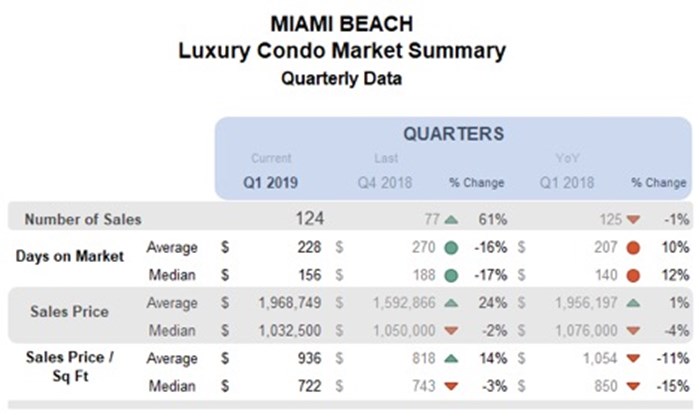
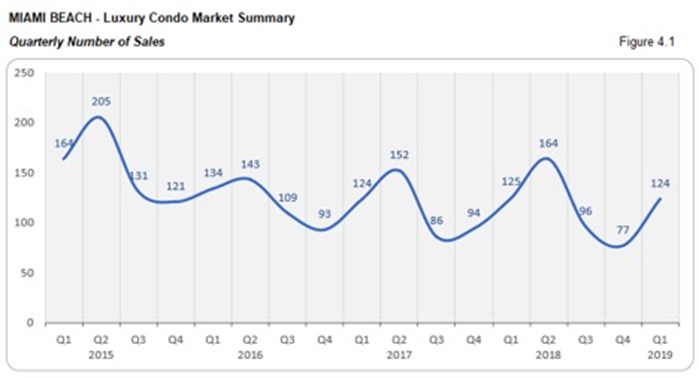
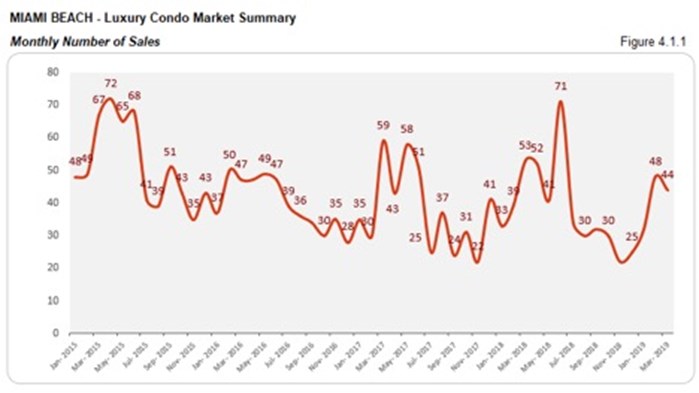
QoQ sales jump, with YoY numbers hovering, and a negative trend line. We see a significant bounce in the quarter-over-quarter sales, as Miami Beach reports an increase of 61% over Q4 2018 (fig. 4.1). Even Q1’s sales figures match last year’s numbers, showing good progress. However, the trend line in fig. 4.1.2 is still negative, which will hopefully turn positive by the next quarter, if Q1 is to be taken as any kind of indicator.
Days on market deflate QoQ. There is a 17% decline in the median days on market for luxury condos compared to Q4 2018. This shows that buyers and sellers found it easier to come to a consensus this first quarter. However, with the trend being higher year-over-year, there is still much ground to be covered. (see fig. 4.2 and 4.2.1 below)
YoY prices dive in Miami Beach. There is a 4% decline in the year-over-year median price and 15% drop in the price per sq. ft. of this coastal district. This just shows how sellers have been more accommodating of this buyer’s market and its demands. (see fig. 4.3, 4.3.1, 4.4 and 4.4.1 below)
Inventory deflates by quarter-end, but stays put YoY. We can see a consistent decline in the months of inventory throughout this first quarter. This helped close Q1 with 6% less inventory, matching last year’s levels. However, at 37 months, the metric is still far away from its ideal 9-12 months, giving buyers ample opportunity to grab deals as they search Miami Beach condos for sale here.
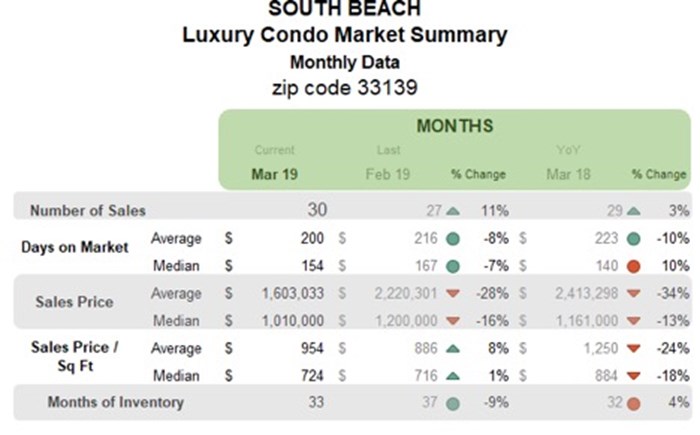
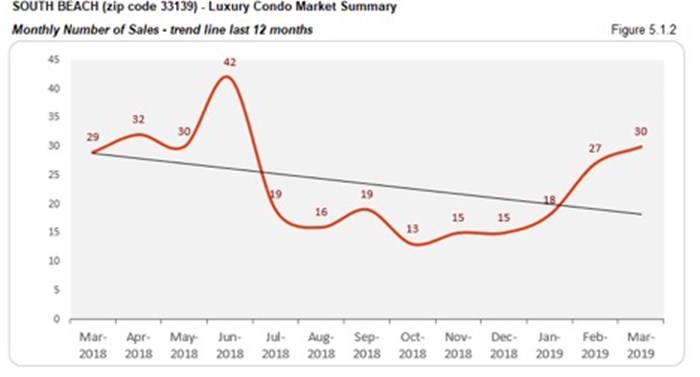
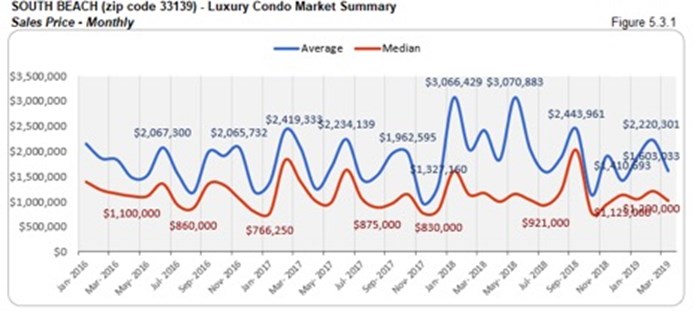
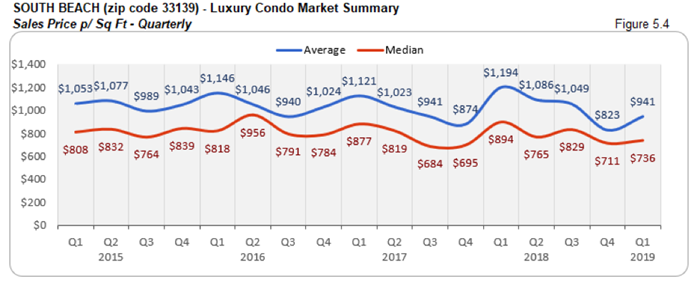
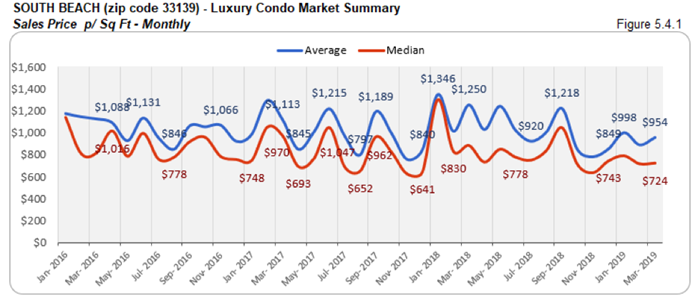
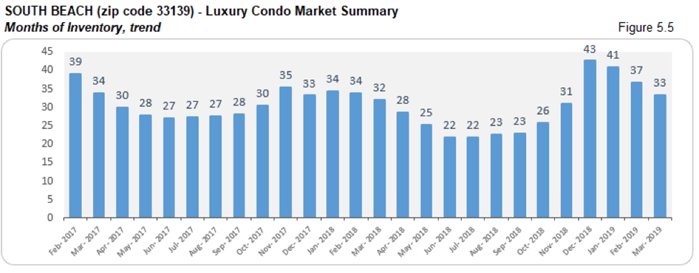
South Beach Luxury Condo Market Summary (33139 zip)
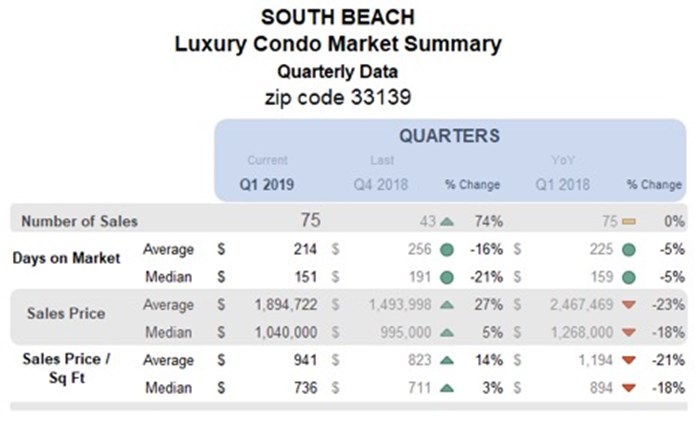
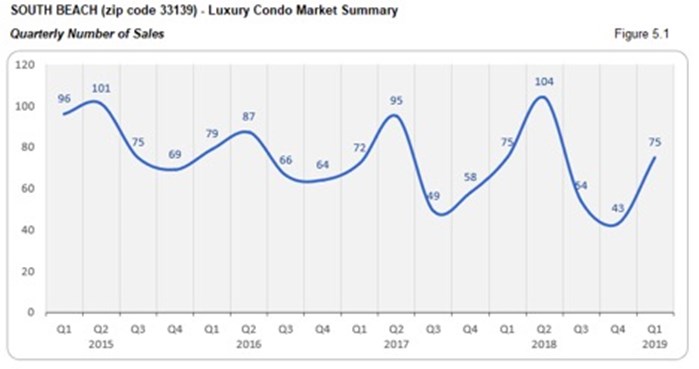
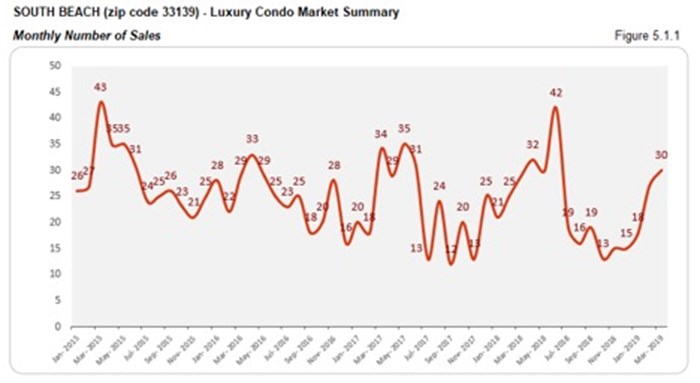
QoQ sales jump to match previous year levels with negative trend line. South Beach reports a 74% spike in quarter-over-quarter sales that also match 2018 numbers (fig. 5.1). Considering the first quarter is usually the second-best of the year and a preview to Q2 (which is the best quarter), we can safely assume a better second quarter in years is coming. The trendline, however, still carries a negative slope for the quarter (fig. 5.1.2).
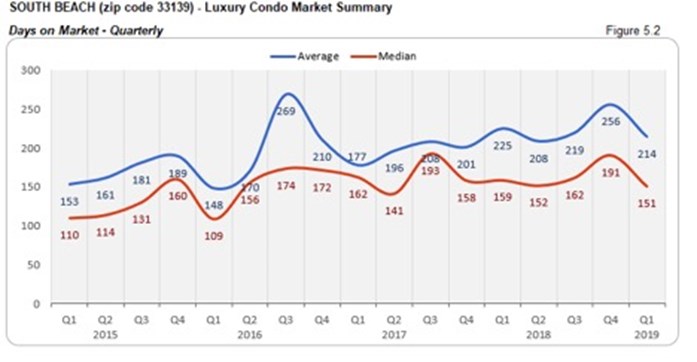
Days on market decline QoQ and YoY. Luxury condos sat for 40 less days on the market compared to Q4 2018, and 4 less days compared to same quarter last year. A positive indicator, this shows that buyers and sellers had an improved dialogue this past quarter.
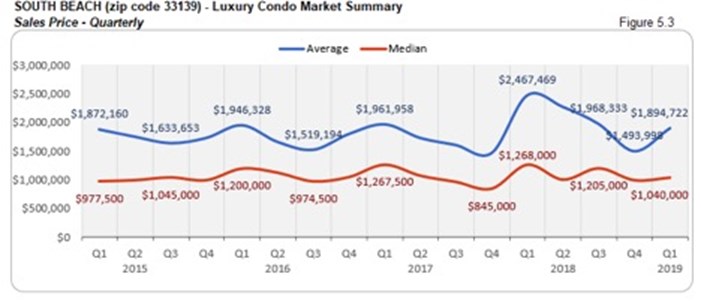
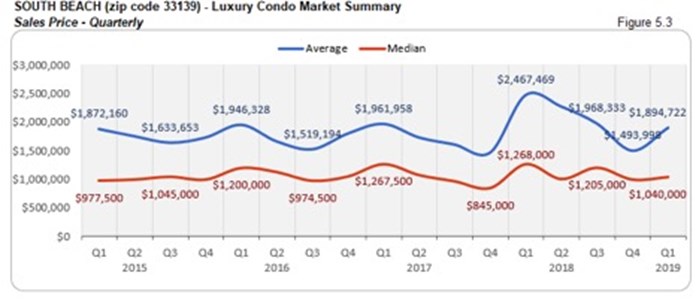
YoY prices post decline. There is an 18% drop in the median price and price per sq. ft. to report in South Beach. This shows how the buyer’s market has influenced prices, closing the quarter at a median price of $736 per sq. ft. (see fig. 5.3, 5.3.1, 5.4 and 5.4.1 below)
Inventory drops over first quarter, but still higher YoY. We see a consistent decline in the months of inventory January through March, closing the quarter with a 9% dip. However, it is still 4% higher than the same time last year, and far from its ideal benchmark of 9-12 months. This gives buyers a bigger window of opportunity to bag deals as they search South Beach condos for sale here, or take a tour of the neighborhood here.
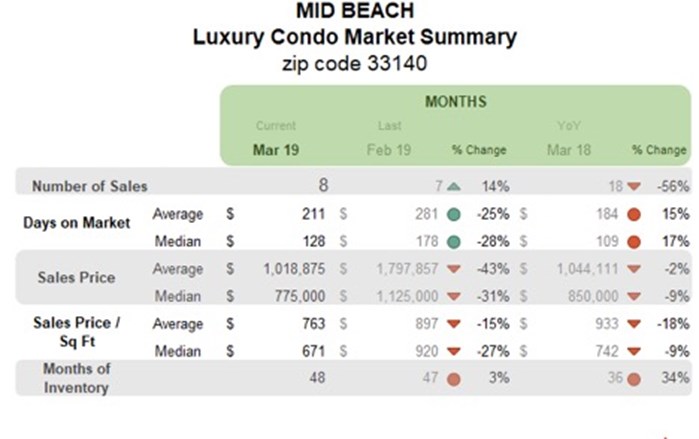
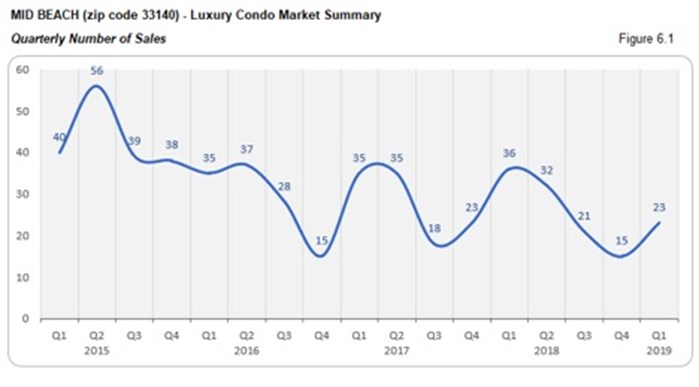
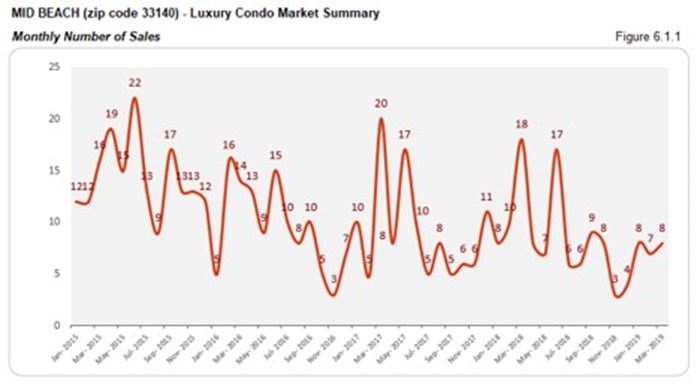
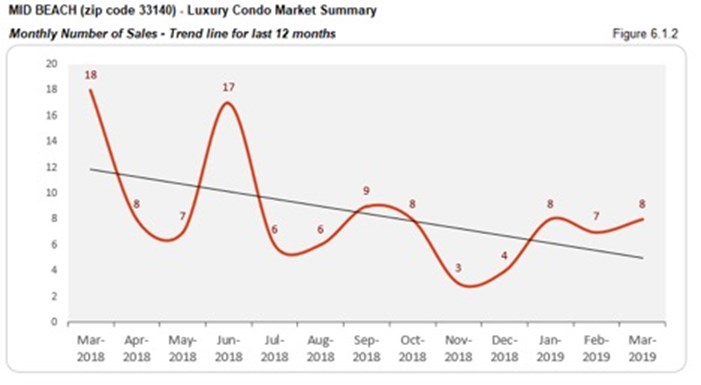
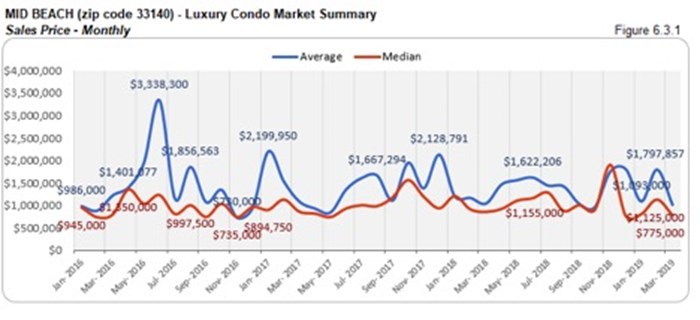
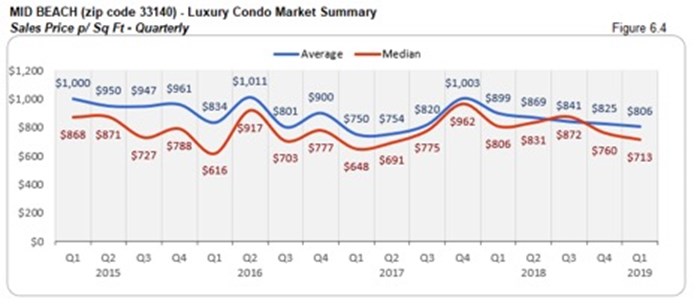
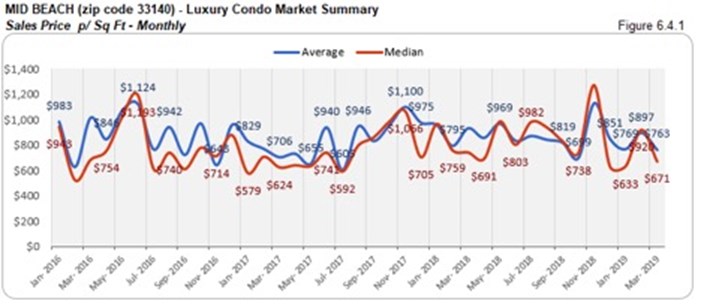
Mid-Beach Luxury Condo Market Summary (33140 zip)
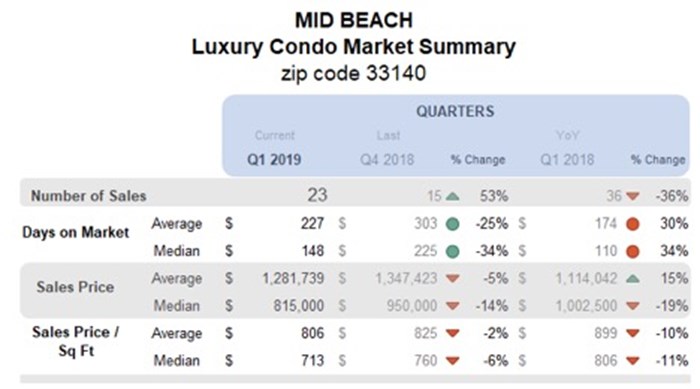
QoQ sales impress, but slack YoY with negative trend line. The first quarter comes in with some good numbers, taking sales 53% higher than Q4 2018. However, they were still 36% short of last year’s figures. This slack in sales also shows its impact in the negative sloping trend line of fig. 6.1.2.
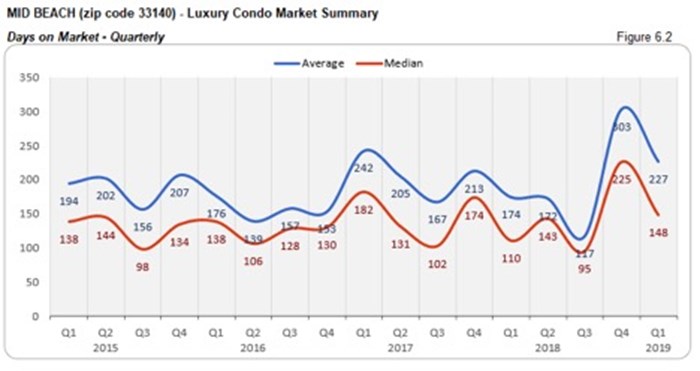
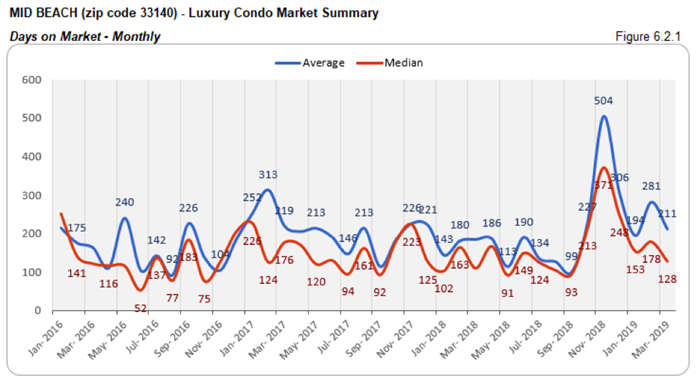
Days on market deflate QoQ, but still higher than previous year. Buyers and sellers came to a consensus sooner in Q1 compared to Q4 last year, with luxury condos spending 77 less days on the market. However, compared to same time last year, they spent 38 extra days on the market.
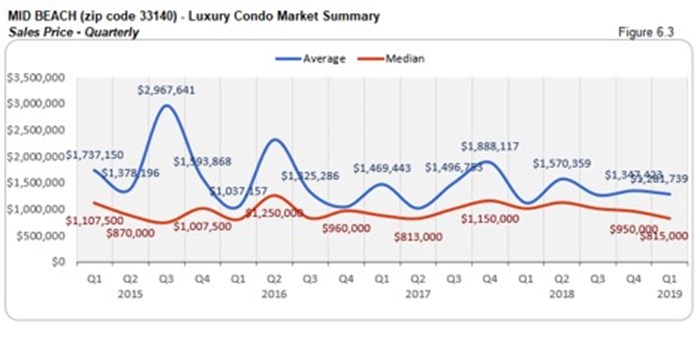
QoQ and YoY prices post reduction. In what’s great news for buyers is that the median price dropped 19% and price per sq. ft. fell 11% compared to the same time last year in this upscale neighborhood. This got luxury condos in Mid-Beach to close the quarter with a median price of $713 per sq. ft. (see fig. 6.3, 6.3.1, 6.4, and 6.4.1 below)
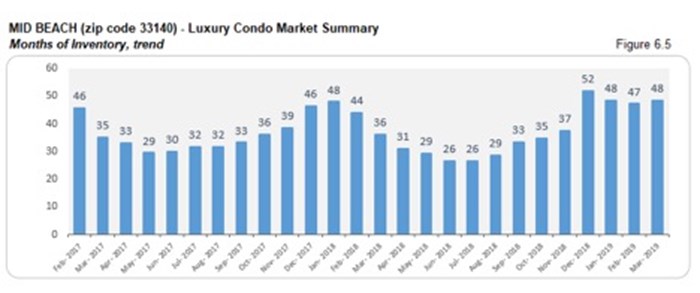
Inventory treks up. At 48 months, inventory closed the quarter 3% higher than the previous and 34% more than the same time last year. This is surprisingly one of the inventory-heavy markets in our study for Q1. mostly because of the slow sales pace, and is way off the ideal 9-12 months of a balanced market. Buyers should grab the opportunity of ample choices by searching Mid-Beach condos for sale here, or starting out with a tour here.
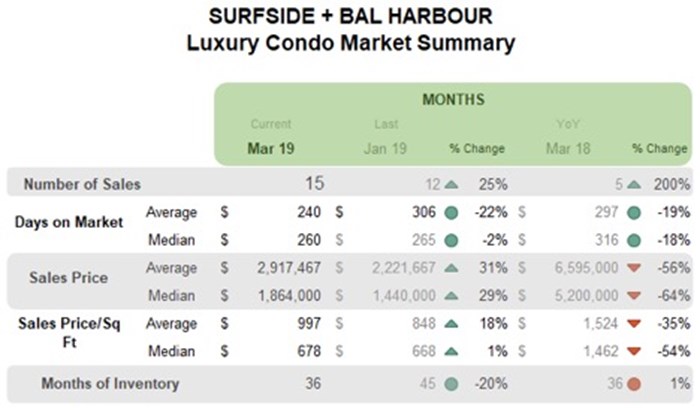
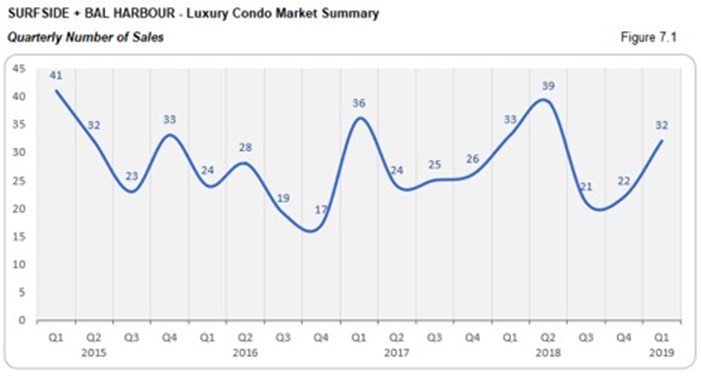
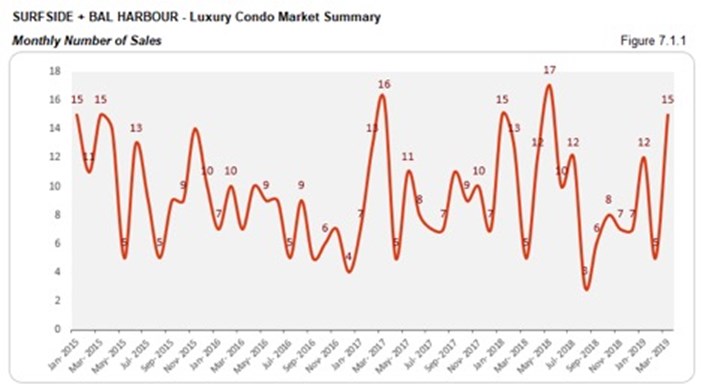
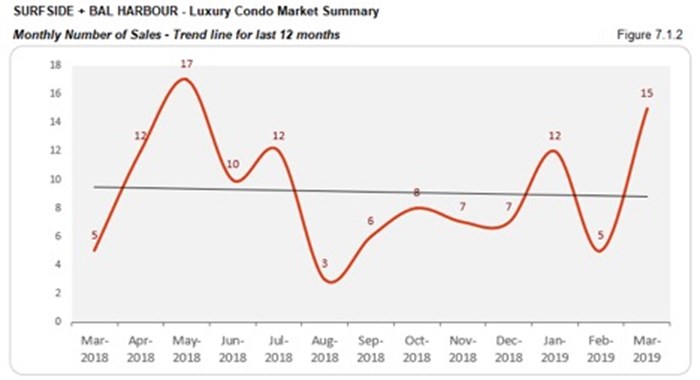
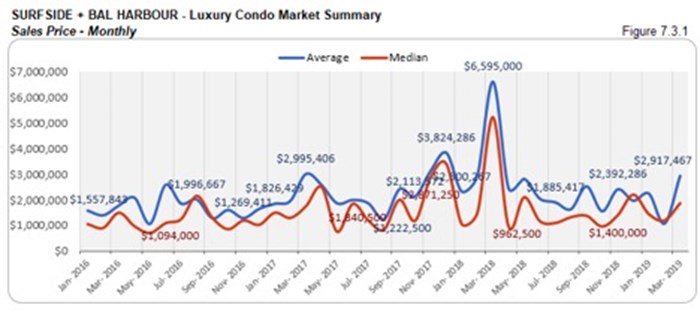
Surfside + Bal Harbour Luxury Condo Market Summary
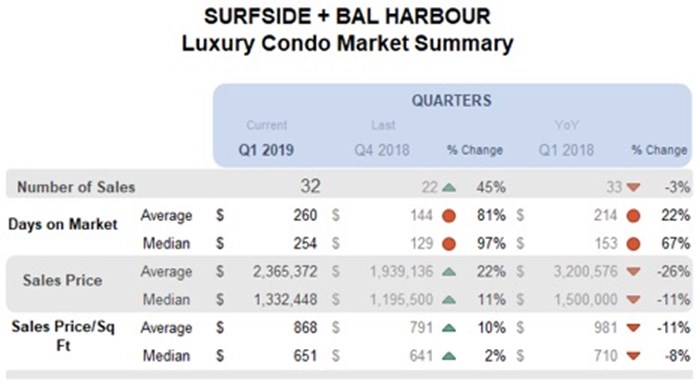
Sales inch up QoQ, and hover YoY with slightly negative trend line. This combined district reports a 45% increase in quarter-over-quarter sales, while the year-over-year numbers hover with a difference of only 1 sale. This shows that the Bal Harbour - Surfside district could look forward to a good second quarter. For now, the trend line for this grouping posts slightly negative momentum in fig. 7.1.2.
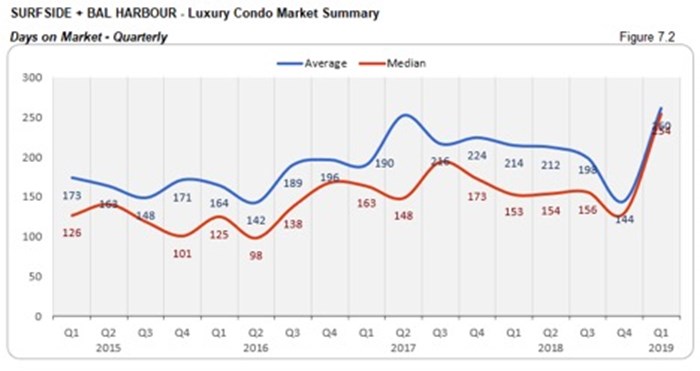
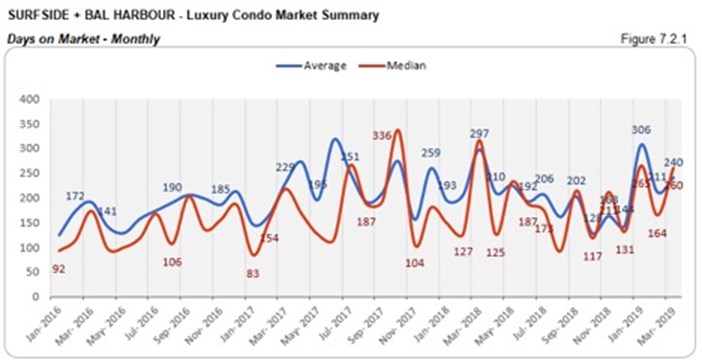
Days on market report sharp increase. This grouping reports quite a disconnect between buyers and sellers with highly inflated days on market. While luxury condos spent 125 days longer on market compared to Q4, they also took 101 days longer to get off compared to same time last year.
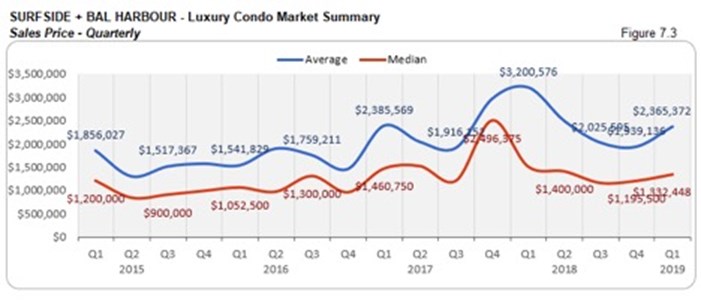
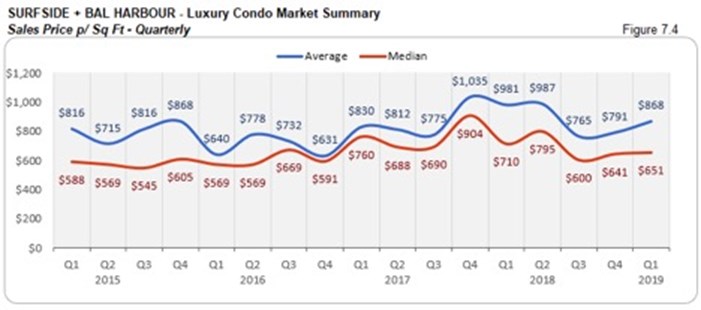
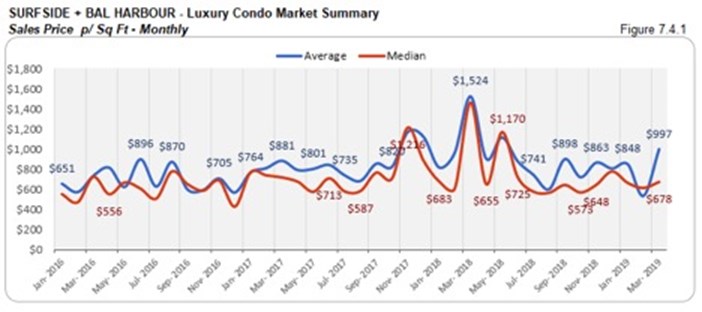
YoY prices deflate. In line with the rest of the market, this grouping also reports lower prices compared to last year. While the median price decreased 11%, the price per sq. ft. declined by 8%, closing the quarter at $651 per sq. ft. (see fig. 7.3., 7.3.1, 7.4 and 7.4.1 below)
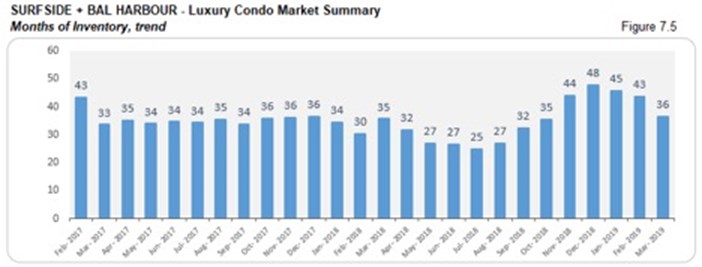
Inventory posts declines, but hovers around previous year levels. We see a consistent decline in the months of inventory through the first quarter. At 36, inventory reports a dip of 20% by quarter-end. However, it is still 1% higher than previous year levels and far from the ideal 9-12 months of a balanced market. This shows buyer can easily find deals by searching for Bal Harbour condos for sale here and Surfside condos for sale here, or see what lifestyle makes up Bal Harbour or Surfside here.
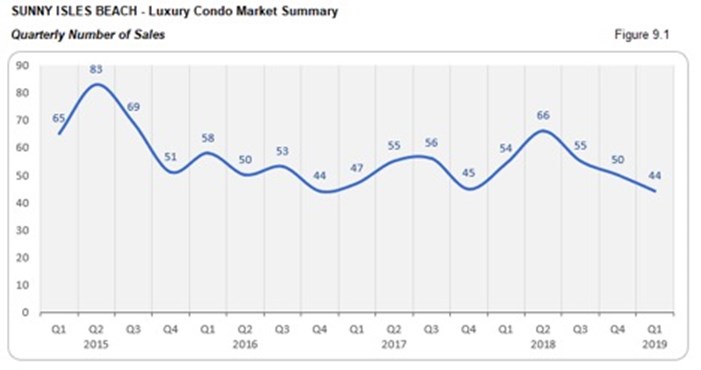
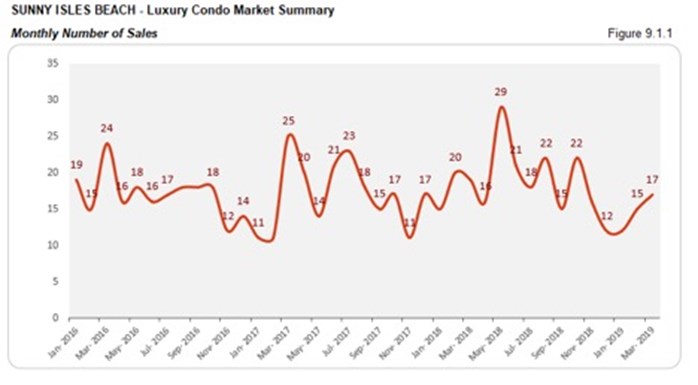
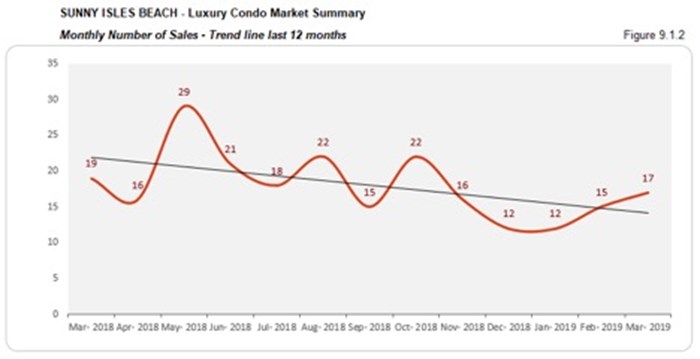
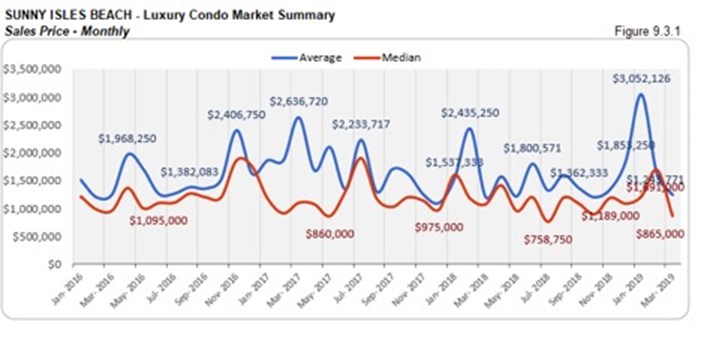
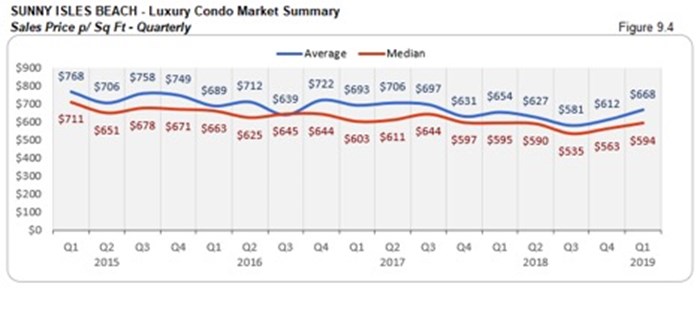
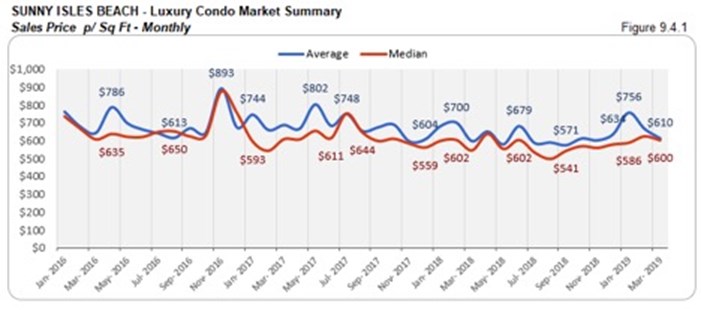
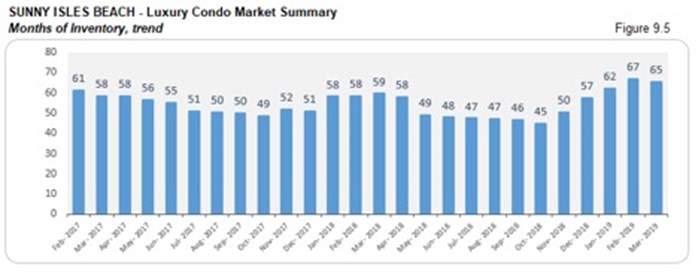
Sunny Isles Beach Luxury Condo Market Summary
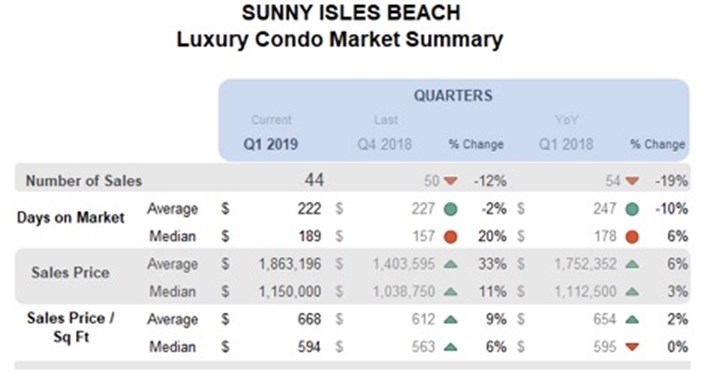
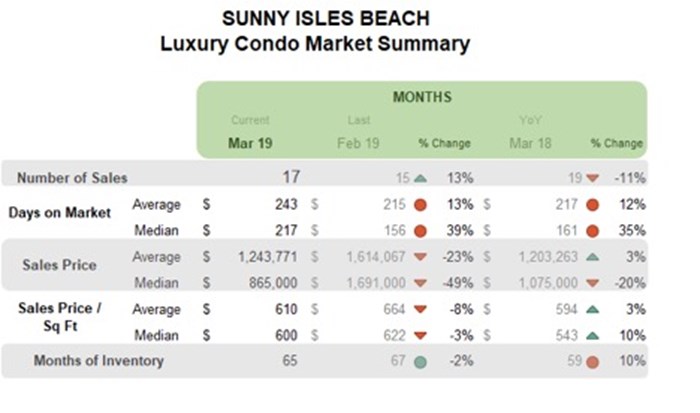
QoQ numbers, YoY sales and trend line report downtrend. We see a 12% decrease in the quarter-over-quarter and 19% decrease in the year-over-year sales of Sunny Isles Beach. The impact of this slack can easily be seen in the downward sloping trend line of fig. 9.1.2.
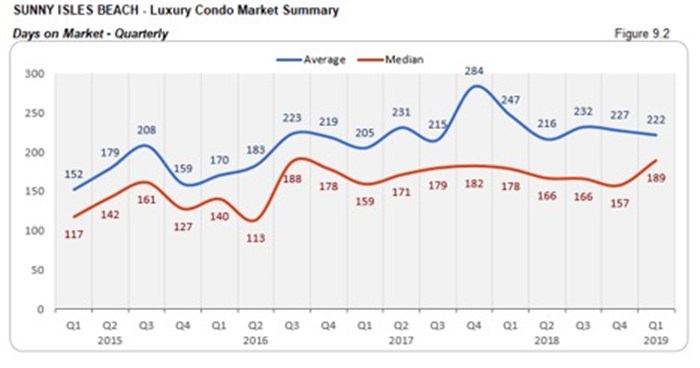
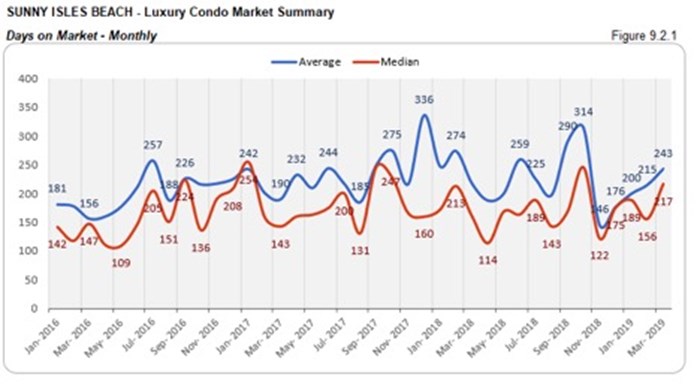
A higher days on market for Sunny Isles Beach. Luxury condos had to wait 32 days longer on the market (on median) quarter-over-quarter and 11 days longer year-over-year in this seaside neighborhood. This metric shows that buyers and sellers found it tougher to reach a consensus here.
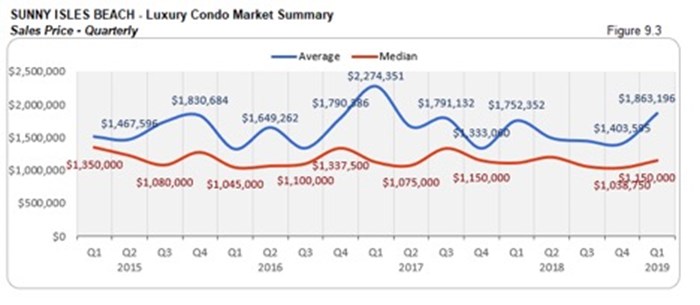
YoY prices hover with slight uptick. Again, moving against the overall market trend, we see a price increase in Sunny Isles Beach. The median sales price went up 3% year-over-year. And, the price per sq. ft. closed at $594 per sq. ft. for the quarter. (see fig. 9.3, 9.3.1, 9.4 and 9.4.1)
Inventory climbs 10% YoY. Inventory did not make much progress in Sunny Isles Beach, as it closes 10% higher than last year. At 65 months, this is one of the highest levels of inventory in our study and further from the 9-12-month mark of a balanced market. This gives buyers utmost control over negotiations as they search Sunny Isles Beach condos for sale here or begin by exploring the lifestyle options here.
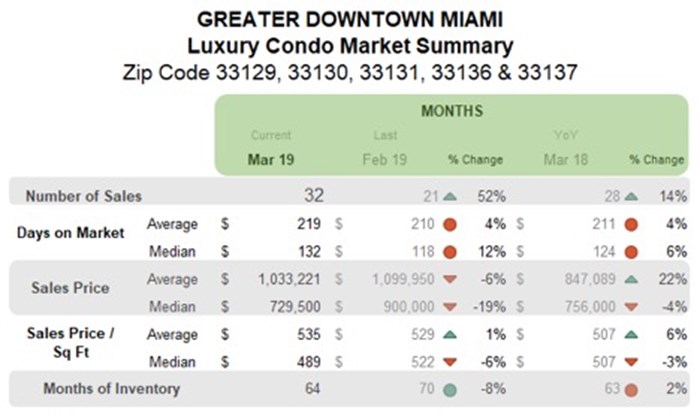
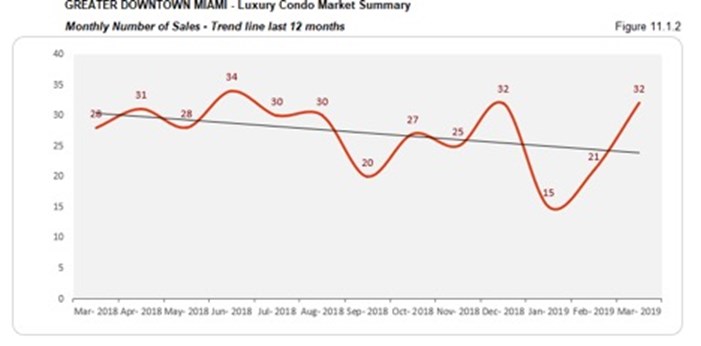
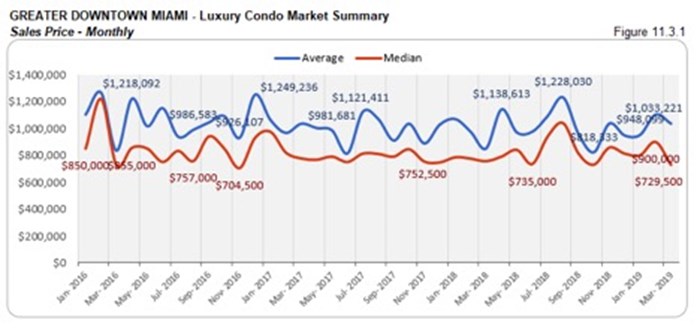
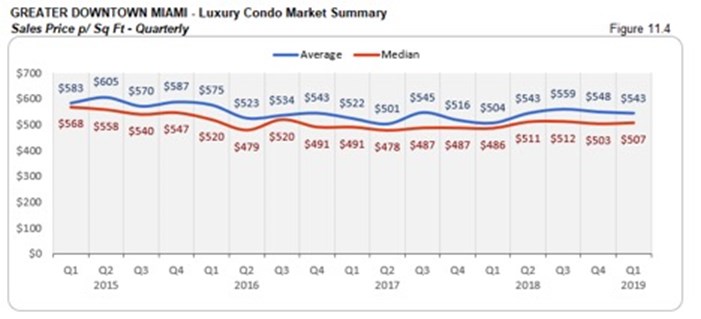
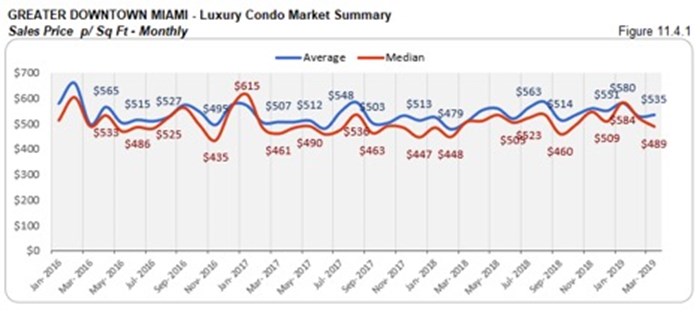
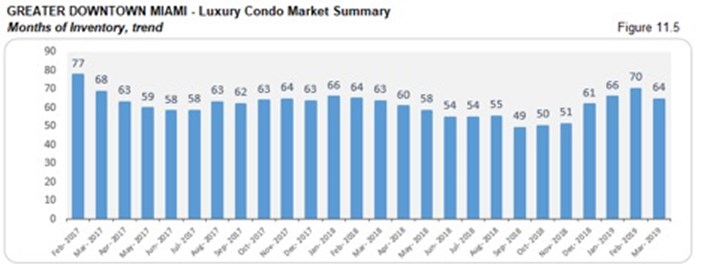
Greater Downtown Miami Luxury Condo Market Summary (33129, 33130, 33131, 33136, 33137 zips)
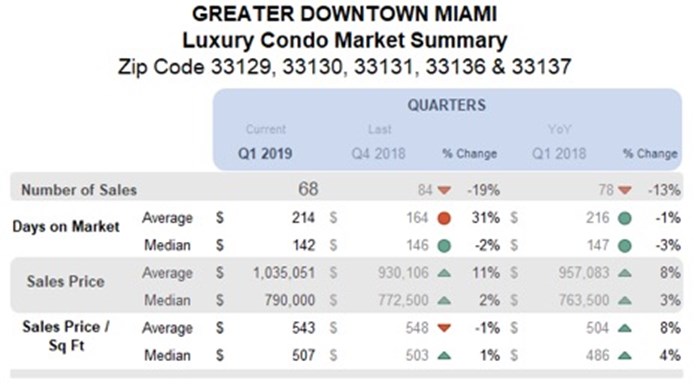
YoY and QoQ sales decline with negative trend line. Not sharing in the uptrend of the beaches, Greater Downtown Miami reports a quarterly decline in its sales numbers. While the quarter-over-quarter figures dip 19%, there is a 13% decline in the year-over-year trend. This leads to a negative trend line, visible in fig. 11.1.2.
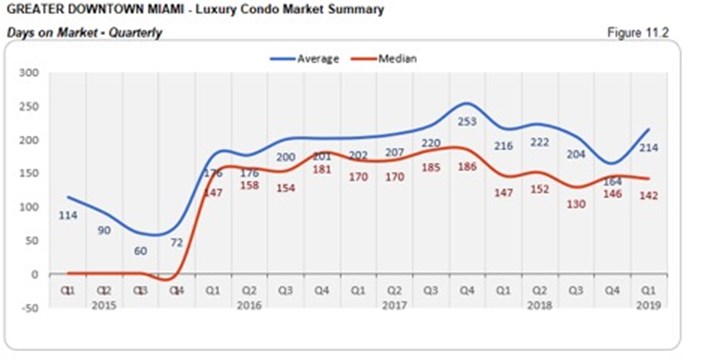
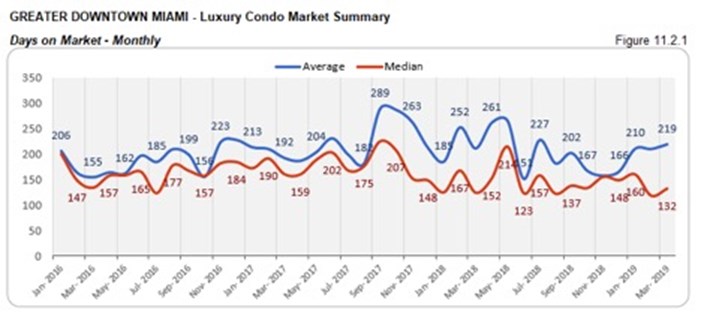
Days on market drop QoQ and YoY. A rather positive indicator, we see a drop in the days spent on market by luxury condos in this district. On a median, luxury condos spent 2% less time on market compared to Q4 2018 and 3% less time compared to Q1 2018. This indicates the presence of a better dialogue between buyers and sellers in the area.
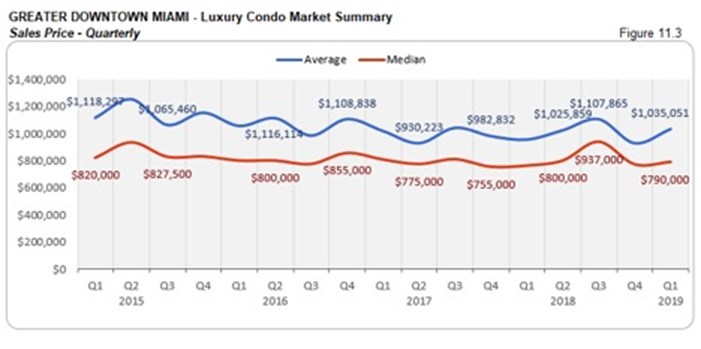
Prices rise YoY. In this first quarter, we see the prices moving slightly upwards in Greater Downtown Miami. While the median price went up 3% year-over-year, the price per sq. ft. inched up 4% compared to same quarter last year. The district closed the quarter with a median price per sq. ft. of $507. (see fig. 11.3, 11.3.1, 11.4, and 11.4.1 below)
Inventory inches up YoY. With one of the highest levels of inventory in our study, this district posts a 2% increase in its year-over-year figures. At 64 months, inventory is still way off the 9-12-month benchmark of a balanced market. Buyers have ample choices at hand and can easily drive negotiations as they search the Greater Downtown Miami area here for deals.
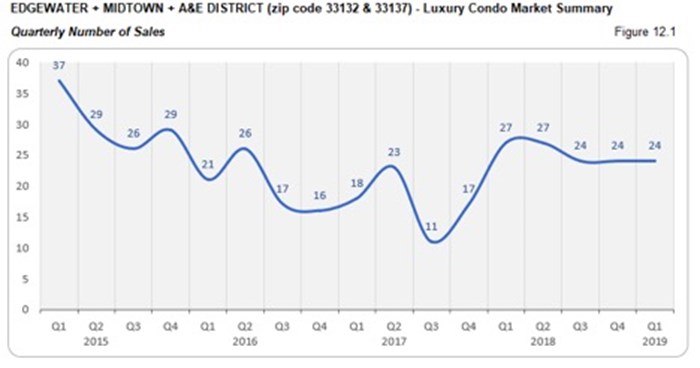
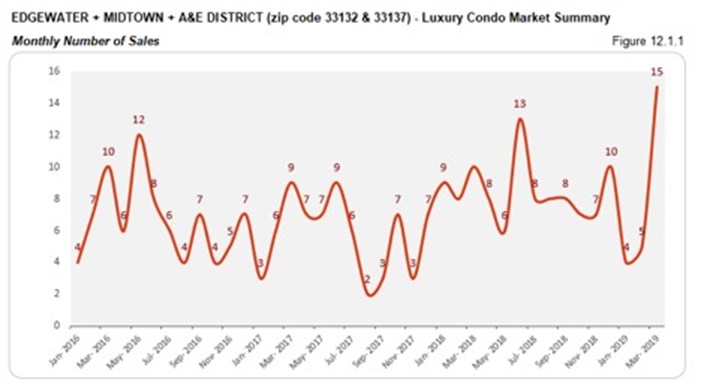
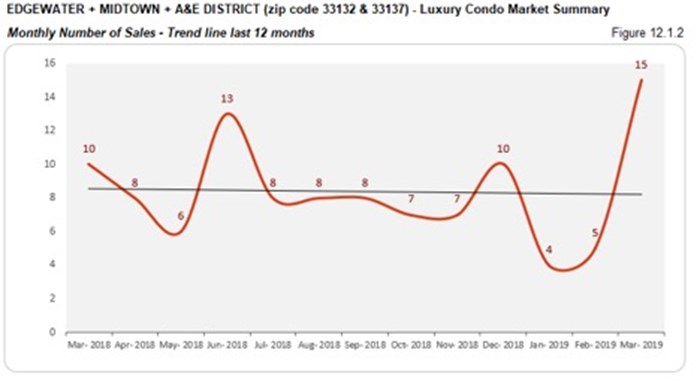
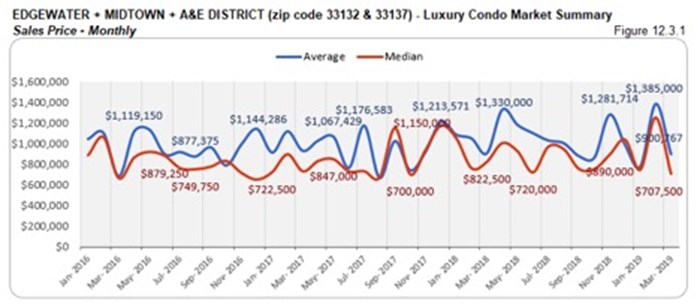
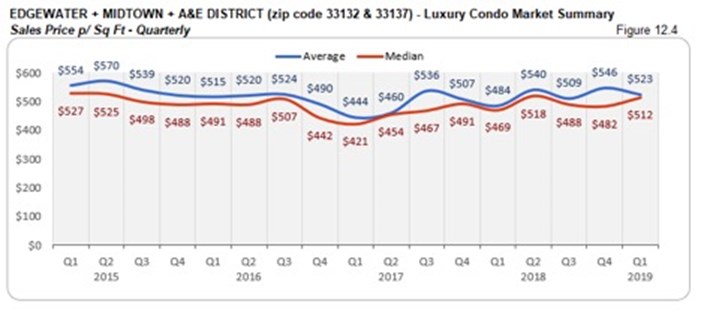
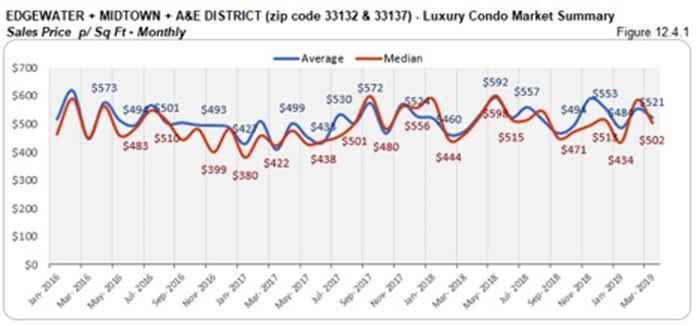
Edgewater + Midtown + A&E District Luxury Condo Market Summary (33132 + 33137 zip)
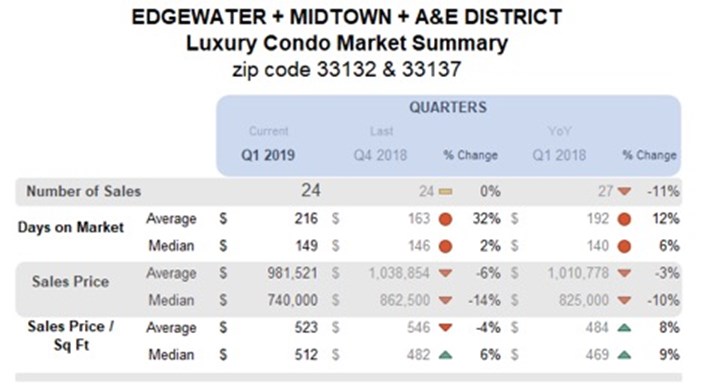
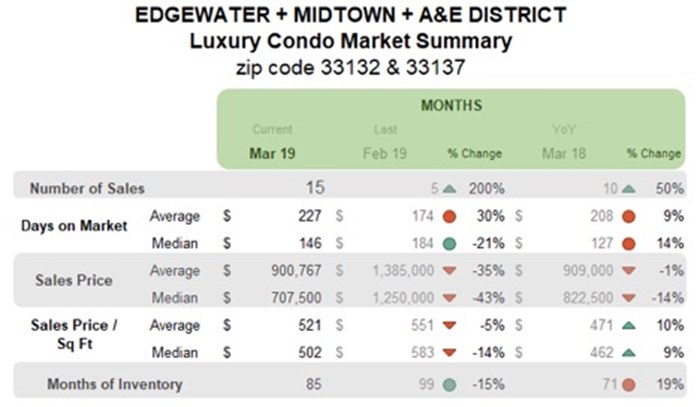
QoQ sales sustain, but decline YoY with balanced trend line. This grouping of neighborhoods holds on to its sales numbers from the previous quarter. However, it posts an 11% decline on its year-over-year analysis. In spite of this, we find a balanced trend line in fig. 12.1.2, indicating a healthy market momentum, mostly due to a very strong March.
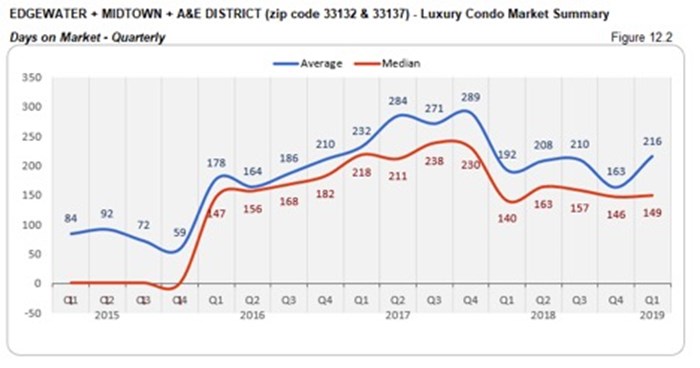
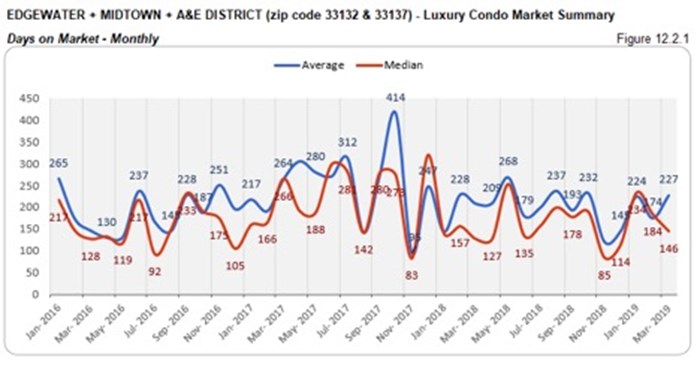
Slight increase in the QoQ and YoY days on market. Luxury condos in Q1 took a marginal 3 days longer (on median) to get off the market compared to Q4, and 9 days longer compared to same time last year. This shows that buyers and sellers didn’t change much on their market positions over the course of the year.
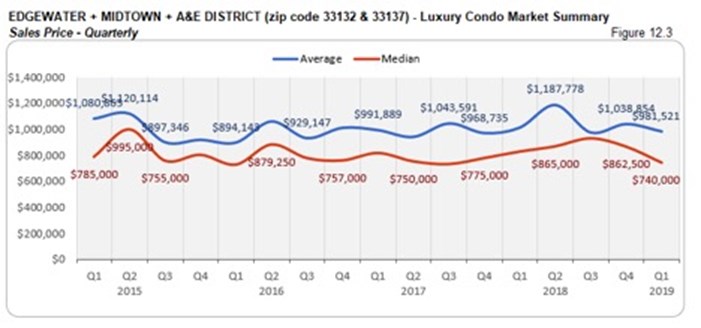
Slight volatility in prices. While the year-over-year median price declined 10%, the price per sq. ft. curiously went up 9%. By quarter-end, the median price per sq. ft. for this grouping closed at $512. (see fig. 12.3, 12.3.1, 12.4 and 12.4.1)
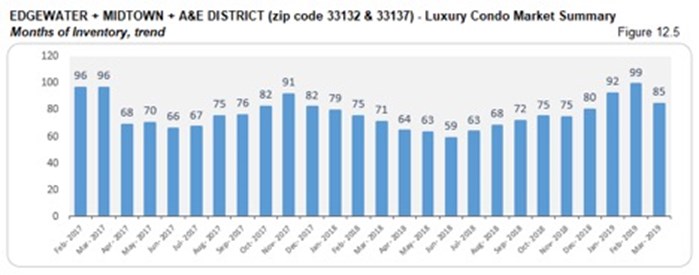
Inventory rose 19% since the same quarter last year. Even as the months of inventory declined by quarter-end, it was still higher than Q1 2018. As levels are still one of the furthest from reaching the 9-12-month ideal of a balanced market, buyers have an upper hand in negotiations and should browse through Edgewater condos for sale here or begin by exploring the individual lifestyle plus condo options in Edgewater, Midtown and Arts & Entertainment District.
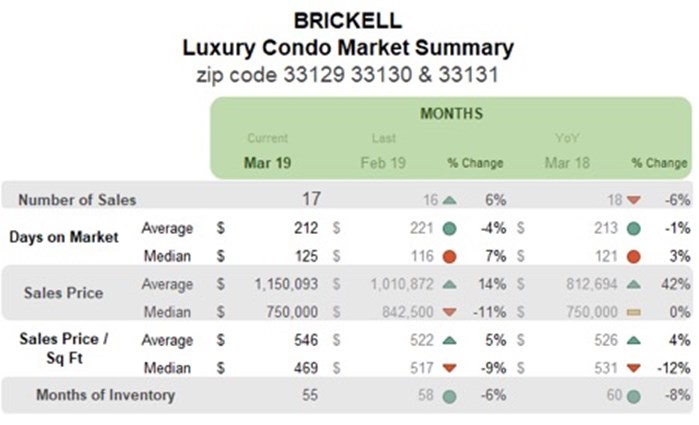
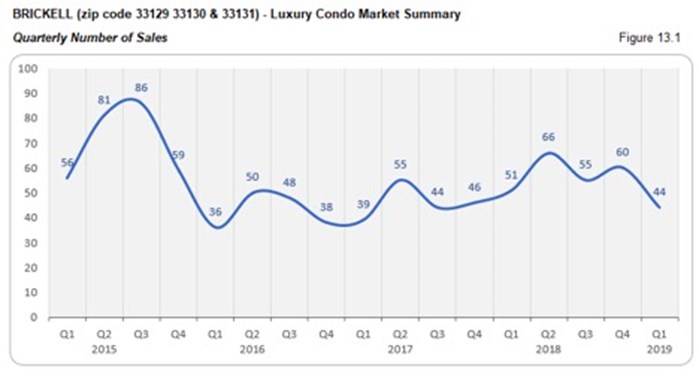
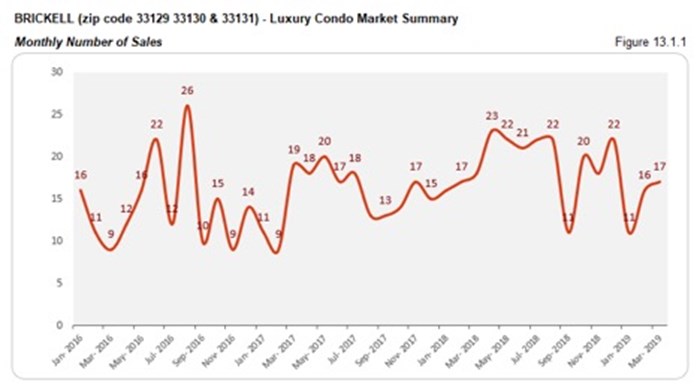
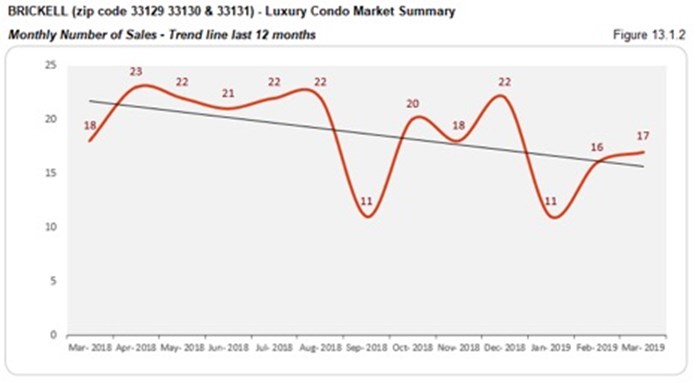
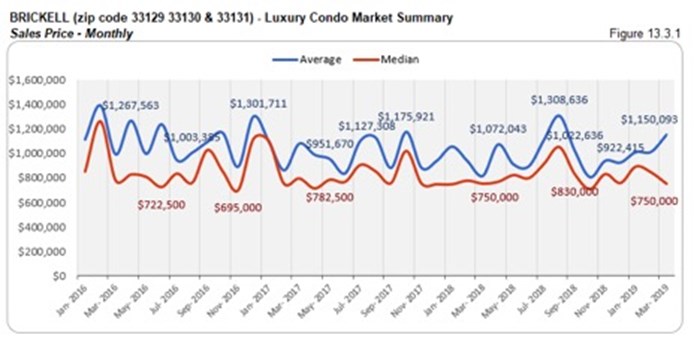
Brickell Luxury Condo Market Summary (33129, 33130, 33131 zip)
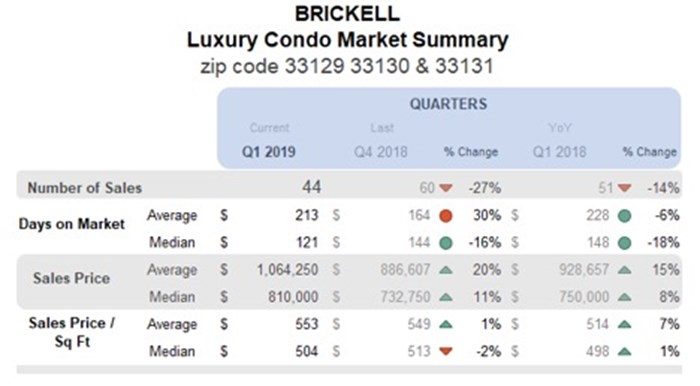
QoQ and YoY sales dive with negative trend line. The first quarter turned out to be slower for this financial district. While the quarter-over-quarter sales dipped 27%, the year-over-year numbers too went down 14%. This slack in momentum is also visible in the negatively sloping trend line of fig. 13.1.2.
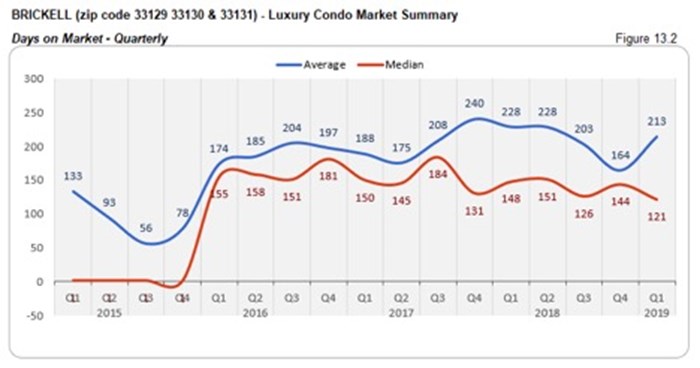
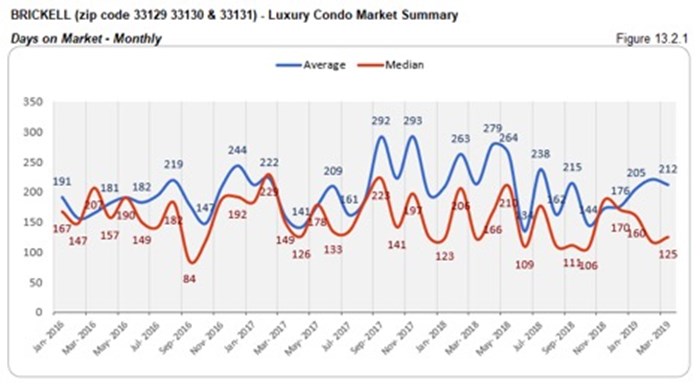
Days on market deflate QoQ and YoY. Indicating a positive trend, we see that luxury condos spent 23 less days on market compared to Q4 2018, and 27 days less compared to the same quarter last year. This shows that buyers and sellers found it easier to come to an understanding through this first quarter.
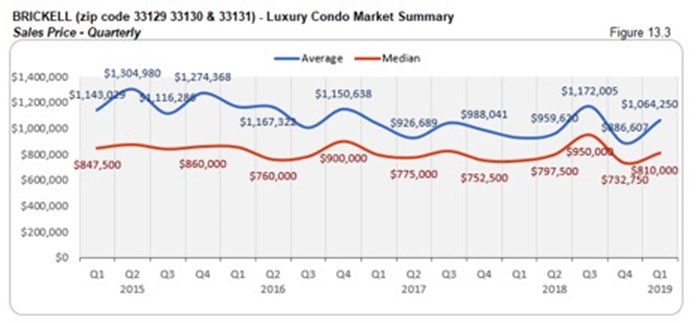
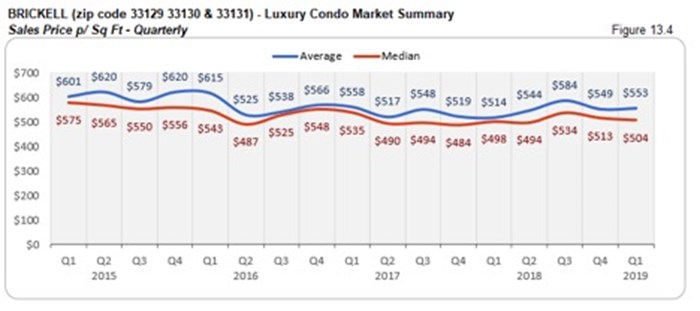
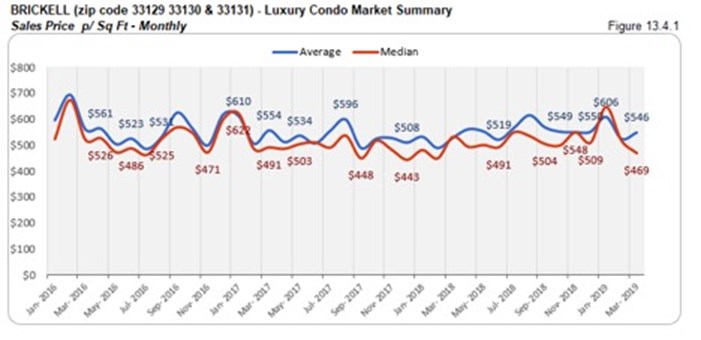
YoY prices move upwards. Going against the overall trend, we see the median prices nudging upwards in this financial district. While the sales price went up 8% year-over-year, the price per sq. ft. too increased by 1%. The quarter closed with a $504 per sq. ft. median price for Brickell’s luxury condos. (see fig. 13.3, 13.3.1, 13.4 and 13.4.1 below)
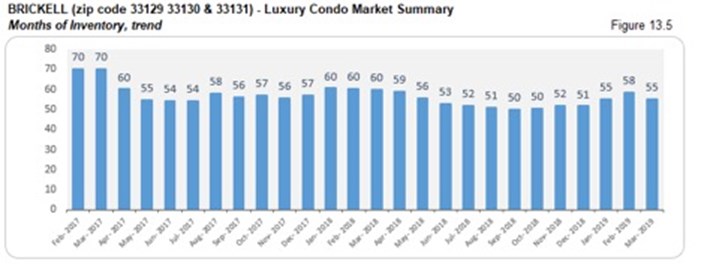
Inventory down 8% YoY. In spite of slower sales, we see that the first quarter closed with 8% less inventory compared to Q1 2018. At 55 months, inventory is still quite heavy, with levels far from their ideal mark of 9-12 months. Buyers can still seize the opportunity to find good deals by searching Brickell condos for sale here or taking a tour through Brickell here.
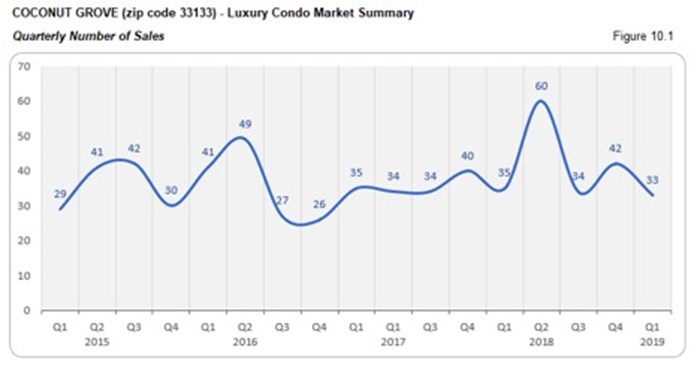
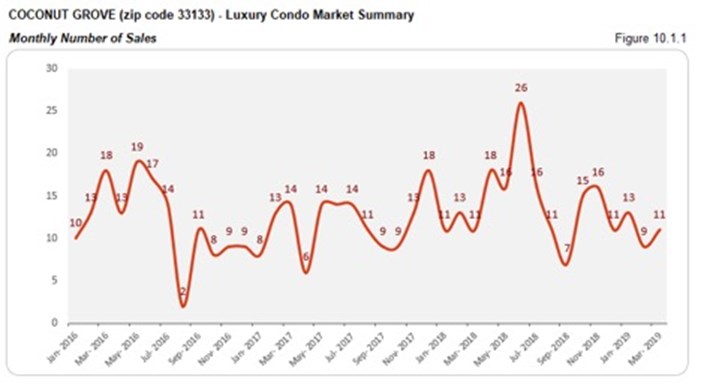
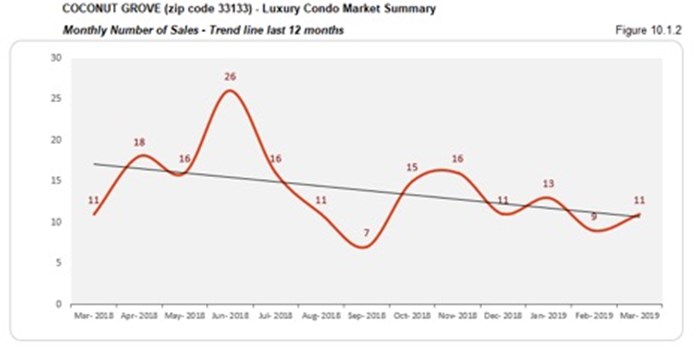
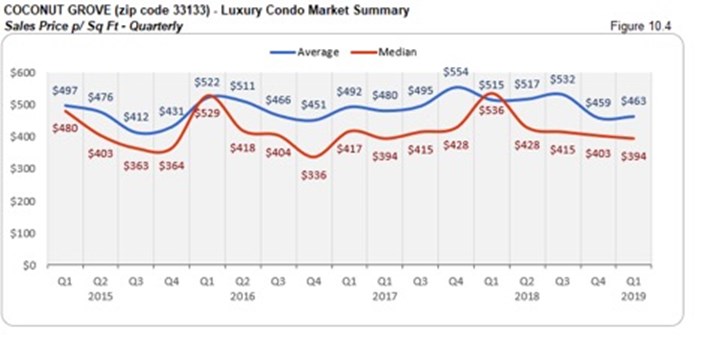
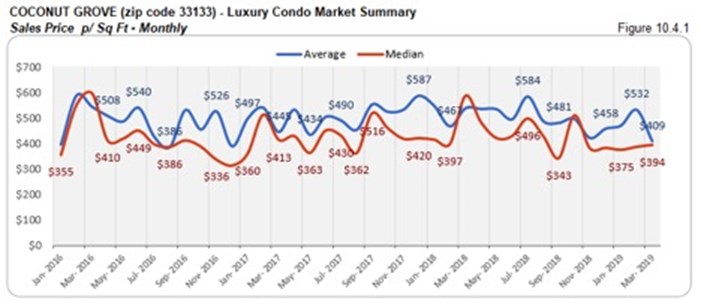
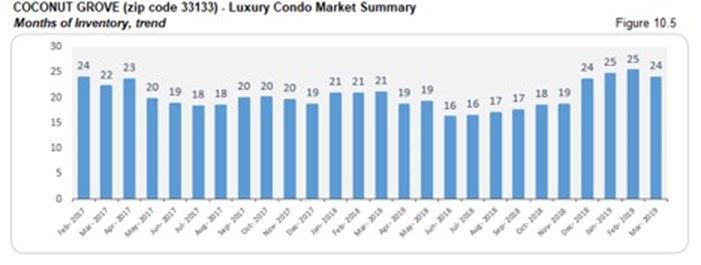
Coconut Grove Luxury Condo Market Summary (33133 zip)
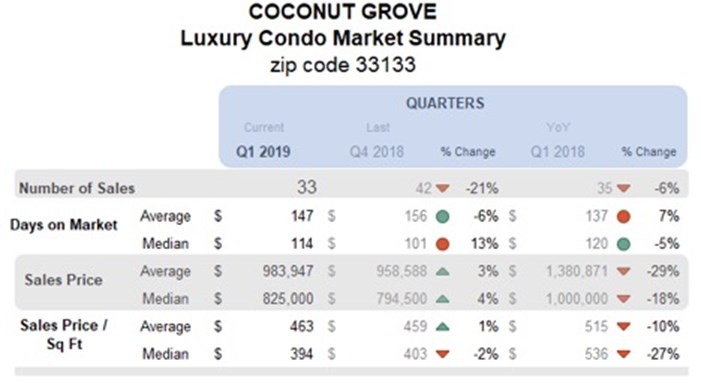
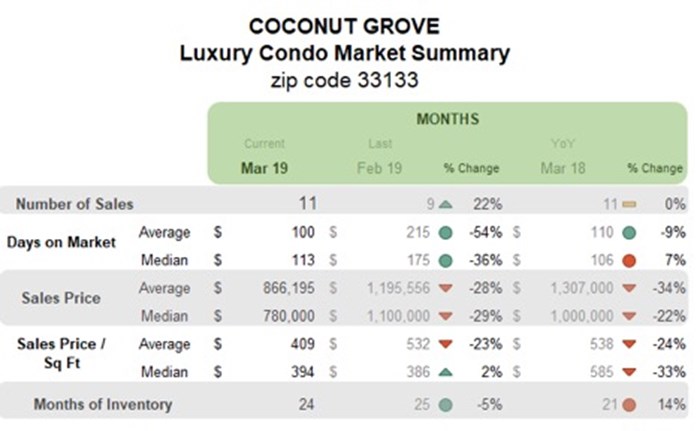
QoQ and YoY sales, plus trend line come back negative. There is a 21% dip in sales to report against Q4 2018 and 6% decline against the same quarter last year. This slip becomes even more evident as the trend line in fig. 10.1.2 remains negative.
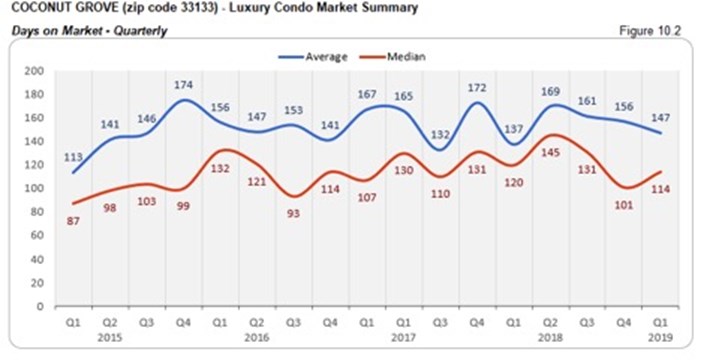
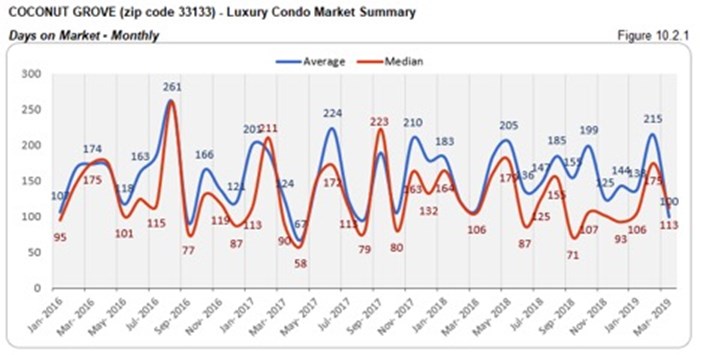
Days on market deflate YoY. On a rather positive note, the days on market came down 5% compared to the same quarter last year, as luxury condos took 6 less days to sell. This shows that buyers and sellers started reaching a consensus sooner in this vibrant neighborhood of Coconut Grove over the course of the year.
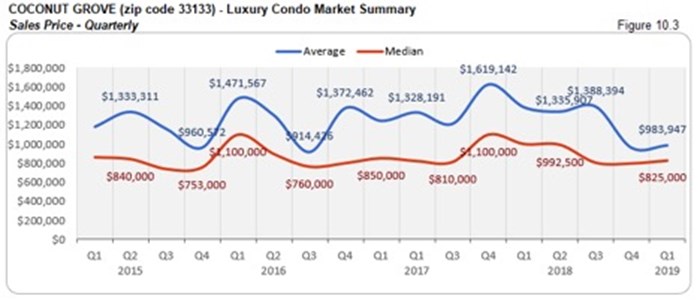
Prices dropped YoY. We see an 18% reduction in the median price and 27% decline in the price per sq. ft. compared to same quarter last year in Coconut Grove. This got the first quarter to close at a median price of $394 per sq. ft. (see fig. 10.3, 10.3.1, 10.4 and 10.4.1 below)
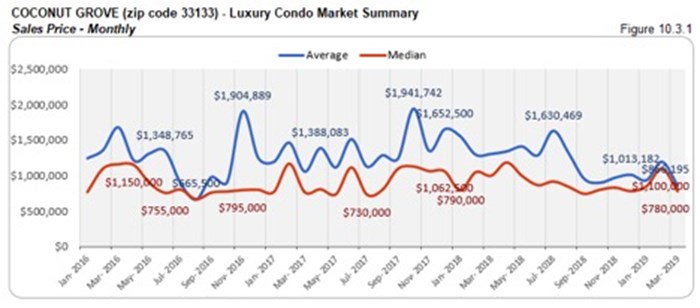
YoY inventory posts uptick. Even as inventory dropped over the first quarter, there is a 14% increase to report over the same quarter last year. At 24 months, it is quite off the 9-12 months mark of an ideal market. Buyers still have the opportunity to drive deals as they search Coconut Grove condos for sale here, or check out what lifestyle makes this vibrant neighborhood here.
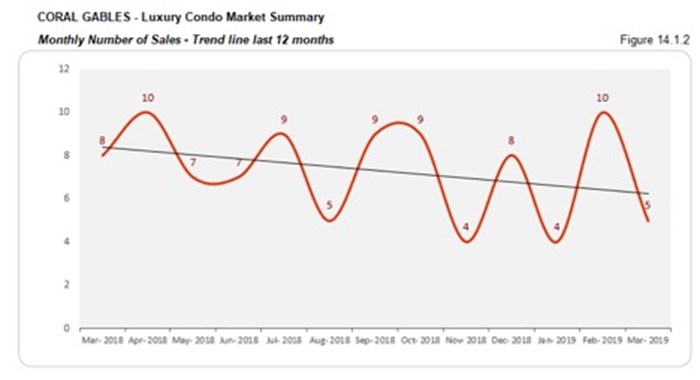
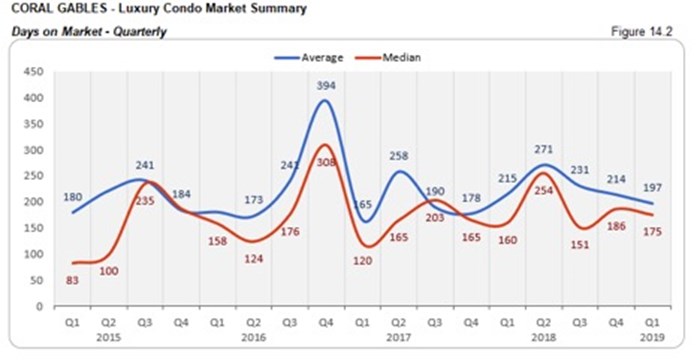
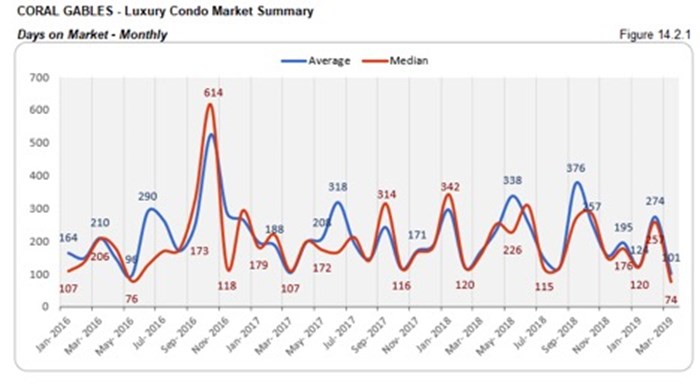
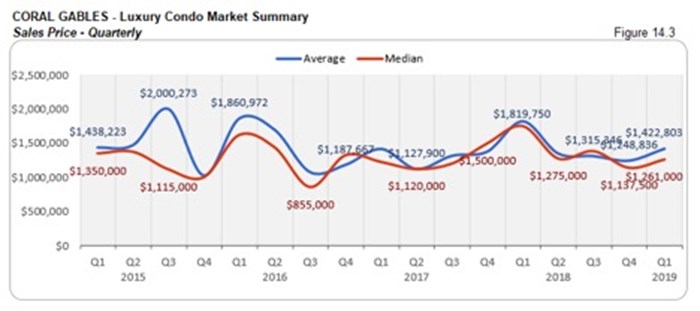
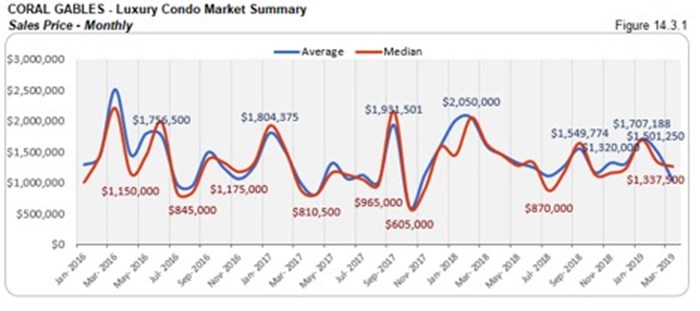
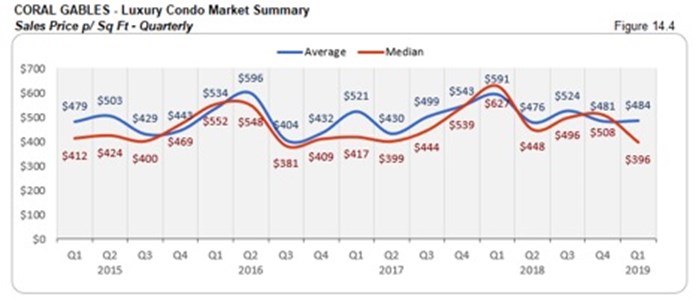
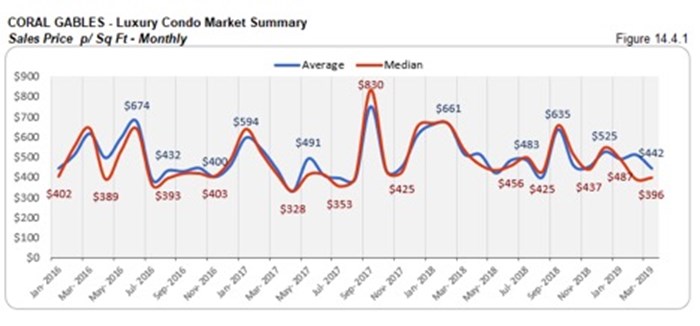
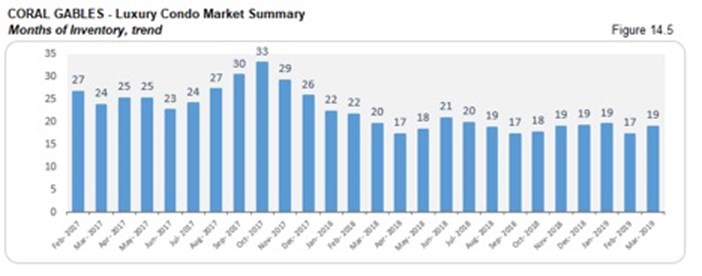
Coral Gables Luxury Condo Market Summary
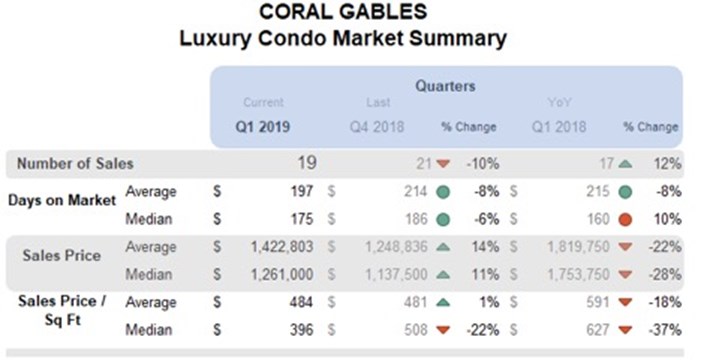
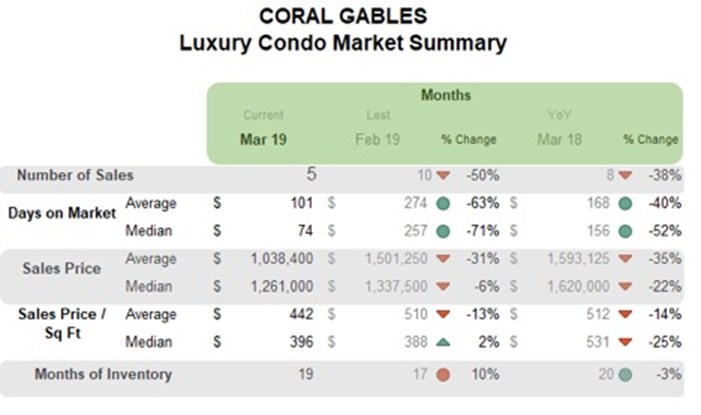
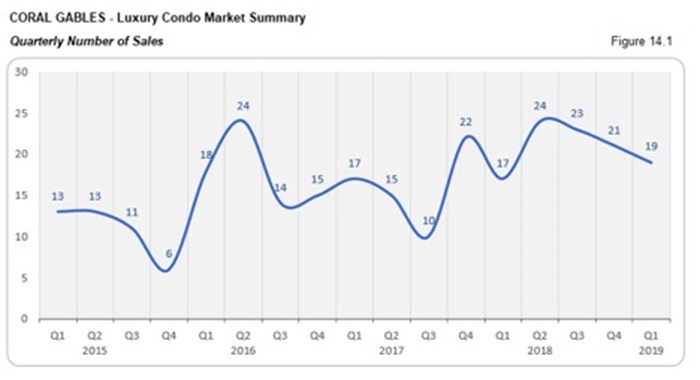
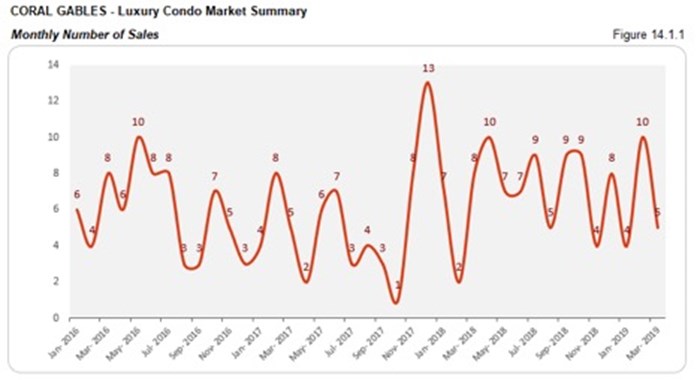
QoQ sales lackluster along with negative trend line, but YoY numbers impress. In line with the majority of the neighborhoods in our study, Coral Gables reports a 12% increase in its year-over-year sales, even though Q1’s sales slipped 10% against Q4 2018. A negative trend line in fig. 14.1.2 shows that there is still some steam required for the momentum to be regained.
Days on market improve QoQ, but increase 10% YoY. Luxury condos took 11 days less to get off the market compared to Q4, but still took 15 days longer year-over-year. This shows that buyers and sellers could not easily come to a consensus in City Beautiful.
Drop in YoY prices. There is a significant drop in the year-over-year median prices in Coral Gables. Q1’s sales price fell 28%, while the price per sq. ft. dropped 37%. The first quarter closed with a median price per sq. ft. of $396. (see fig. 14.3, 14.3.1, 14.4 and 14.4.1 below)
YoY inventory decreases by 3%. Even as the months of inventory fluctuated over the course of the first quarter, they managed to close with a decline against Q1 2018. At 19 months, inventory is not too far from reaching its ideal benchmark of 9-12 months. Buyers still have a good scope to squeeze out deals as they search Coral Gables condos for sale here, or start by checking out the lifestyle options in Coral Gables here.
Conclusion
Sales expected to pick up in Q2 supported by drop in prices, buyers should act now. Q1 is usually the second-best quarter of any given year and is also a preview of what to expect in Q2 (which is generally the best quarter for the luxury condo market in Miami). Keeping this in mind, we can safely expect the sales picture to improve drastically in Q2. This, supported by a drop in prices, is and will continue to attract more buyer attention.
Now even though 2019 begins as a buyer’s market (as predicted), it will be interesting to note whether the second quarter turns into the kind of game changer the market needs to bounce back into balance.
Love what you see? Don’t forget to share our blog and subscribe (see the subscribe link on the top menu) to receive the latest market news in your inbox.
Have any questions? Or see something wrong with the stats? Please contact Sep at sniakan (at) hbroswell.com or call 305-725-0566.
Share your thoughts with us

Your Miami Condo Awaits
Recent Posts


 (305) 697-7667
 (786) 321-7233
  contact@condoblackbook.com

