Luxury Miami Condo Report : April 2017
May 18, 2017 May 18, 2017
Miami Luxury Condo Report Overall Market Summary
Miami Luxury Condo Market Report: Summary back to top
Whether you’re planning to buy, sell or invest in any market, it always pays to be equipped with knowledge. Read in-depth or browse through our monthly luxury condo market report to know exactly how different neighborhoods in Miami are faring for informed decision-making.
For the purpose of this luxury condo market report, we’ve only considered condos priced over $600,000. We’ve also excluded any quarterly charts (a regular feature) for now, since the quarter just started.
Overall Market Highlights:
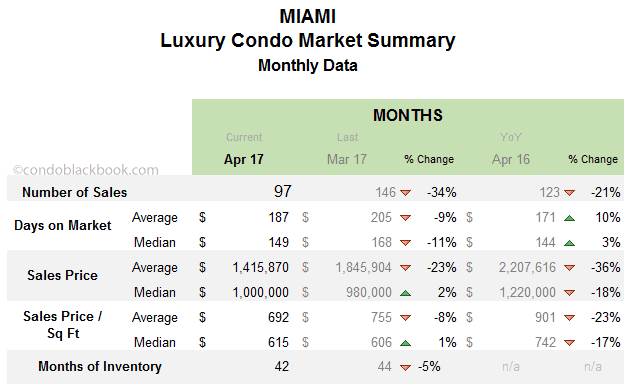
- Overall monthly sales post dip from very strong March, hope of strong recovery set aside for now
- ‘Days on market’ pushed down by positive trends of market and more realistic sellers
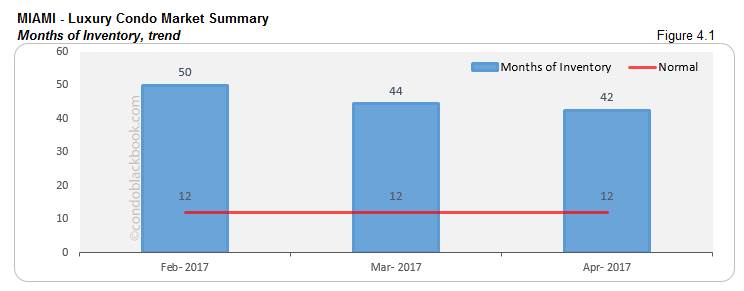
- Inventory still high at 42 months
- Overall average sales prices dive 23%, but median registers 2% increase
- Buyers’ market continues, sellers should keep a close eye on the market since trends are shifting slowly
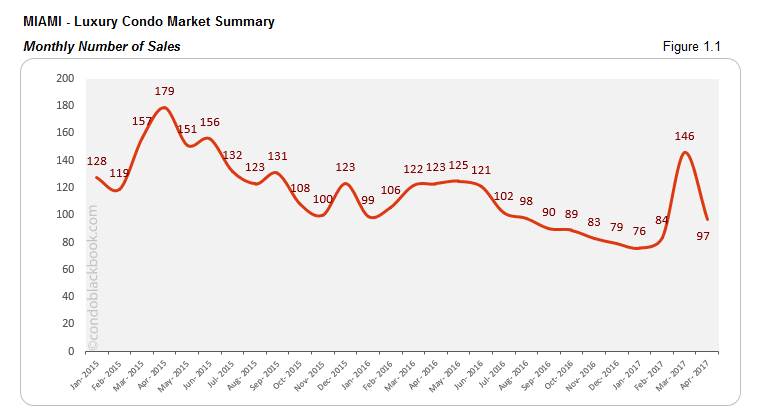
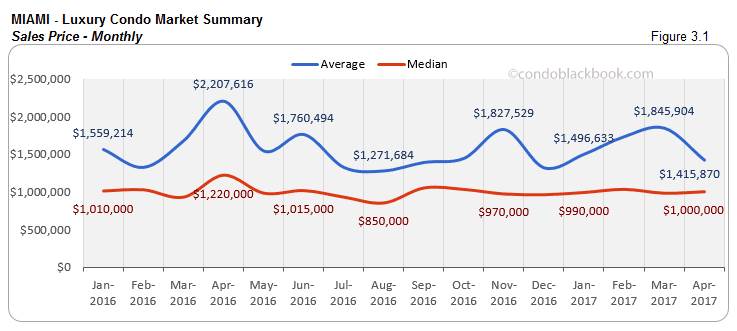
Sales volume took a big dip, but better than recent months. After a positive first quarter and exceptional progress in March, it would feel as though April has lagged, but that’s far from the truth. Even though April does post a 34% fall in sales compared to March (market summary chart), looking at the 6 months before March brings out the real picture (fig. 1.1). The month of March registered an unusual spike in sales, so even though the market does recede a bit, we can’t rule out that the luxury condo market has still made progress. That said, we were hoping for a strong April to start a trend of a market roaring back. Didn’t happen.
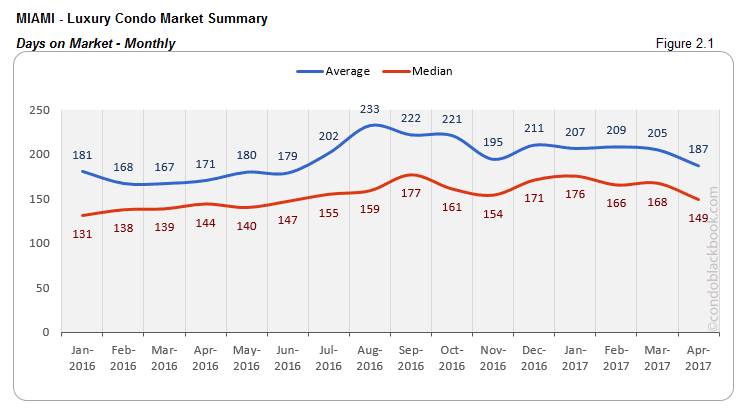
Lower Days on Market proves progress was made. Looking at the ‘Days on Market’ below (fig. 2.1) further drives the point home that the market (though it did ebb a bit) is moving forward. March’s exceptional sales pushed back the days on market by getting off a chunk of luxury condos from the market. The effect is now visible in April’s report (fig. 2.1), with April itself posting decent sales to keep that momentum going. The lower days on market trend probably also signals that sellers are becoming more realistic and ready to make a deal, where they once may not have been.
Inventory lowers, but still historically high. Over the past couple of months the inventory trend (fig. 4.1) has been showing a steady decrease. However, considering that the current 42 months is still way higher than the 9-12 months normal of a balanced market, we have a long way to go before getting out of this buyers’ market.
Overall, I’d say March posted some great spikes and gave the luxury condo market a good thrust forward. April, though it may look a bit soft when compared to March, is faring well when compared to the months before. Further, while we are still very much in a buyers’ market, we should keep a close eye on these little shifts to see where the market will land in the coming months.
How Did We Land Into Pent Up Inventory And A Buyer-Driven Market, and Where Do We Go From Here? back to top
We’ve already discussed in-depth how a strengthening U.S. dollar, strong stock market, Zika and the presidential elections affected sales and led to pent up inventory in last month’s report. However, with the market receding a bit this April after March’s extraordinary show, we feel the following factors might be at play as well:
Shaky start to this presidency. We all know about the drama and chaos that’s been at center stage of the Trump presidency. This has taken away from the sense of stability that people have. There’s a high level of uncertainty in the minds of the people, which is getting them to tread cautiously in every sphere of business.
Wealthy are hopeful and waiting for tax breaks. It seems the wealthy are optimistic but cautious, as they wait for this Republican administration will have some great news in the form of favorable tax laws. One the rich feel richer, they are likely to get back into the luxury real estate game with more confidence.
Look below for an insight into Miami’s overall and neighborhood-level luxury condo trends and numbers for April 2017:
Monthly Number of Sales - Miami Luxury Condo Market Overall back to top
- April sales fall back, but optimism rules. After a fantastic month of March, we see the overall sales taking a big dip this April. There is a 34% decline when compared to March’s extraordinary numbers. However, if we were to look at the performance of the last 8 months in fig. 1.1, the situation doesn’t seem bad at all. In fact, it gets apparent that the luxury condo market is still holding its ground and making real progress.
- Too early for predictions of a recovery. It’s a bit early to say whether March’s high numbers or April’s mellow trend will continue in the coming months. For now, it’s a wait and watch situation for Miami’s luxury condo market.
Days on Market - Miami Luxury Condo Market Overall back to top
“Days on market” are the total number of days from when a property is active to the day it closes.
- Days on Market drop, but hold on before you rejoice. The average and median days on market have dropped 9 and 11 percent respectively (refer to market summary chart) in April, showing that there is some improvement. This is a positive sign for the market, and it likely means that sellers are being more flexible in their prices.
Sales Price Trends - Miami Luxury Condo Market Overall back to top
- Average sales prices dive, median hovers. April’s average sales price plunges 23% compared to March. This big dip in the average sales price could be an aftereffect of the 7 million+ sales that took place in the previous two months. However, the median pretty much stayed the same with a +2% adjustment.
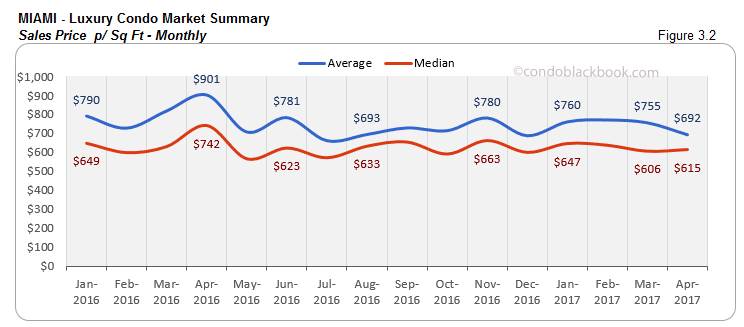
- Sales price/sq. ft. shows same trend. The sales price per sq. ft. (fig. 3.2) is a clear sign that people are getting more condo for their money now, as sellers are becoming more flexible with their prices.
Inventory Trends - Miami Luxury Condo Market Overall back to top
A balanced market will only have 9-12 months of inventory.
- 42 months of inventory. In the month of April, there were 3.8k active luxury condos on the market, plus another 184 pending. Considering inventory has been moving at an average (last 6 months) of 94 deals a month, we still have 42 months’ worth on the market.
- 5% decrease. We see a slight decrease in the months of inventory from March, but it’s still a far cry from the normal of 9-12 months.
- Buyers’ market continues. Considering we have ample inventory on hand, we are still in a very strong buyer’s market. For buyers, I’d say this is the perfect opportunity to land a great deal. For sellers, I’d advise you to either be flexible or take your property off the market and wait for a different market.
City and Neighborhood Market Reports
Miami Beach Luxury Condo Market Summary back to top
- Overall market trends on repeat, except price/sq. ft. Miami Beach’s luxury condo trends continue to be reflective of Miami’s overall trends, with the exception of the median sales price/sq. ft. as you’ll discover below.
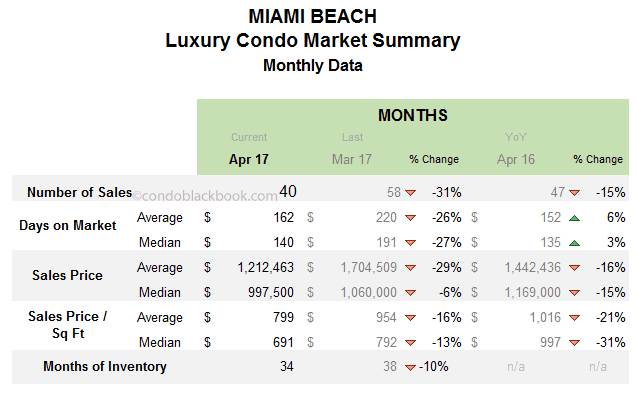
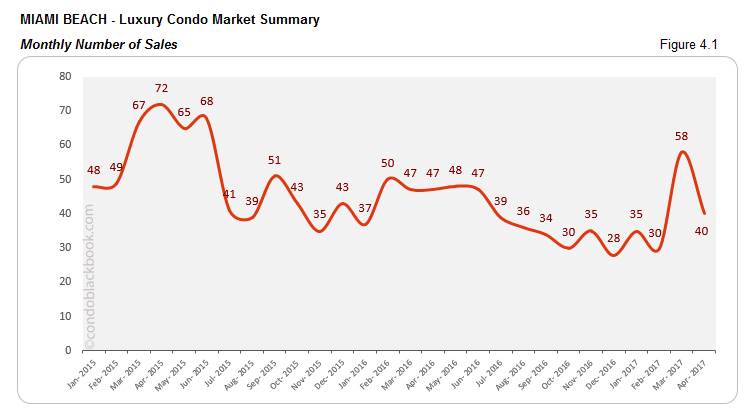
- Sales volume pulls back, but still positive. Fig. 4.1 shows how April’s sale volume took a hit as compared to March. Then again, March did post an exceptional spike. But, what’s worth noting is that it is still higher as compared to the last 8 months. This makes it imperative to keep an eye on how the market fares in upcoming months.
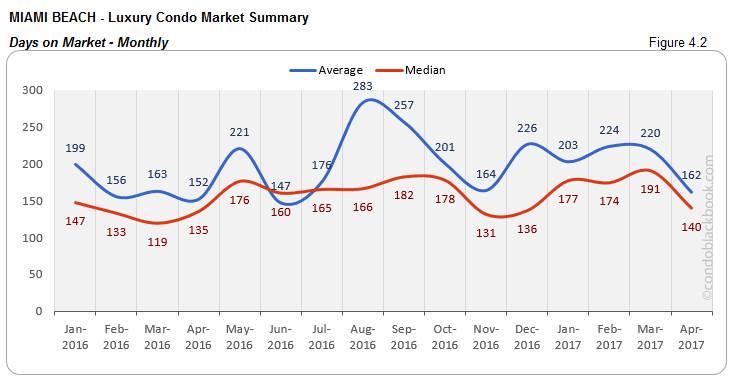
- Days on market decline. The average days on market for Miami Beach’s luxury condos show a decrease of 26% (market summary chart), which means properties are selling faster. It could be because sellers are more flexible and realistic with their prices. The median shows a decrease as well (fig. 4.2).
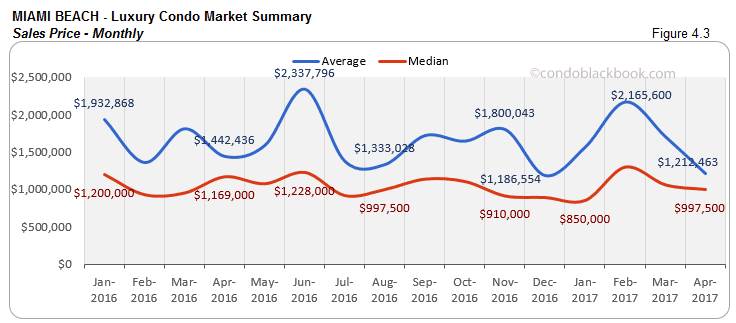
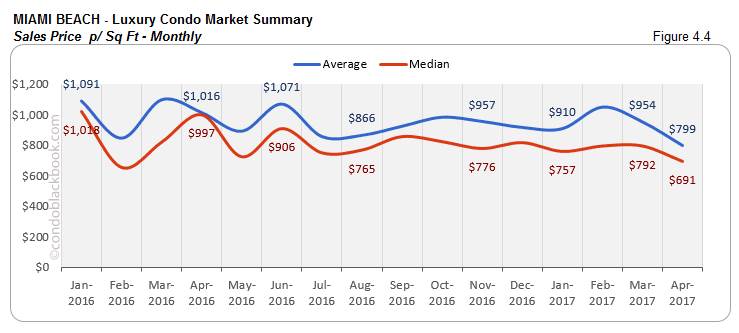
- Sales price follows Overall trend, sales price/sq. ft. defies. Fig. 4.3 shows how Miami Beach’s sales prices follow the overall trends in fig. 3.1. We have a fall in the average sales price, but the median manages to keep its head up (perhaps due to the ultra-luxury sales in preceding months). However, both the average and median sales price per sq. ft. take a plunge in fig. 4.4, but the same was not the case with the overall median in fig. 3.2.
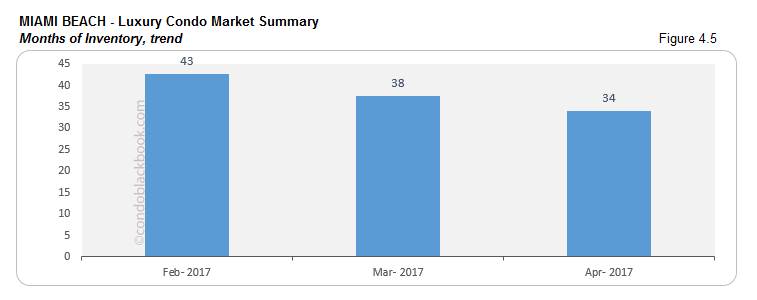
- 10% decrease in months of inventory, but not enough. Miami Beach has 1.2k active properties with 64 pending on the market. Considering an average of 38 sales a month for the coastal neighborhood (based on last 6 months’ averages), we still have 34 months’ worth (fig. 4.5). Though this is 10% lower than March, it is still way higher than the 9-12 month average of a normal market.
- It’s still a buyer’s market. With March’s major recovery, people were hoping for a rebound, but April failed to deliver. So for now, we are still in a buyer-friendly market, where the customer is in firm control and has the best negotiating power. With time in your favor, see what’s on sale in the Miami Beach condo market.
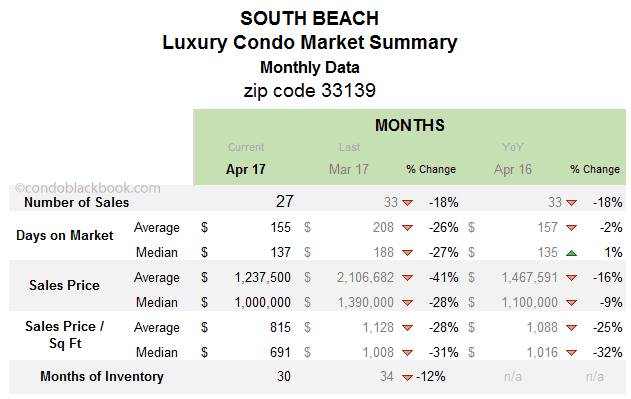
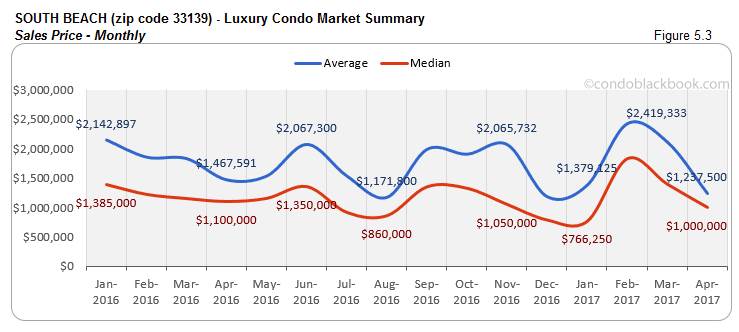
South Beach Luxury Condo Market Summary (33139 zip) back to top
- Luxury condo trends follow overall trends, except sales price trends.
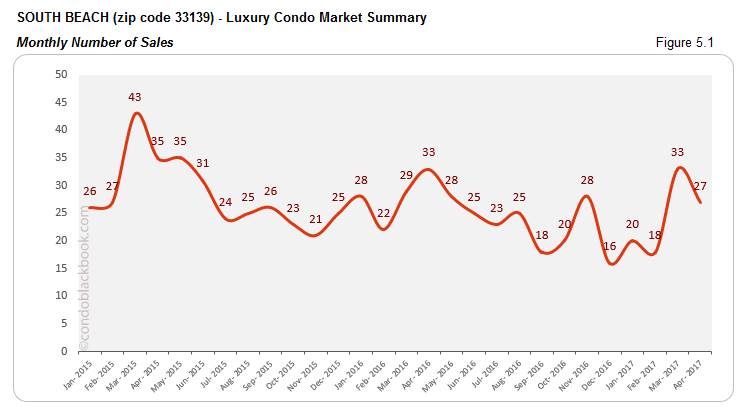
- Sales volume lower, but still good. Fig. 5.1 shows how sales took a slight dip for South Beach this April, but if you look at the couple of months preceding March, the neighborhood’s numbers still hold good.
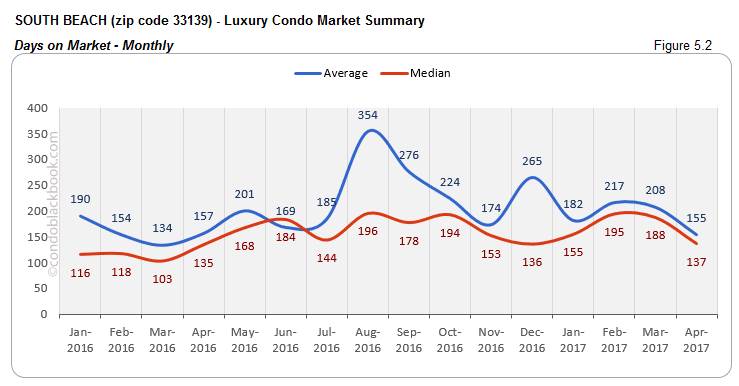
- Median days on market decrease 27%. Even though the sales numbers couldn’t beat March’s performance, the average and median days on market have declined for South Beach demonstrating willingness from sellers to price to sell.
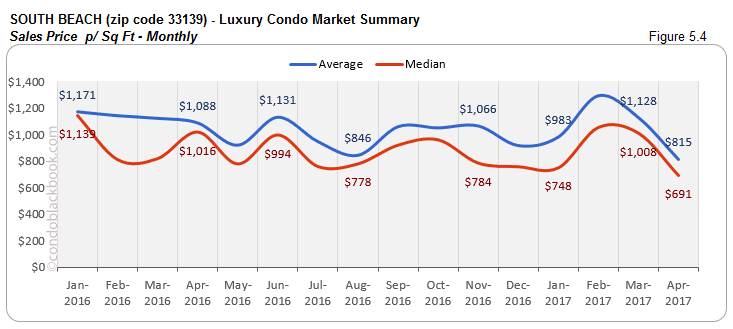
- Sale price and price/sq. ft. lower. While the average sales price in South Beach (fig. 5.3) has declined like the overall market (fig. 3.1), you will notice that the median has gone down for South Beach, but that was not the case for the market overall. Again, you can see the same trends and differences in the price/sq. ft. for the neighborhood (fig. 5.4) and market overall (fig.3.2).
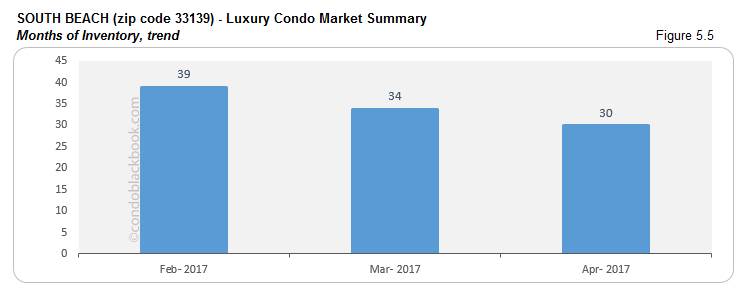
- 12% decrease in months of inventory, though still high. South Beach had 673 luxury condos on the market plus another 34 pending in April. Considering inventory moves at 24 deals a month (last 6 months’ average), the glamorous neighborhood still has 30 months of inventory on hand. Though there was a 12% decrease compared to March (market summary chart), it is still way higher than the 9-12 month normal (fig. 5.5).
- Buyers still have the upper hand. Though the days on market and months of inventory have decreased in South Beach, fact is, we’re still in a buyers’ market. However, it will pay off to keep a watchful eye in the upcoming months. For now, you can search South Beach condos for sale here or look up neighborhood lifestyle and amenities here.
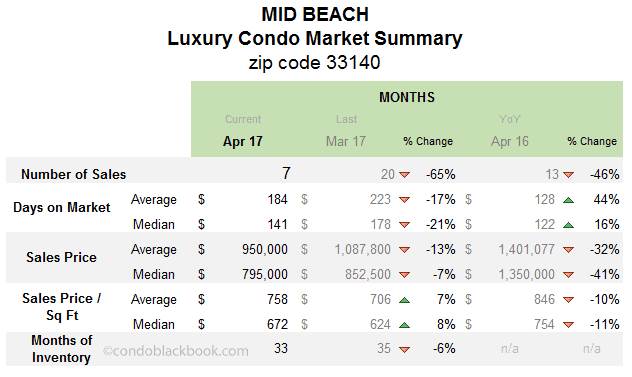
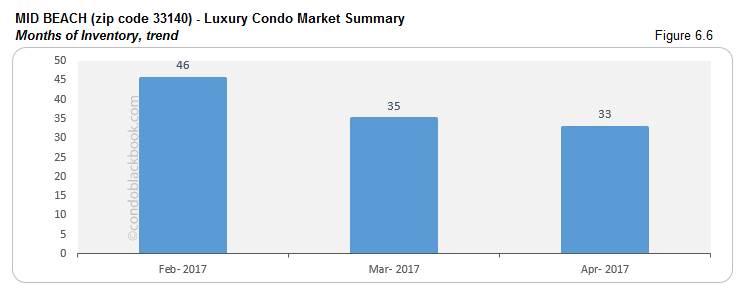
Mid-Beach Luxury Condo Market Summary (33140 zip) back to top
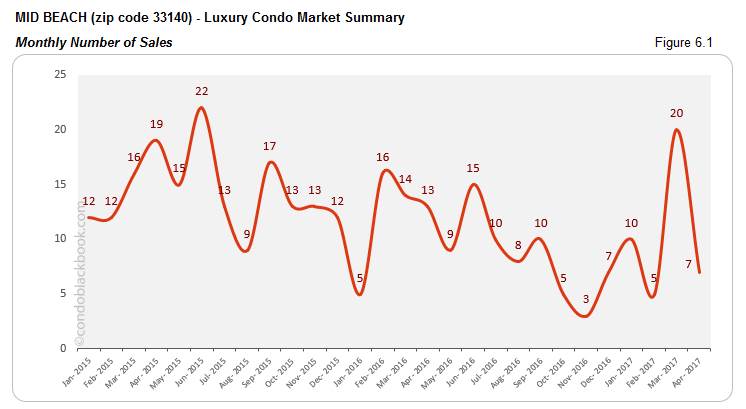
- Steep decline in sales volume, nothing to worry about yet. In a sharp contrast to March, April posted a steep decline in sales for Mid-Beach (fig. 6.1). However, looking closely at the months preceding March’s one-off spectacle, the decline doesn’t seem like a drop at all.
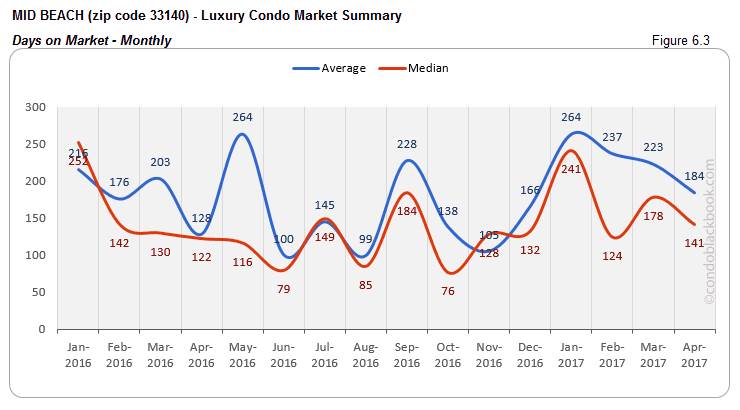
- Reduced days on market. Much like the market overall (fig. 2.1), the days on market show some positivity with a decline in their average and median (fig. 6.3). Meaning luxury condos are definitely moving off the market at a better rate than before.
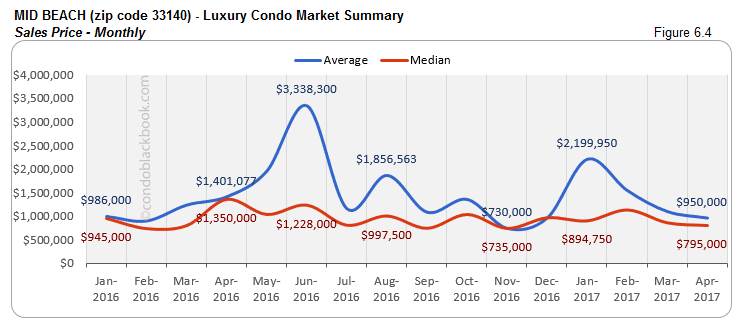
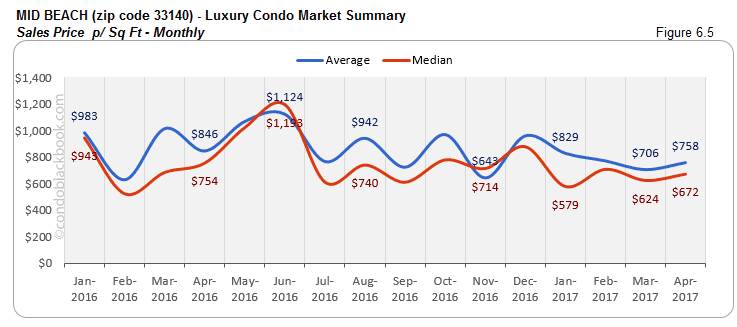
- Uptick in sales price/sq. ft. Although there’s nothing to write home about the sales prices in Mid-Beach (fig. 6.4), oddly enough, the prices per sq. ft. went up in April hitting an average of $758 (fig. 6.5).
- Months of inventory at 33, still high. Mid-Beach had 267 active properties on the market plus another 18 under contract in April. Moving at an average of 9 deals a month (last 6 months’ trend), the neighborhood has 33 months of inventory to deal with. Though there has been a decrease of 6% since March, it’s still much higher than the 9-12 month normal of a balanced market (fig. 6.6).
- Buyers have the advantage. Again, buyers have the upper hand in Mid-Beach. They can enjoy driving negotiations for now and search Mid-Beach condos for sale here. However, with a decline in days on market and inventory, things could shift any time. Click for a candid tour around Mid-Beach.
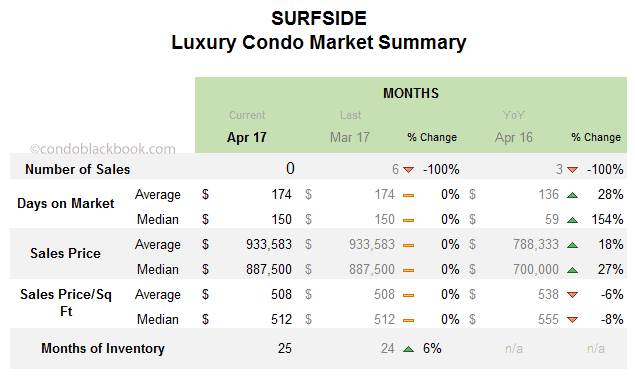
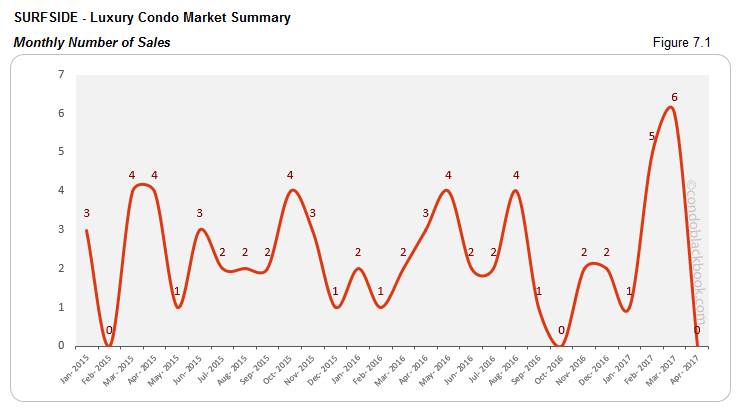
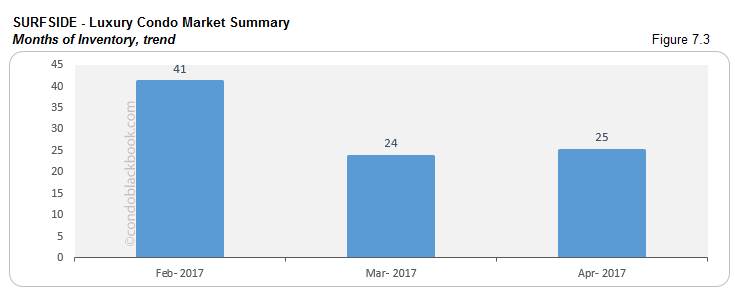
Surfside Luxury Condo Market Summary back to top
- Zero sales, not reflection of overall market. Yes, you read that right; Surfside had no sales to report in April. However, like we’ve mentioned before, this is a small neighborhood that usually dances to its own tune when it comes to luxury condos, and rarely reflects or impacts overall trends. Also, this isn’t the first time we see no sales for this seaside community (fig. 7.1). Look at any of the larger neighborhoods for a better understanding of market trends.
- 25 months of inventory. Currently, there are 64 active luxury condos on the market and 3 pending in Surfside. Considering an average of 3 deals a month (last 6 months’ trend), this seaside neighborhood still has 25 months of inventory that’s again higher than the 9-12 month normal (fig. 7.3).
Intrigued by this pocket-sized neighborhood? See what makes the chic Surfside a popular pick, or .
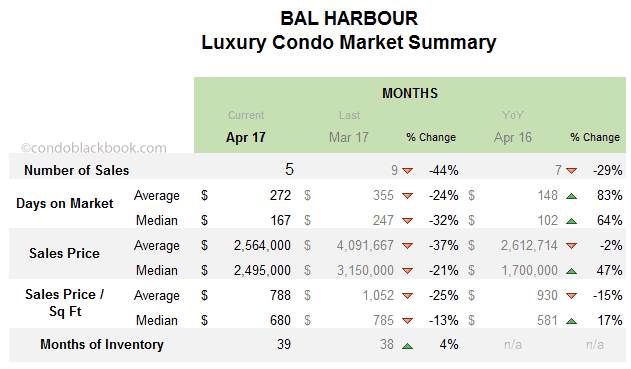
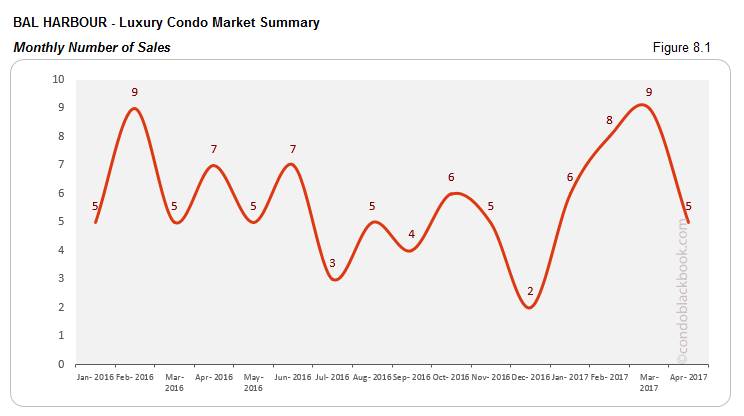
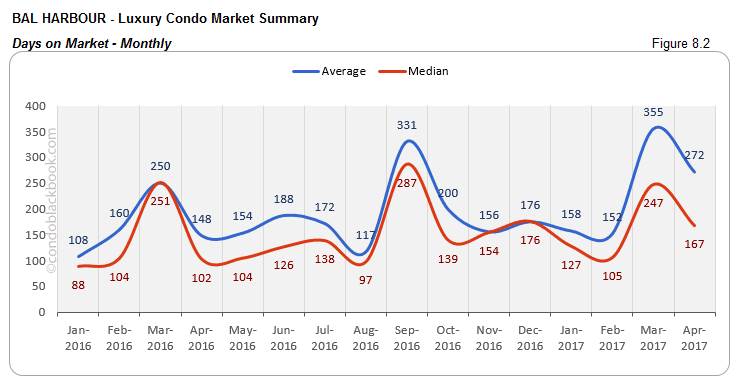
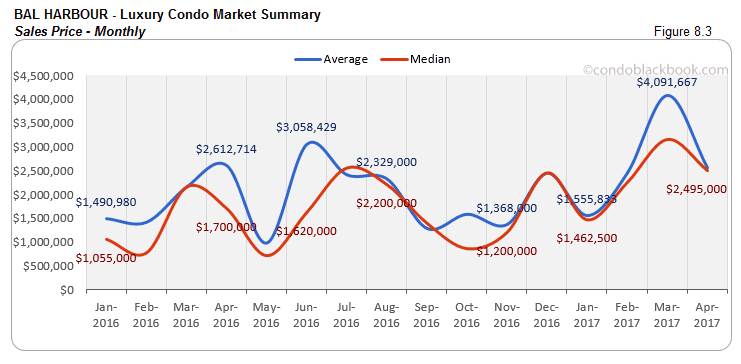
Bal Harbour Luxury Condo Market Summary back to top
- Slower sales, but days on market still decline. Much like the overall market trends (refer overall market summary chart), Bal Harbour too shows a drop in sales. But, considering March posted unusually high numbers, this is not too worrisome as the days on market for luxury condos has reduced, giving positive reassurance about moving toward a more balanced market.
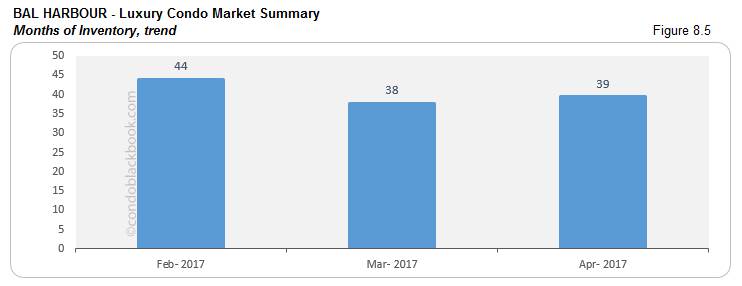
- Buyers have edge with 39 months of inventory and price drop. Bal Harbour currently has 220 active listings, plus another 10 under contract, moving out at an average of 6 deals a month (last 6 months’ trend), the upscale neighborhood has 39 months of inventory left-over (fig. 8.5). This higher than (9-12 month) normal inventory still points to a market favoring buyers like last month.
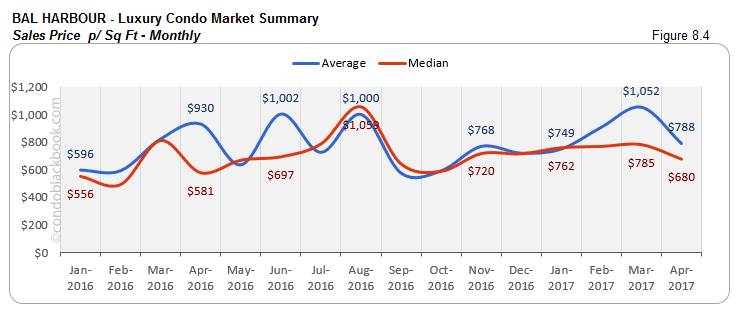
- Buyers would also appreciate that the median sales price per sq. ft. (fig. 8.4) of this upscale neighborhood has come down to under $700.
Click to see what makes Bal Harbour a top place to live in, or Search Bal Harbour condos for sale here.
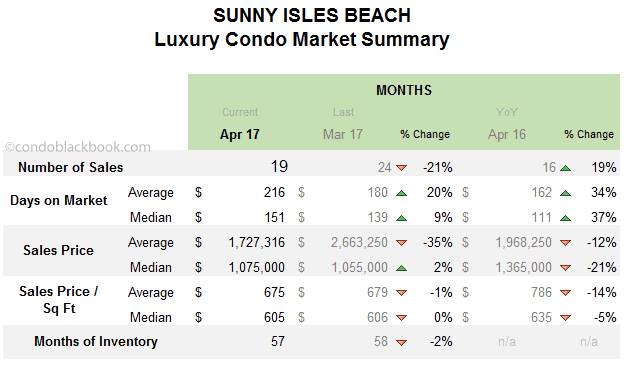
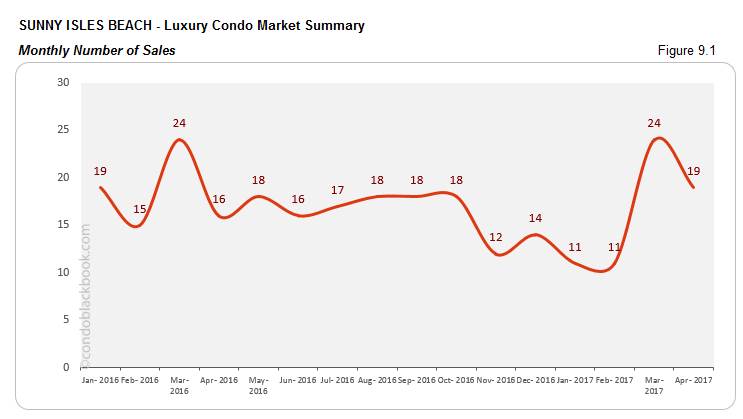
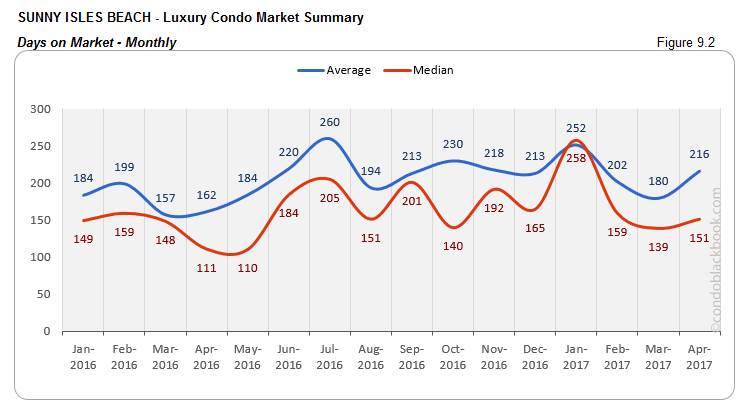
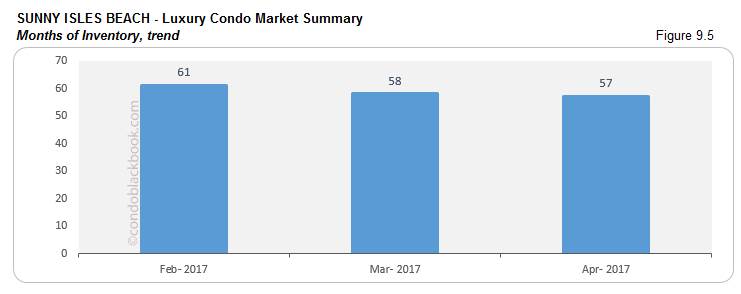
Sunny Isles Beach Luxury Condo Market Summary back to top
- Sales recede like overall market, days on market increase. While the 21% sales drop in Sunny Isles Beach is in tandem with the overall market (refer overall market summary chart), what’s odd is that the days on market have actually increased for this beach town (fig. 9.2), whereas it has decreased for the market overall.
- Inventory reduces, but not enough. Sunny Isles Beach currently has 836 active luxury condo listings, plus another 30 pending. Taking an average of 15 deals a month (last 6 months’ trend), this beachy neighborhood still has 57 months of inventory on hand, that’s way higher than the 9-12 months normal.
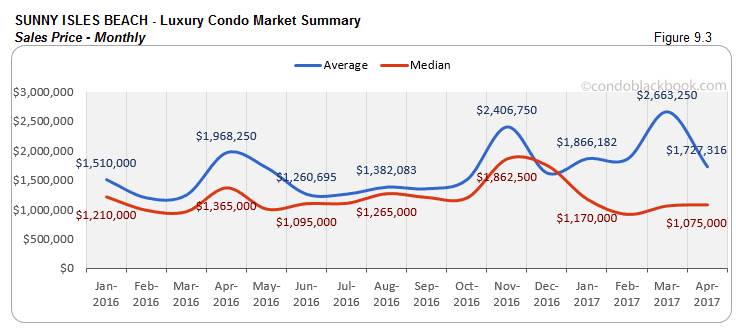
- Buyers still get upper hand. With high inventory and a 35% drop in average sales price (fig. 9.3), buyers are still in firm control.
Buyers can tour the amenities and lifestyle of Sunny Isles Beach here, or search Sunny Isles Beach condos for sale here.
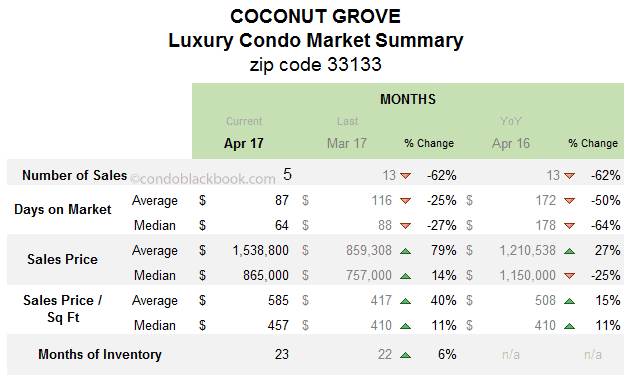
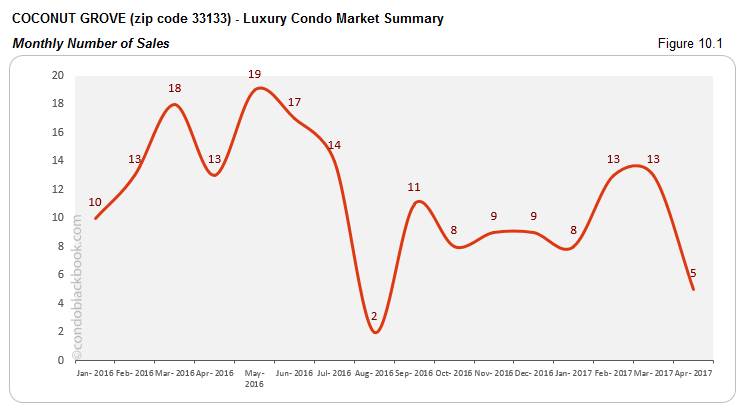
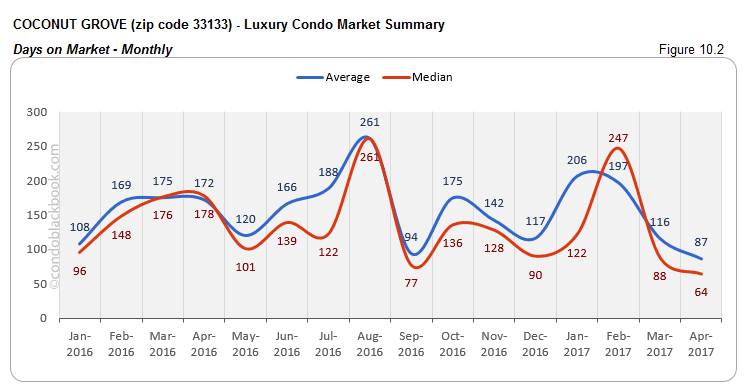
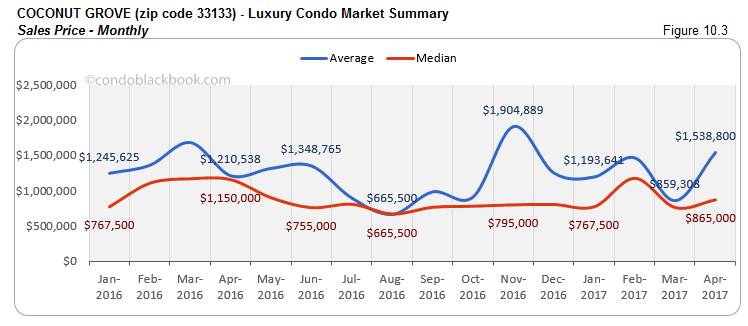
Coconut Grove Luxury Condo Market Summary (33133 zip) back to top
- Decrease in days on market (and sales) pointing to positive. This early bird of sales recovery posted only 5 sales in April (less than half of February and March). Considering this is a smaller market for luxury condos, it is quite normal to see some volatility here. Nonetheless, progress is being made as the average days on market have come down by 27% (market summary chart) in Coconut Grove, showing that the market is getting movement.
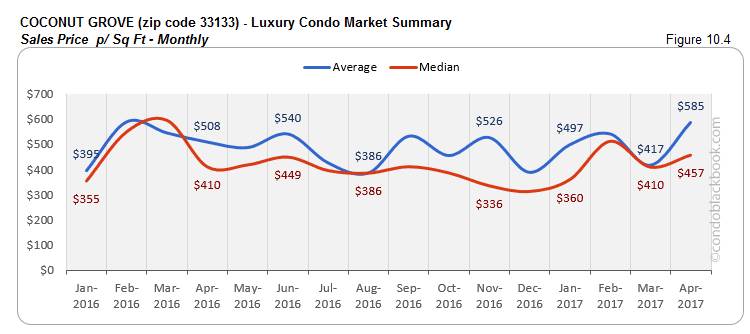
- Average sales price and price/sq. ft. shoot up. Another interesting thing to note in Coconut Grove is how the prices shot up in April. What fueled this jump is that two (out of the five) sales were for $2 and $3 million, in a market that averages around $1.5 million. This is the only reason we see some noise in the averages, but not as much in the median (fig. 10.3 and 10.4).
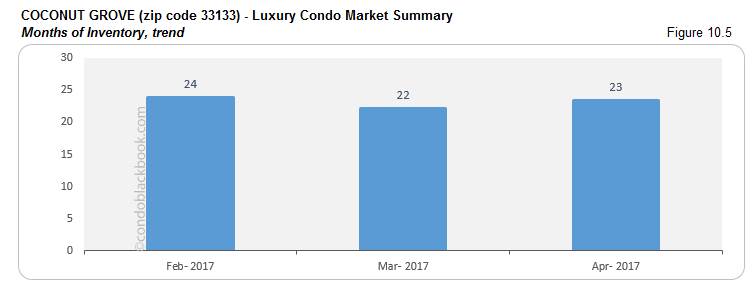
- 23 months of inventory, buyers still have an edge. Coconut Grove currently has 198 active condo listings plus 25 pending, selling at an average of 10 deals a month (last 6 months’ trend). This is still higher than the 9-12 month normal so buyers can easily grab great deals in this scenic neighborhood.
See what lifestyle options exist in the historic Coconut Grove, or search Coconut Grove condos for sale here.
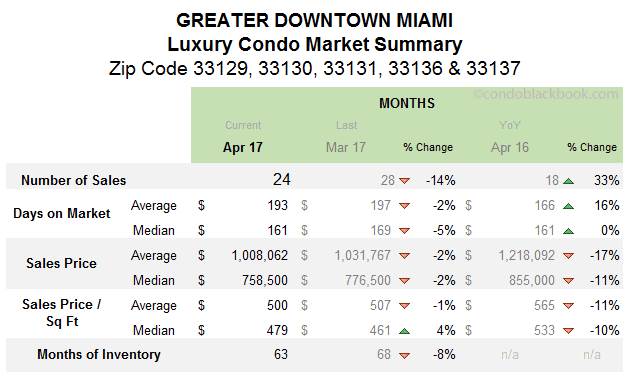
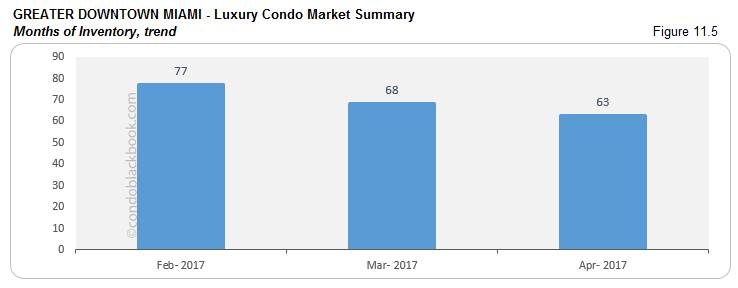
Greater Downtown Miami Luxury Condo Market Summary (33129, 33130, 33131, 33136, 33137 zips) back to top
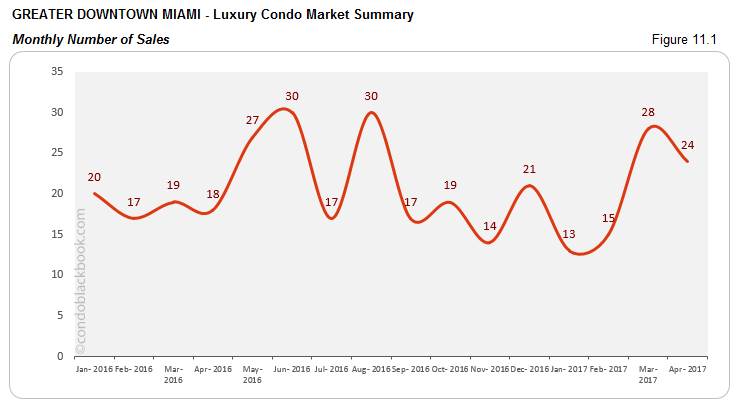
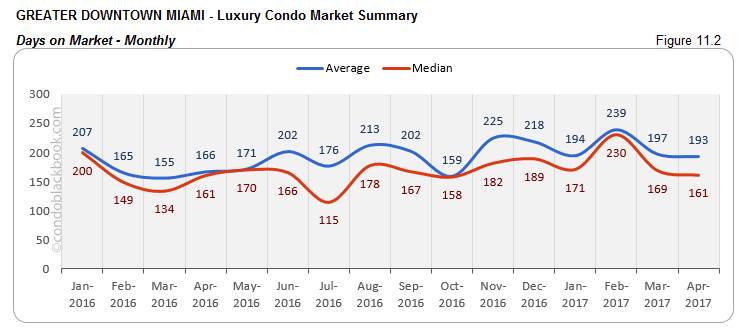
- Sales momentum continues, though not much changes for days on market. While sales in previous months were pretty slow and even March didn’t work much wonders here, April still manages to keep its head up as compared to other sub-markets. Fig. 11.1 makes it clear that the area is definitely keeping its luxury condo sales momentum, with very little setback to report. However, the progress is slower than other neighborhoods as the average days on market have only gone down 2% (fig. 11.2).
- Still second highest months of inventory. Although the neighborhood’s posted an 8% decline in inventory, it is still very high compared to the 9-12 month normal plus other sub-markets. Greater Downtown Miami has 1.2k active listings, with another 38 pending. Considering its average of 19 deals a month (based on last 6 months’ trends), there is still 63 months of luxury inventory to be dealt with.
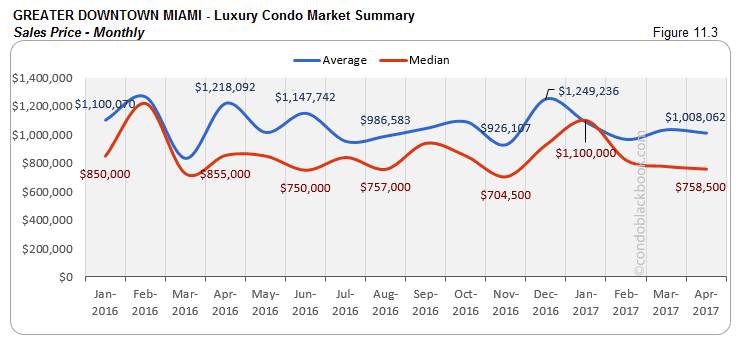
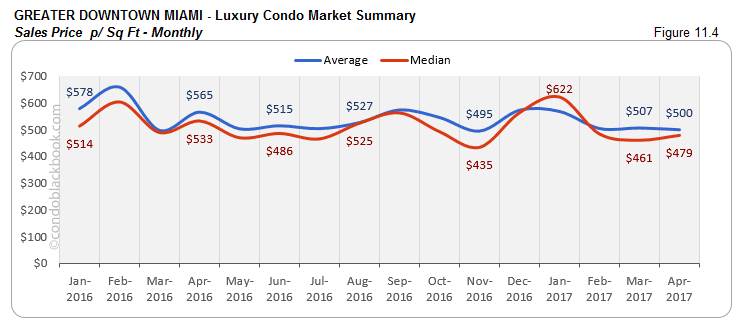
- Decline in price and price/sq. ft., market favors buyers. With such high inventory and the average price (fig. 11.3) plus price per sq. ft. (fig. 11.4) recording a drop, Greater Downtown makes a very lucrative market for buyers looking to land great luxury condo deals.
Low prices and more choice makes it that much easier to get into this central neighborhood. Simply click to see what condos are available in the Greater Downtown Miami area.
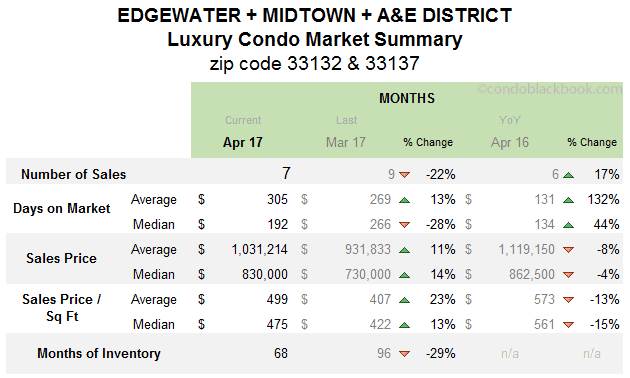
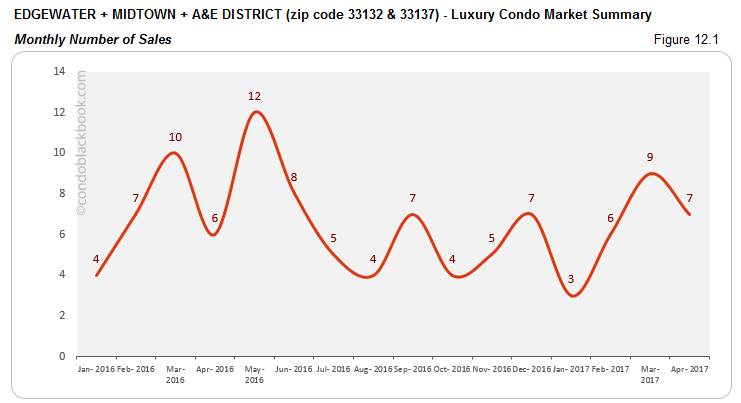
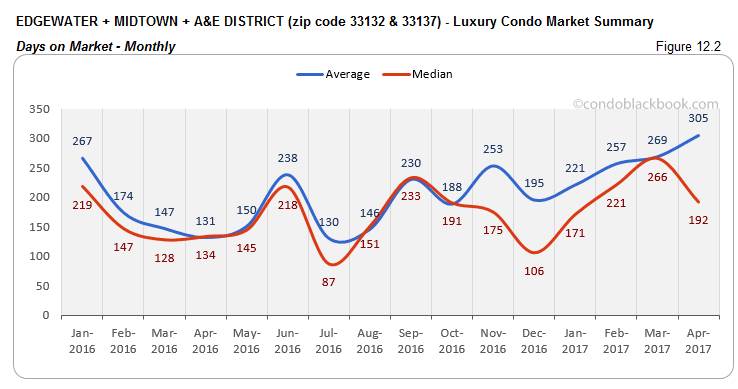
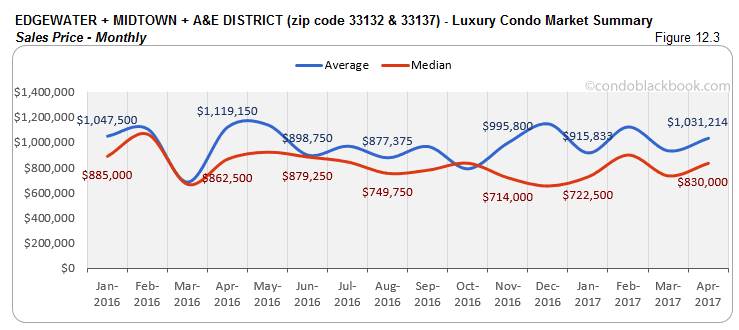
Edgewater + Midtown + A&E District Luxury Condo Market Summary (33132 + 33137 zip) back to top
- Reflects market with dip in sales and days on market. Much like the overall market (fig. 1.1), this grouping reports a lower sales volume than March, but it still looks good when compared to earlier months (fig. 12.1). The median days on market have gone down quite a bit, which likely points to flexibility and more realistic asking prices from sellers. Since, this is again a small market for luxury condos, some volatility is natural.
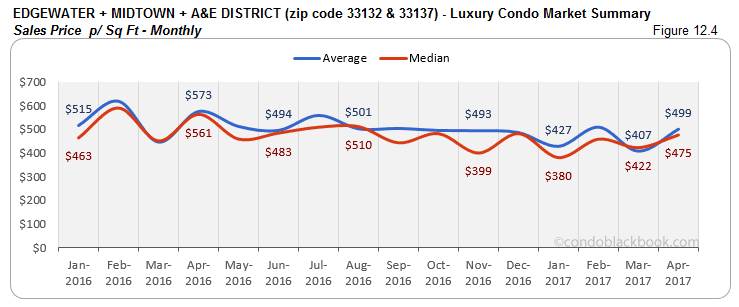
- Sales price and price/sq. ft. inflate. The inflation we see in fig. 12.3 and 12.4 is due to 3 (of the 7) sales being above the average $1 million mark, which is why there is this sudden jump in trends.
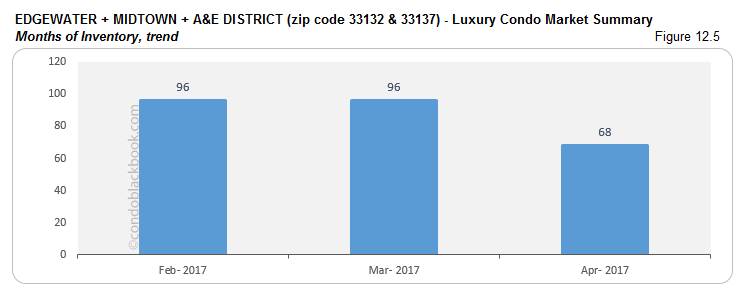
- Months of inventory drop, but still highest. This grouping has been sitting on some of the highest levels of inventory (fig. 12.5) as compared to other sub-markets. In April, there were 411 active condo listings from these neighborhoods, plus 11 pending. Considering an average of 6 deals a month (based on last 6 month’s trends), we’re still looking at 68 months of inventory, despite a 29% decrease (market summary chart). This number is still much higher than the 9-12 month normal of a balanced market.
- Buyers still gain. Despite inflated prices, buyers can go in for a great deal in this group of neighborhoods, as this grouping has the highest amount of inventory waiting to get off the market.
You can check out the individual lifestyle and condo options in Edgewater, Midtown and Arts & Entertainment District, or search Edgewater condos for sale here.
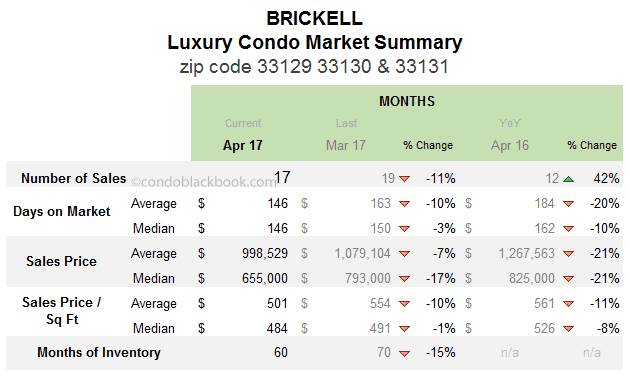
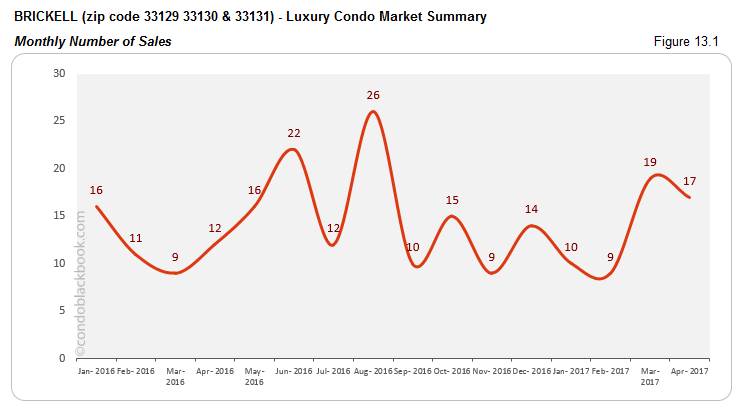
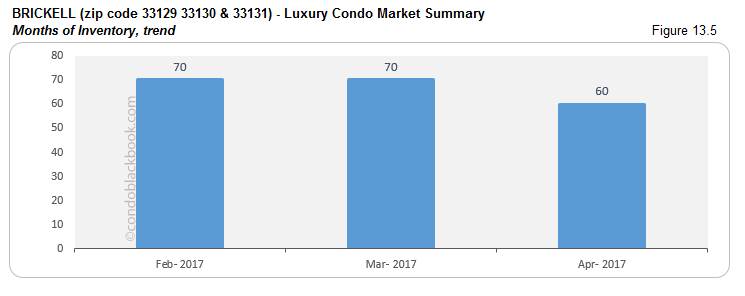
Brickell Luxury Condo Market Summary (33129, 33130, 33131 zip) back to top
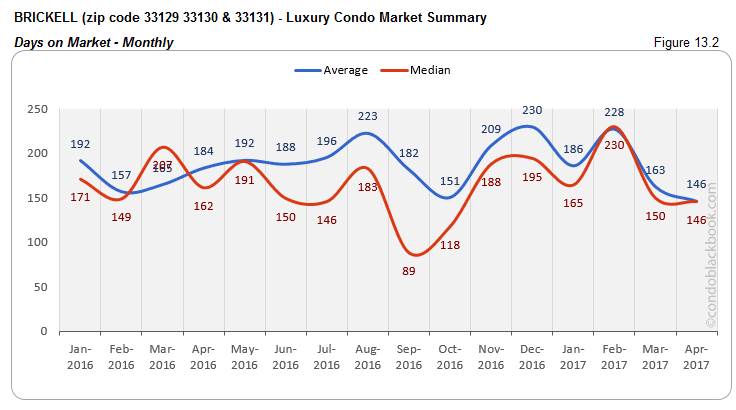
- Good sales volume, plunge in days on market. Following up on March’s spectacular show was tough for most sub-markets, but not Brickell. This financial hub posted a slightly lower sales volume (fig. 13.1), which we consider to be actually great when compared to previous months. The momentum showed its magic when the average days on market dropped 10% (fig. 13.2).
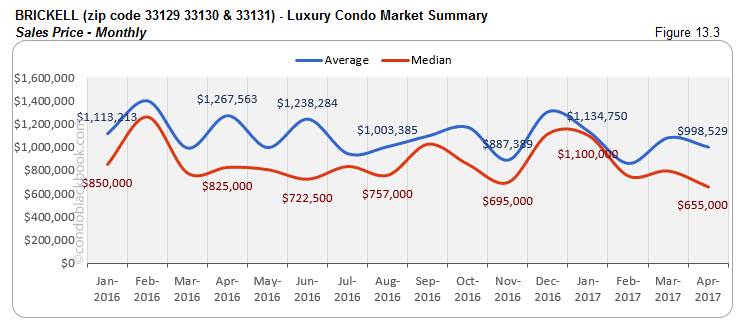
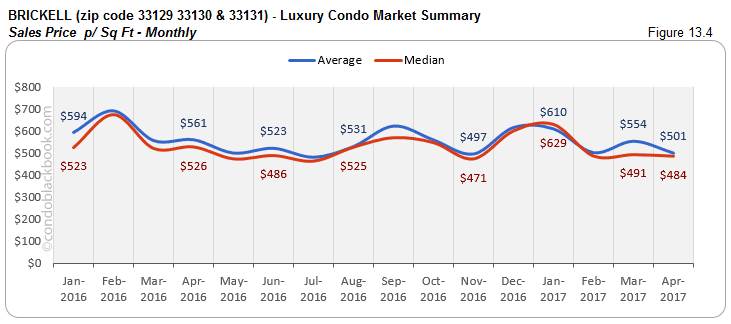
- Price and price/sq. ft. decline. There’s been quite the price drop in the median sales price per sq. ft., bringing it down to $484 (fig. 13.4). Even the average and median sales prices have dropped in Brickell (fig. 13.3).
- Months of inventory drop 15%, but buyers can still play. Brickell has 752 active condo listings, with 27 pending. Taking its average of 13 deals a month (last 6 months’ average), the commercially significant neighborhood now has 60 months of inventory. Even though there has been a decline of 15% (fig. 13.5), the number is way higher than the 9-12 months normal of a balanced market.
This is the right time to go shopping in Brickell, since prices are low and inventory is high. Click to dabble through Brickell’s lifestyle options or search Brickell condos for sale here.
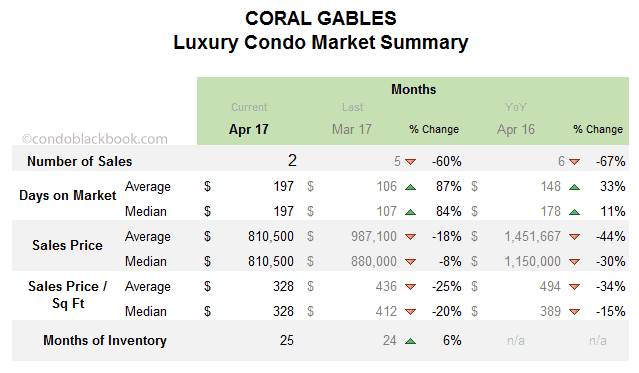
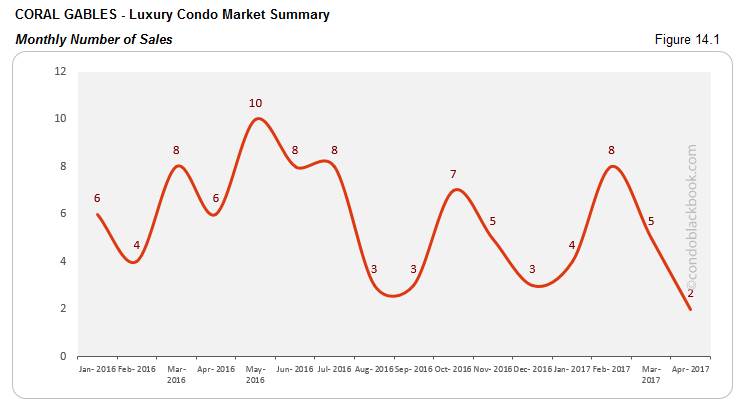
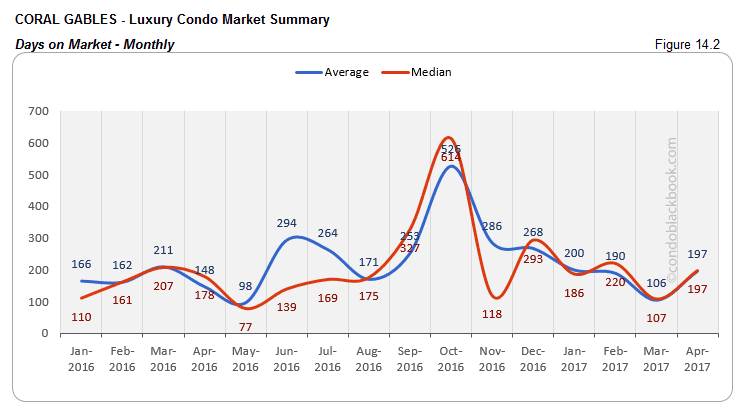
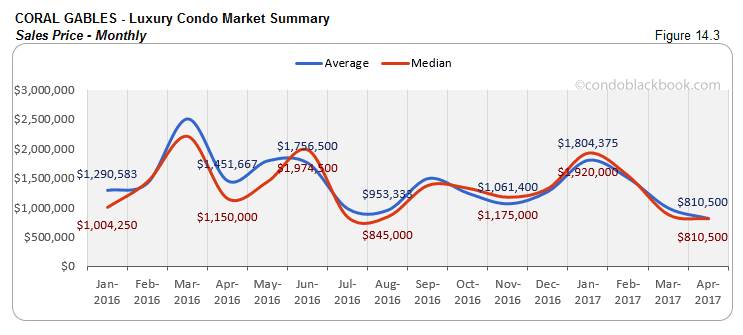
Coral Gables Luxury Condo Market Summary back to top
- Sales down, days on market up - non-reflective of market. Coral Gables is again a quiet neighborhood when it comes to luxury condos. So, when we see a more than half drop in sales (fig. 14.1) and increase in days on market (fig. 14.2), it shouldn’t be cause of alarm or taken as a reflection of the market overall.
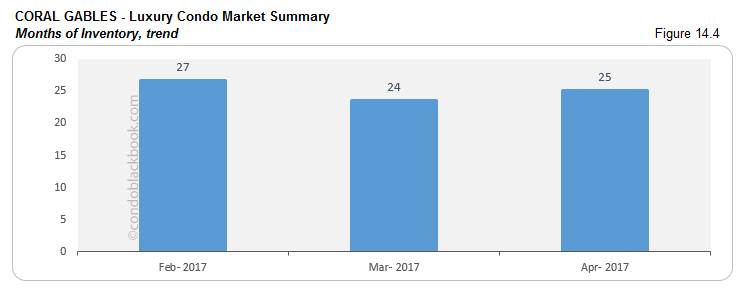
- 6% increase in inventory. Coral Gables has 102 active luxury condo listings with 11 pending. Considering an average of 5 deals a month (last 6 months’ trends), City Beautiful still has 25 months of inventory (fig. 14.5). That’s significantly higher than the 9-12 month normal.
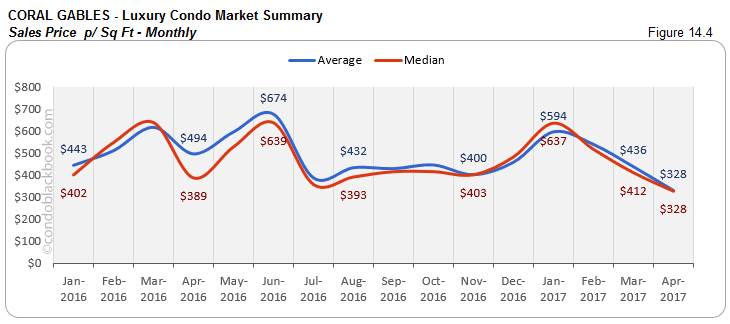
- Drop in prices, great opportunity for buyers. Whether the neighborhood is reflective or not of the market, fact is, there is a 20% drop in the sales price per sq. ft. (fig. 14.4) and 18% drop in average sales price (fig. 14.3) in City Beautiful. This coupled with high inventory offers a great bargaining position to buyers.
Click to see what Coral Gables has to offer in lifestyle, or search Coral Gables condos for sale here.
Conclusion back to top
Good news continues for buyers in April too. If you have been looking to buy your first condo, second home or simply invest in a luxury condo in Miami, the timing couldn’t be better. In spite of the months of inventory coming down in most sub-markets, there is still ample to get through before we hit a more balanced market. For the time being, buyers can have their pick of the litter.
Love what you see? Don’t forget to share our blog and subscribe (see the subscribe link on the top menu) to receive the latest market news in your inbox.
Have any questions? Or see something wrong with the stats? Please contact Sep at sniakan (at) hbroswell.com or call 305-725-0566.
Share your thoughts with us

Your Miami Condo Awaits
Recent Posts


 (305) 697-7667
 (786) 321-7233
  contact@condoblackbook.com

