Luxury Miami Condo Report: Dec 2017 and 2017 Annual Report

Jan 21, 2018 January 21, 2018
Miami Luxury Condo Market Summary
City and Neighborhood Luxury Condo Reports
Miami Beach Luxury Condo Report
South Beach Luxury Condo Report
Bal Harbour Luxury Condo Report
Sunny Isles Beach Luxury Condo Report
Greater Downtown Miami Luxury Condo Report
Edgewater / Midtown / A&E District Luxury Condo Report
Coconut Grove Luxury Condo Report
Coral Gables Luxury Condo Report
Miami Luxury Condo Market Report: Summary back to top
December played out almost as expected, closing the year and last quarter with stronger sales. A majority of the neighborhoods also reported a reduction in their months of inventory, pointing towards another positive. Predicting better sales and momentum for 2018, we are expecting the luxury condo market in Miami to stand in a much better position come this year’s end. Read on for our quarterly analysis and December’s highlights.
For the purpose of this luxury condo report, we have only considered properties priced $600,000 and above.
Overall Market Highlights:
- Annual sales miss the mark by minute margin, however last quarter closes on a high note
- Yearly days on market increase, but Q4 closes with a hint of (reduction) positivity
- Annual analysis shows lower prices overall, adding to buyer motivation
- Inventory reduces marginally giving market hope
- Though market still favors buyers, strongly expecting a turnaround by end of 2018
Sales gather some wind under their wings, momentum expected to continue. We have 2017 closing on a strong note with most neighborhoods posting an uptick in their quarterly results. This adds to our hope of a robust start to the first quarter, as more of that winter magic trickles in. We also have the tax cuts to the wealthy coming into play soon, which should further set the ball rolling.
Days on market still high, expect to ease out by year end. Even as 2017 posts a higher days on market, we predict the metric to either go steady or reduce in 2018. With an increased buyer demand and lower prices, we hope to see properties move faster this year.
Overall prices dip, expected to attract more buyers. We’ve known that sellers have finally come to terms with this buyer’s market and it’s now visible in the price charts below. With the luxury condo market being flexible with its pricing, more buyers are expected to turn up for deals in 2018. This is then expected to chip away at the glut of inventory we’ve seen looming over 2017.
Overall lower months of inventory, expected to reduce further in 2018. Even as more condo projects were delivered by year-end, we see a decline in the months of inventory for most neighborhoods in our study. With higher sales and lower prices, the stage is set for this stock to clear off significantly by year-end 2018.
Overall, we see a market that is finding its momentum. With factors like winter demand and lower prices playing in its favor, we expect a turnaround to surface in the latter half of 2018.
Where Does the Market Go From Here?back to top
In previous reports, we’ve discussed at length how a strengthening U.S. dollar, strong stock market and shaky start to the presidency had been holding back sales numbers and brought the current condo market to favor buyers.
However, we expect the following to alter trends and bring the market back in balance:
- Positive impact of tax cuts. With the tax cuts rolled out, we expect to see the full impact of these in the first two quarters of 2018. As this overhaul favors the wealthy, we look forward to more of the elite to come shopping for second homes in Florida.
- Lower prices motivating buyers. With most neighborhoods posting a drop in prices, we see how sellers have adapted themselves to appeal to this buyer’s market. We expect this drop to further motivate buyers, bringing up sales numbers, and eventually getting the luxury condo market back in balance.
Below is an insight into Miami’s overall and neighborhood-level luxury condo trends for the month of December 2017:
Monthly Number of Sales - Miami Luxury Condo Market Overall back to top
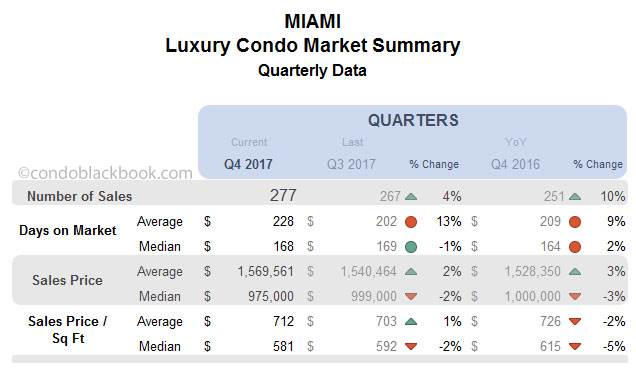
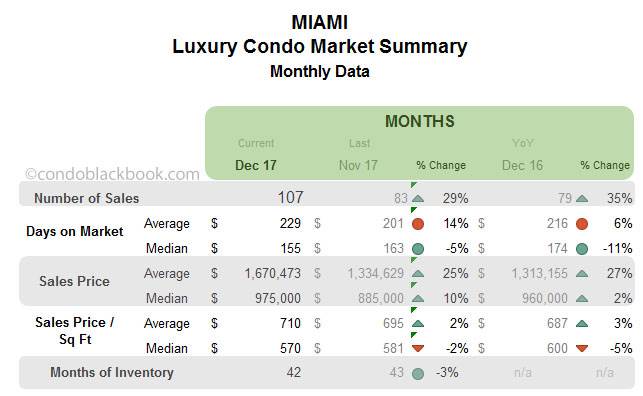
- Strong winter closes year on a high note. The monthly and quarterly charts below reveal how 2017 went out with a bang. We see Q4 closing 10% higher than same time last year (fig. 1.1). We can also see how December’s sales closed 29% stronger than last month and 35% higher compared to last year (fig. 1.1.1). As expected, a strong winter came with a little pick me up for the year-end market in Miami. Hopefully, we will see this positive trend continue into 2018.
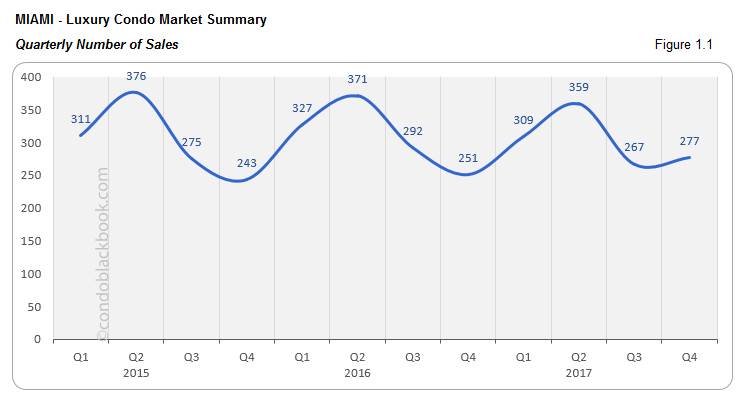
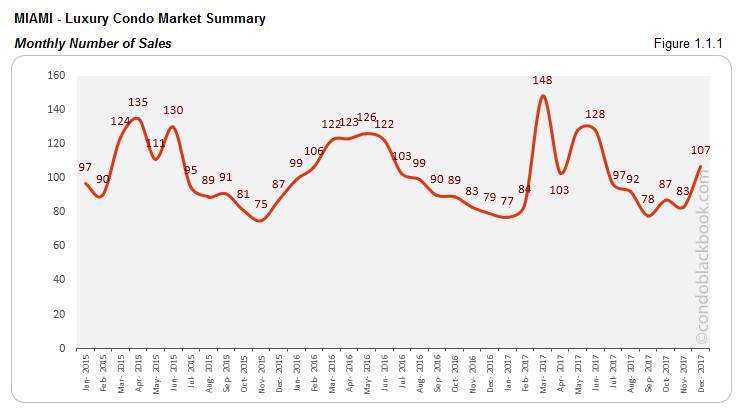
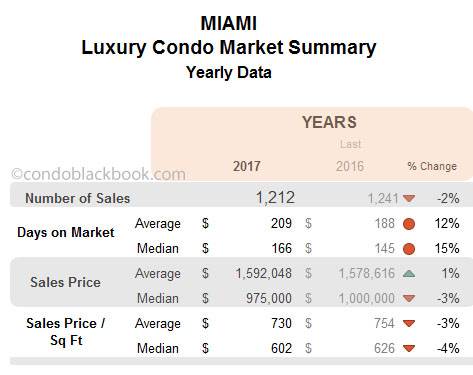
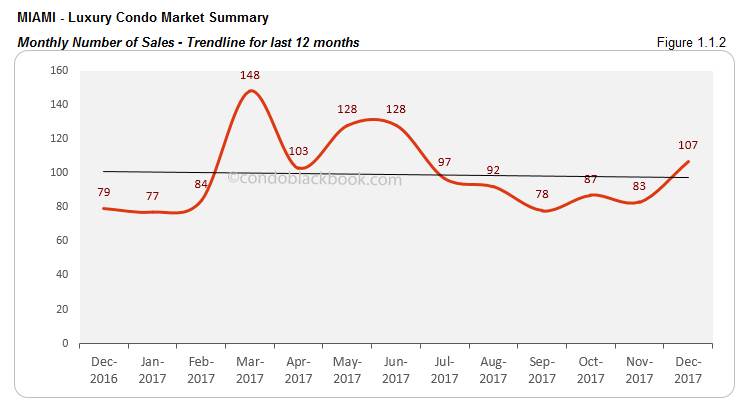
- Overall trend line tips down. Looking into the annual numbers above for the luxury condo market, we see 2017’s sales fall 2% short when compared to 2016. This becomes pretty evident in the trend line tracing sales over the past 12 months below (fig. 1.1.2), which tips forward as the year closed.
Days on Market - Miami Luxury Condo Market Overall back to top
“Days on market” are the total number of days from when a property is active to the day it goes under contract.
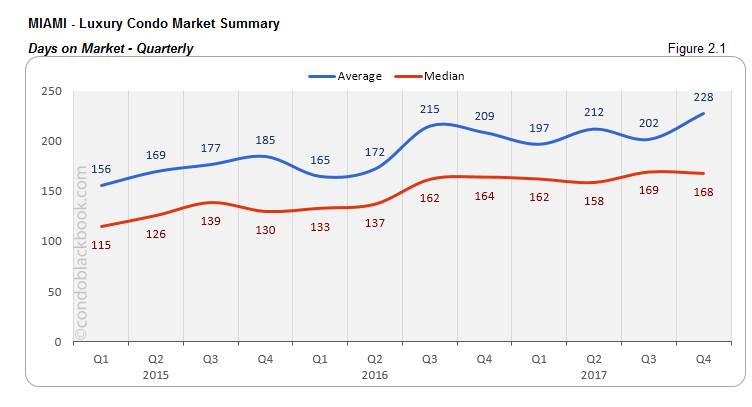
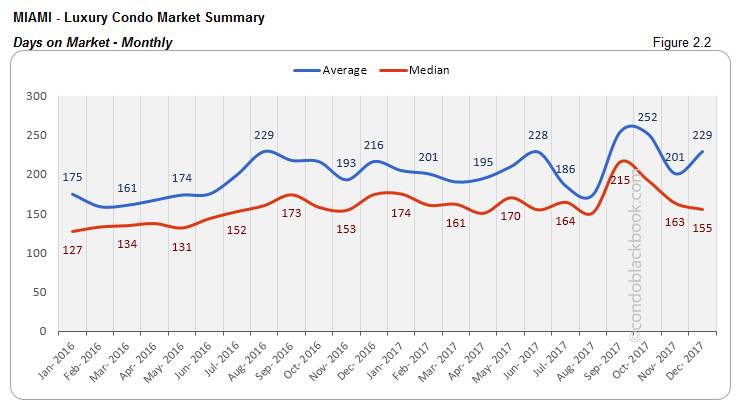
- Annual days on market close higher, while quarterly and monthly numbers post improvement. We see a 15% increase in the median days on market in 2017 as against 2016. However, just as the year closed, December posted a 5% decrease against November (fig. 2.2). With both November and December posting a decrease in their median days, we see Q4 closing 1% lower than Q3 (fig. 2.1). We definitely hope to see more of this positive trend in 2018.
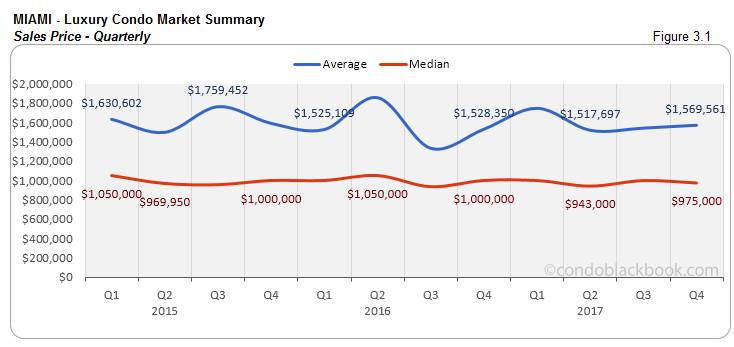
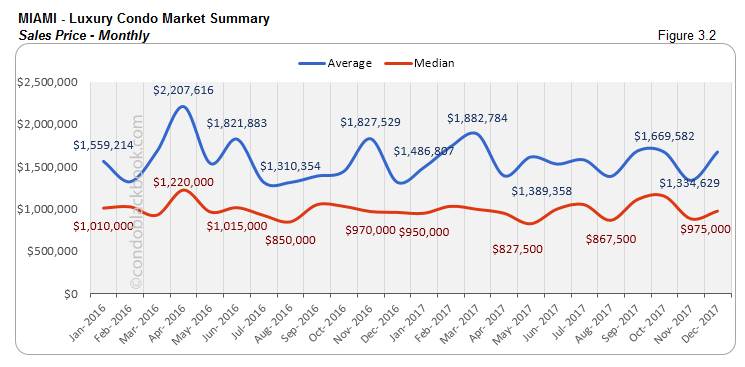
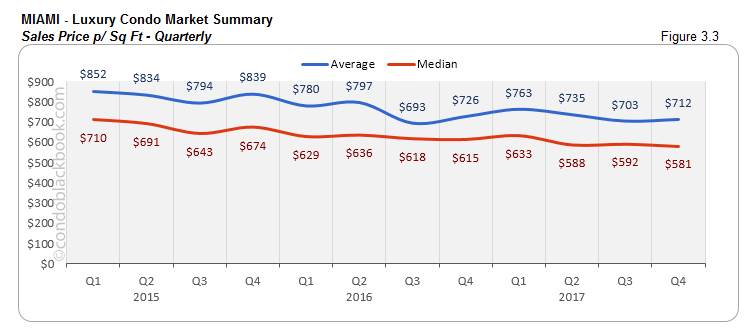
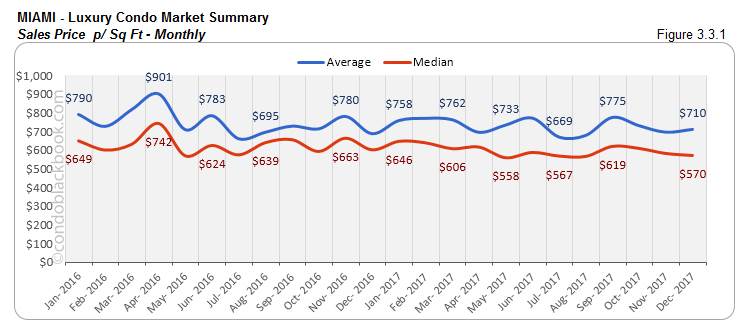
Sales Price Trends - Miami Luxury Condo Market Overall back to top
- Yearly prices come down, as do quarterly figures. Looking at the bigger picture above (yearly data chart), it’s easy to see how the buyer’s market influenced prices to come down in spite of a fair amount of ultra-luxury sales (above $2 million) in 2017. The median price in 2017 was 3% lower than 2016, while price per sq. ft. dropped 4%. The quarterly sales price charts (fig. 3.1) show a 2% decline quarter-over-quarter, and a 3% year-over-year decline. The quarterly sales price per sq. ft. (fig. 3.3) also followed suit.
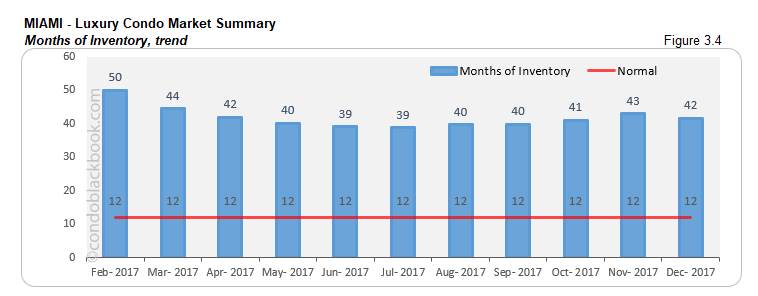
Inventory Trends - Miami Luxury Condo Market Overall back to top
A balanced market will only have 9-12 months of inventory.
- Inventory dips 3%, though trend still favor buyers. It is refreshing to see the months of inventory decrease 3%, even with lots of new projects being delivered year-end. Fig. 3.4 shows the months of inventory standing at 42 (3986 active listings + 175 pending listings divided by a 6-month average of 100 deals a month). Hopefully, the momentum garnered in December will continue into 2018 to further bring down this trend closer to the 9-12 months of a balanced market. Until then, buyers can take their pick of the litter and enjoy an upper hand in negotiations.
City and Neighborhood Market Reports back to top
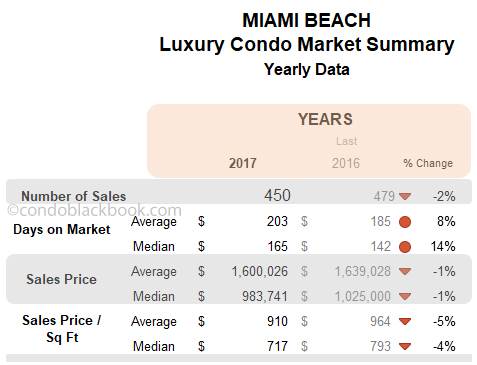
Miami Beach Luxury Condo Market Summary back to top
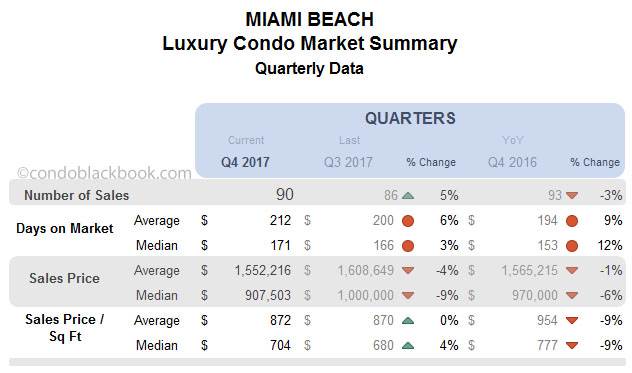
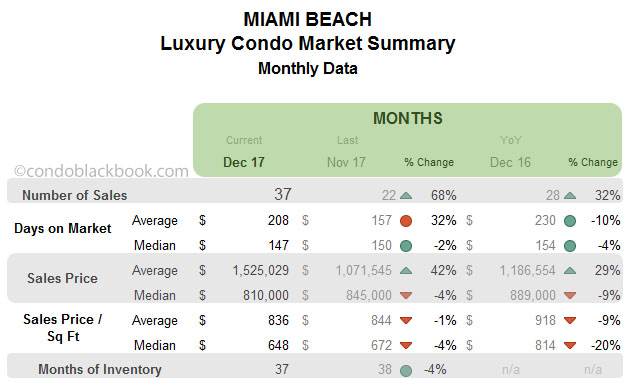
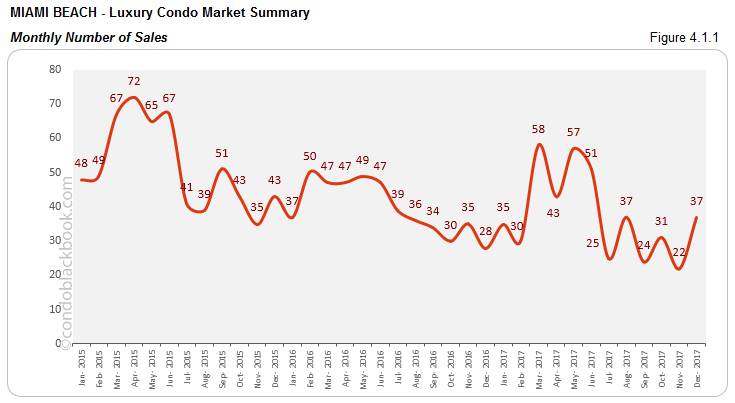
- Monthly sales up, but slack in historical analysis, still future-positive. December paints a robust sales picture in Miami Beach. We see a 68% month-on-month and 32% year-over-year increase (fig. 4.1.1). But, even though Q4 posts a 5% increase over Q3, it falls 3% short of Q4 last year (fig. 4.1). Nonetheless, we still expect a strong opening to 2018, if December’s numbers are to be taken as any kind of indication.
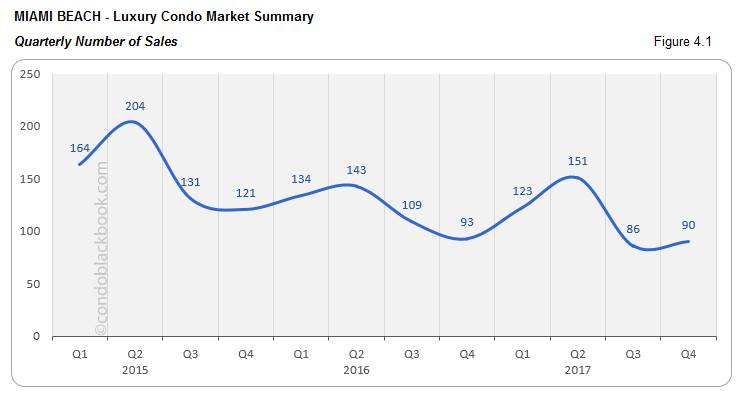
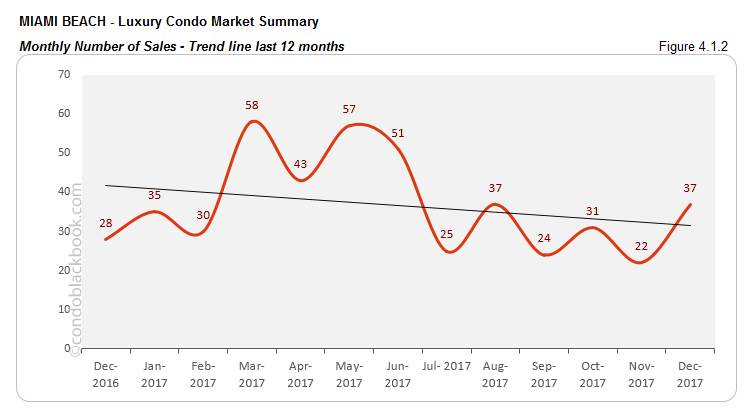
- Annual trend line posts sharp decline. Fig. 4.1.2 below traces sales over the last 12 months. Even though spring time posted some highs, the annual sales fell 2% against 2016 leading to the negative trend we see below.
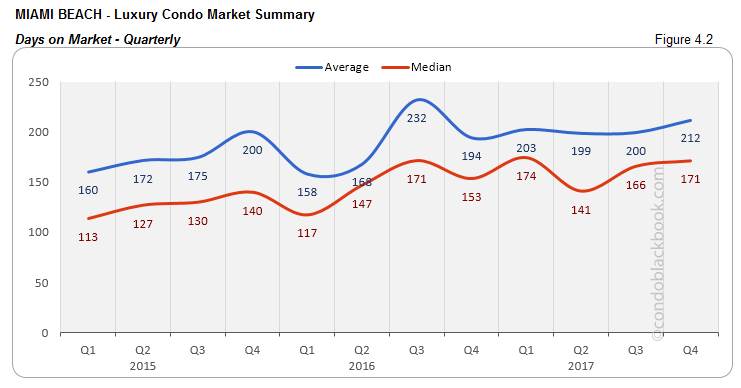
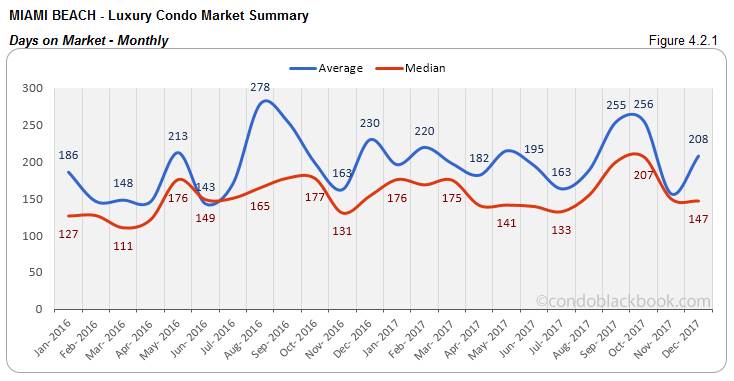
- Annual and quarterly days on market climb, though December posts slight improvement. It’s easy to see the days on market climb steadily in fig. 4.2., which is why 2017 reported a 14% increase in annual numbers. The quarterly median days too went up 3% compared to Q3 and 12% year-over-year. However, December came back with a correction, bringing down the trend by 2% month-on-month and 4% year-over-year (fig. 4.2.1). Hopefully, we get to see a continuation of this decline in 2018.
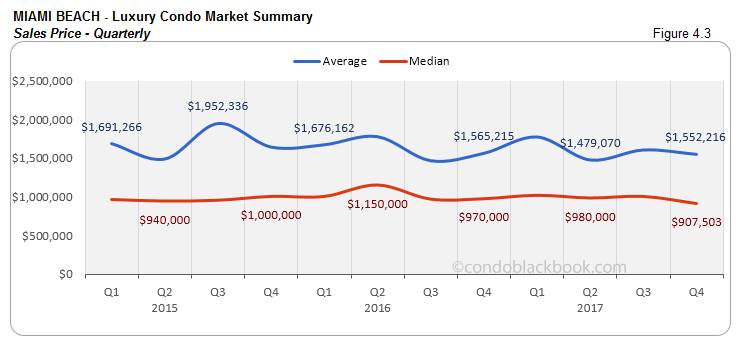
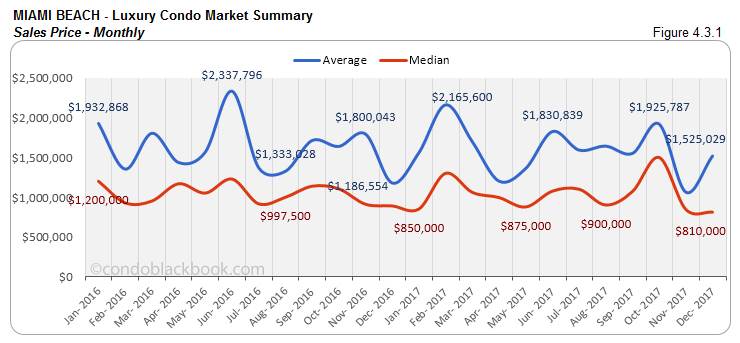
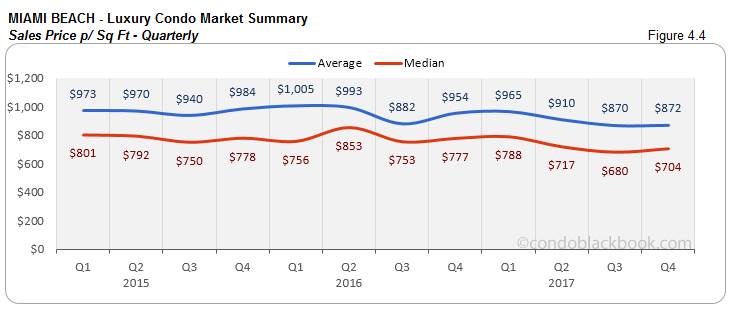
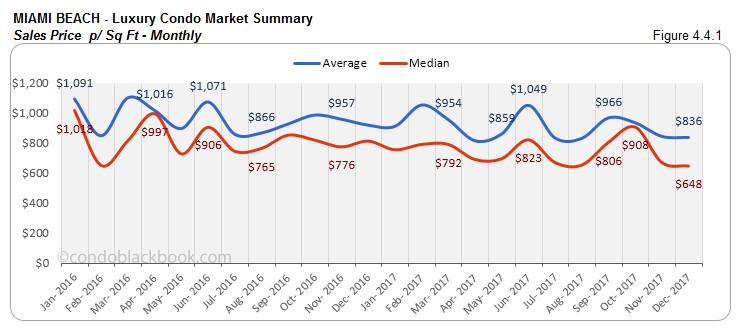
- Annual, quarterly and monthly prices post slight deflation. We see a slight drop in prices for the luxury condo market in Miami Beach. The annual median price came down 1%, with the price per sq. ft. dropping 4%. Also, the median price went down 9% from Q3 and was 6% lower than Q4 2016. Even the price per sq. ft. was 9% lower compared to the same quarter last year. (See fig. 4.3 and 4.4 below.) We further had December posting a decline of 9% in its year-over-year sales price, as the price per sq. ft. dropped 20%. (See fig. 4.3.1 and 4.4.1.)
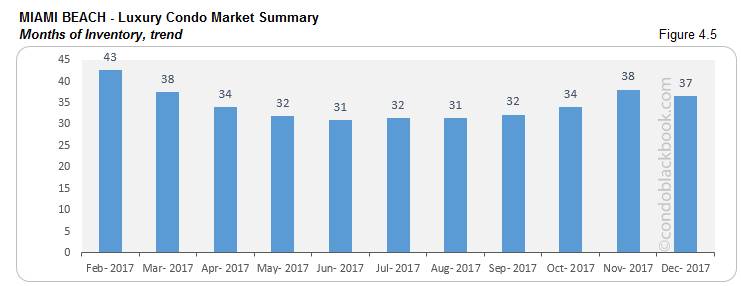
- Inventory drops 4%. Miami Beach reports 37 months of inventory for December below (1236 active listings + 64 pending divided by a 6-month average of 36 deals a month). Still a long way off from the 9-12 month mark of a normal market, buyers should make use of this combination of high inventory and lower prices to go shopping for Miami Beach condos for sale here.
South Beach Luxury Condo Market Summary (33139 zip) back to top
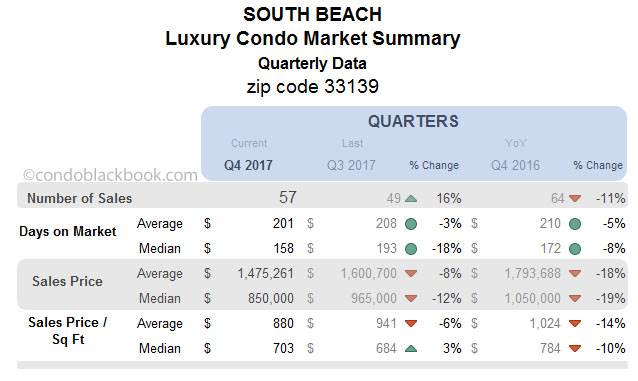
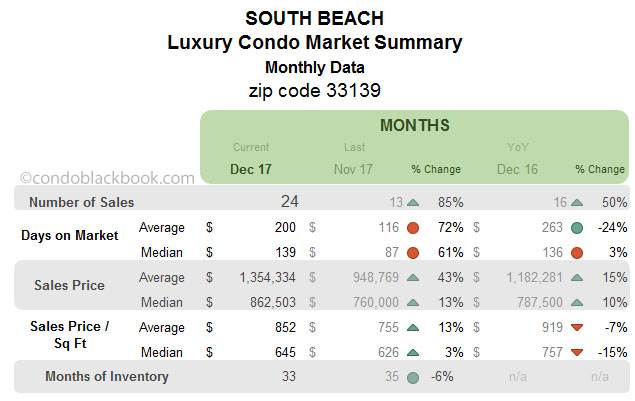
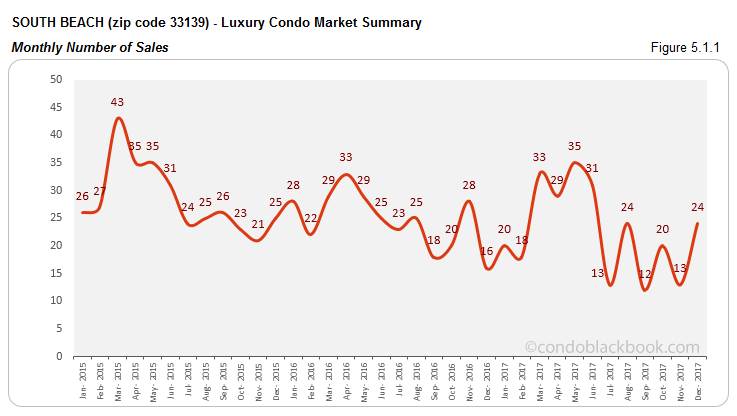
- Monthly sales jump, but quarterly numbers slack. We see a great improvement in the sales numbers for December. Fig. 5.1.1 posts an uptick of 85% over November and 50% over December 2016. However, Q4 fell 11% behind same time last year. A closer look at fig. 5.1 reveals that the quarter was weaker than 2015 and 2016. Nonetheless, if December’s charts are any indication, we hope to see a stronger Q1.
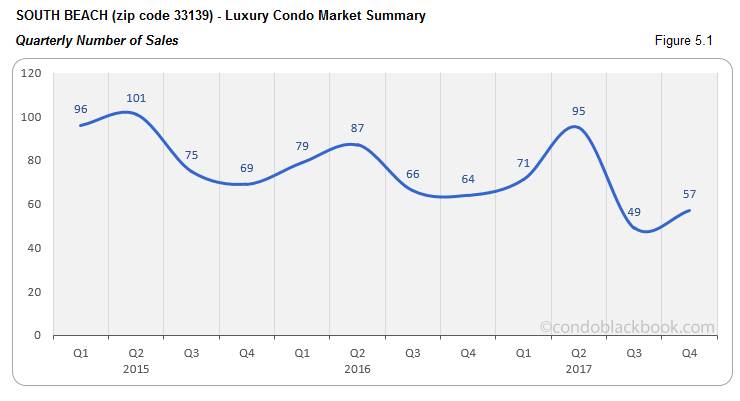
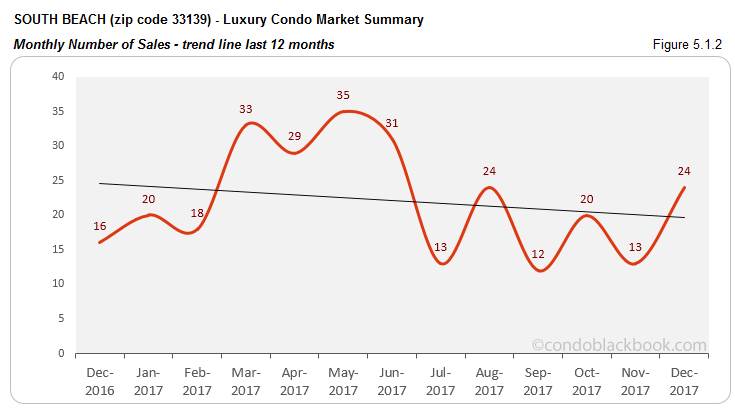
- Trend line takes a dive. Again, spring time’s highs couldn’t keep the 12-month sales trend line below from taking a dive by year-end. Hopefully, we’ll get to see a correction in the upcoming months.
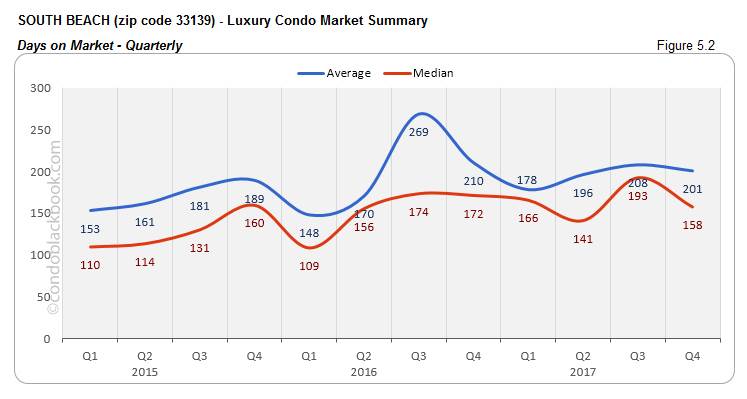
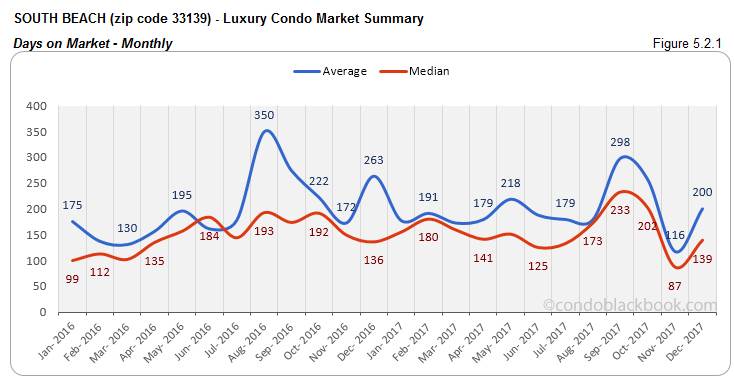
- Quarterly days on market post decline. The last quarter posted a positive trend for the days on market in South Beach. We report an 18% decrease quarter-over-quarter and an 8% decline year-over-year in the median days on market (fig. 5.2).
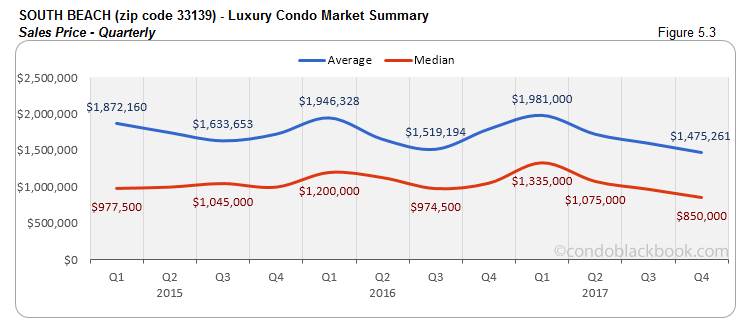
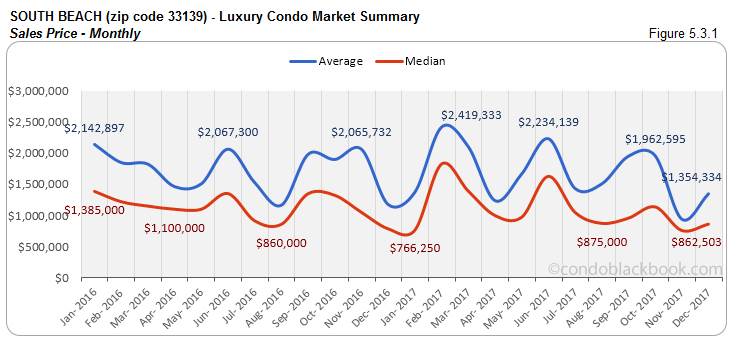
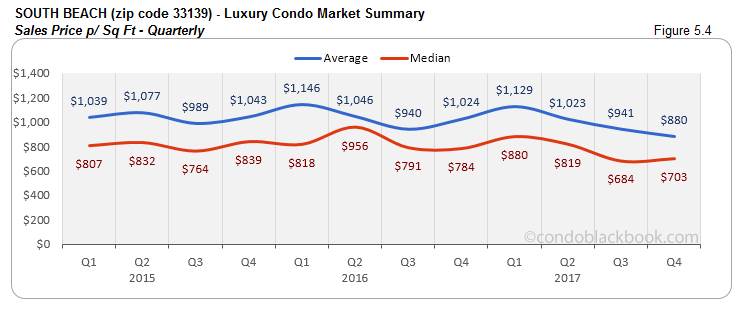
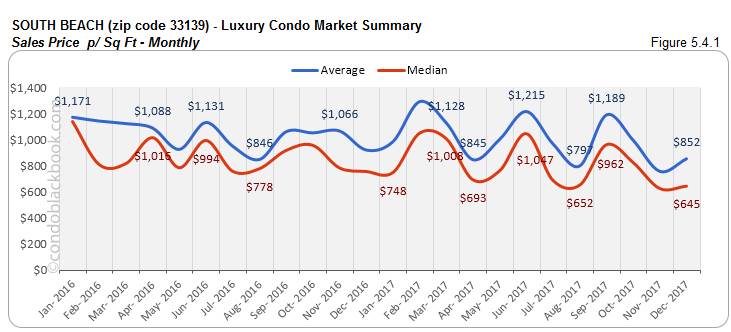
- Quarter posts lower prices, but December posts uptick. We see the prices go down since last quarter in South Beach. The quarterly median sales price dropped 19% year-over-year, with the price per sq. ft. adjusting 10% lower. (See fig. 5.3 and 5.4.) However, in December we again see an increase. This time the median price moves 10% higher than same time last year and 13% higher month-on-month. The price per sq. ft. is also 3% higher in December. (See fig. 5.3.1 and 5.4.1)
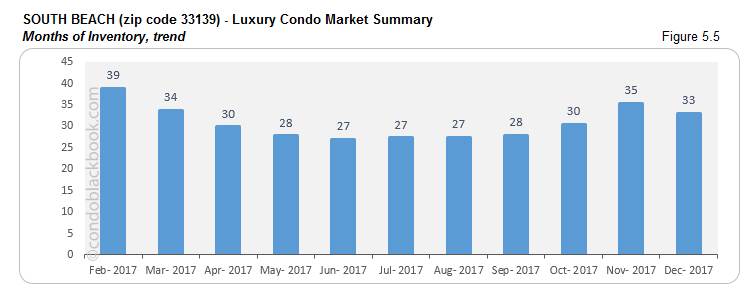
- Inventory decreases 6%. Fig. 5.5 below shows a lower months of inventory at 33 (684 active listings + 27 pending listings divided by a 6-month average of 22 deals a month). In spite of a decline, this is way off the 9-12 month mark of a balanced market. With inventory trends still favoring buyers, people should go shopping for South Beach condos for sale here, or begin by checking out this vacation hotspot here.
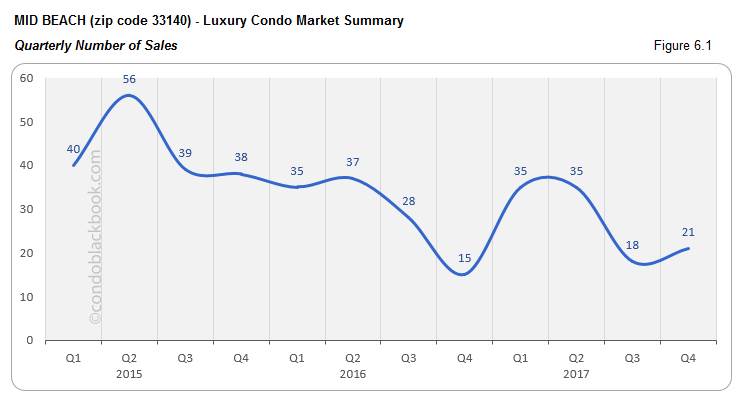
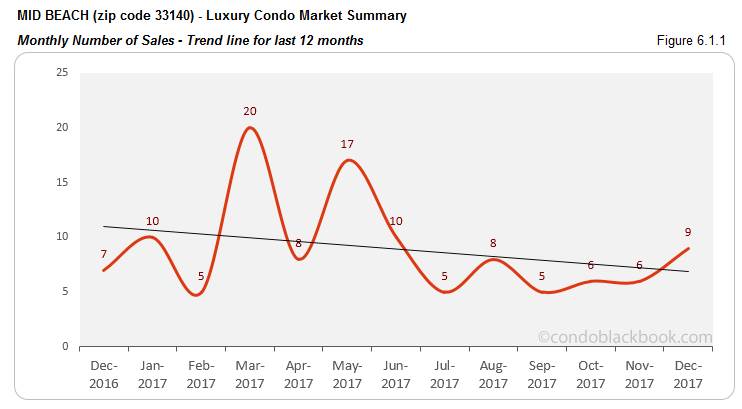
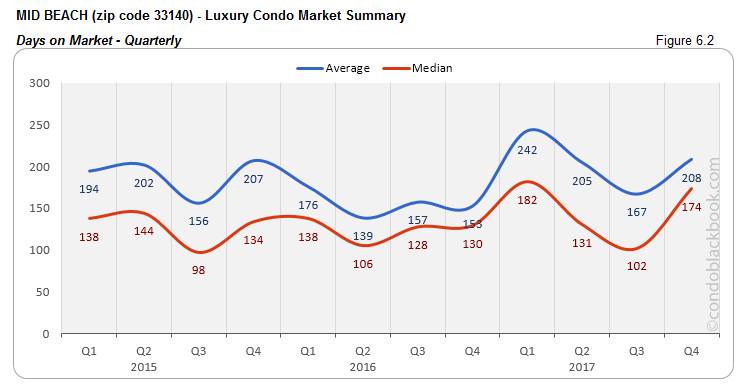
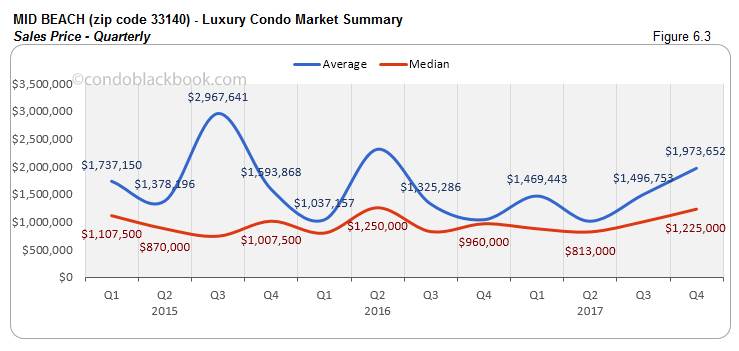
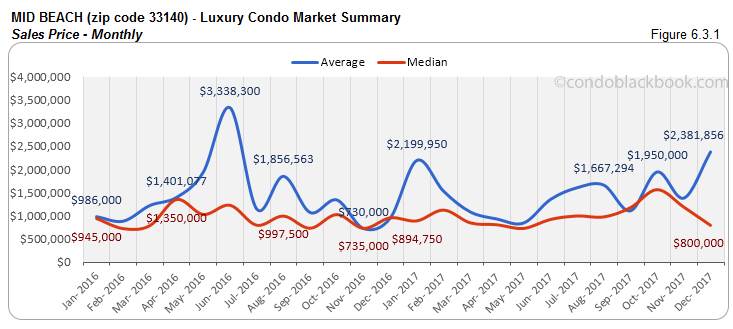
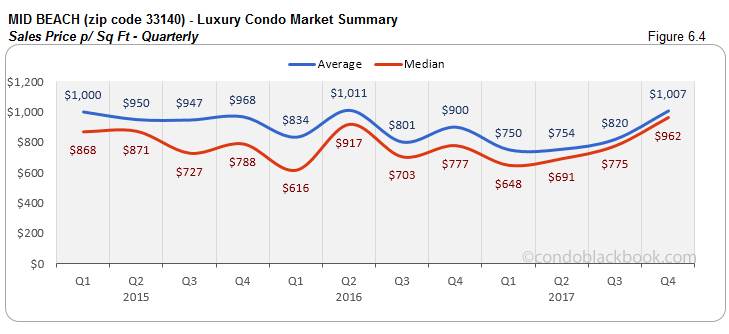
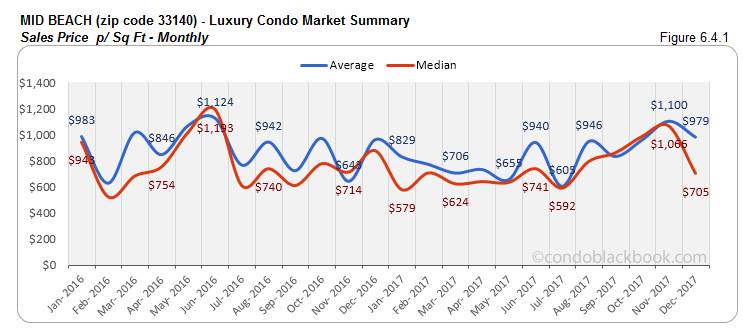
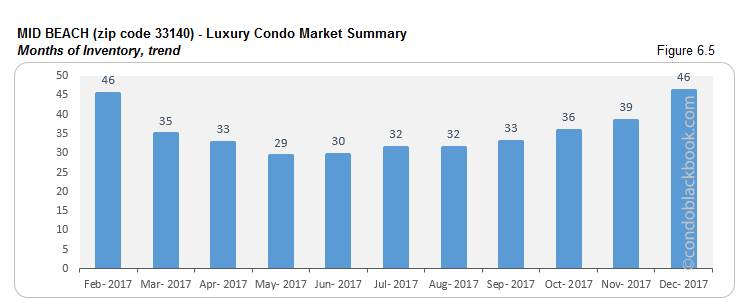
Mid-Beach Luxury Condo Market Summary (33140 zip) back to top
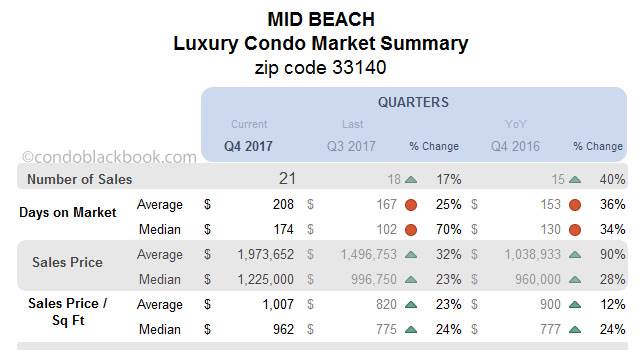
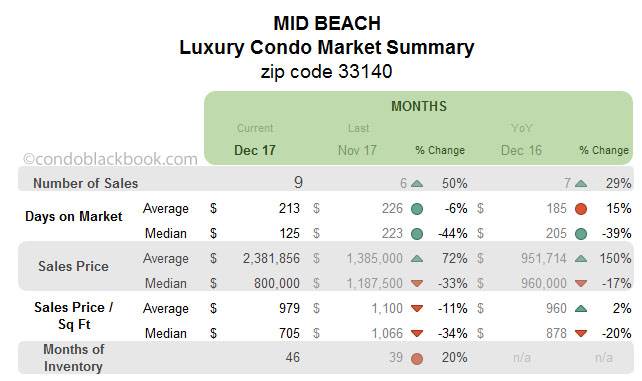
- Quarterly and monthly sales shine with uptick, but trend line dives. Mid-Beach enjoyed good sales momentum this last quarter (fig. 6.1). While sales were up 17% quarter-over-quarter, they significantly rose 40% over Q4 last year. Even December came through with great numbers. The neighborhood reported a 50% month-on-month increase and a 29% hike over 2016 (fig. 6.1.1). However, a good last quarter could not make up for annual volatility, as we see the 12-month trend line decline sharply in fig. 6.1.2 below.
- Days on market increase for last quarter. The last quarter ended with a much higher days on market (fig. 6.2) in Mid-Beach. We see the median days in Q4 70% higher than Q3 and 34% more than Q4 2016. Hopefully, there is a significant correction in this trend in 2018, as we do see signs of an improvement in December below (fig. 6.2.1).
- Quarter ends with higher prices, even as December reports correction. Even with the last two months reporting a drop in prices, we see the quarter end with an overall increase in prices for Mid-Beach. The median sales price is up 28% year-over-year and the price per sq. ft. is 24% higher. (See fig. 6.3 and 6.4 below). On the other hand, December showcases a year-over-year deflation of 17% and 20% in the median price and price per sq. ft. respectively. (See fig. 6.3.1 and 6.4.1 below)
- Months of inventory continue upward trek. Fig. 6.5 below puts the months of inventory for December at 46 (287 active listings + 20 pending listings divided by a 6-month average of 7 deals a month). This is not just 20% higher than November, but also way off the 9-12 months mark of a balanced market. Buyers should take notice and scout for deals on Mid-Beach condos on sale here or begin with a tour around this family-friendly neighborhood here.
Surfside Luxury Condo Market Summary back to top
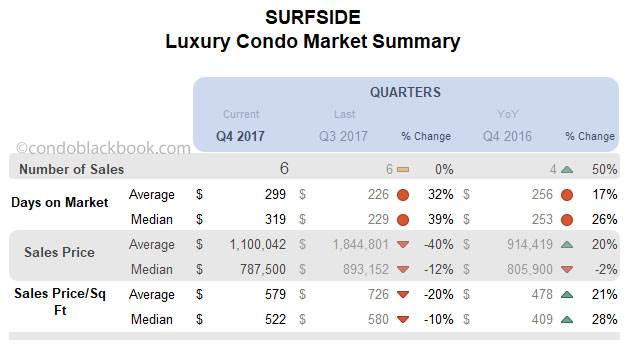
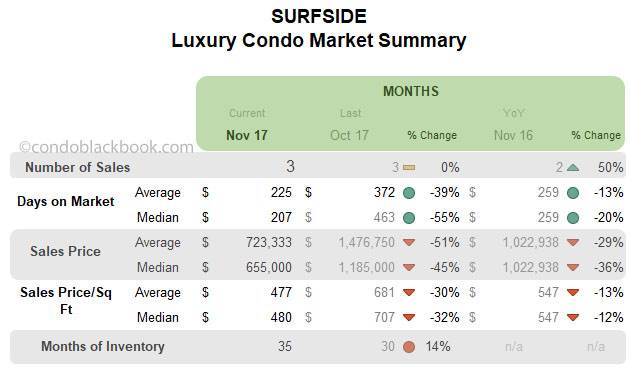
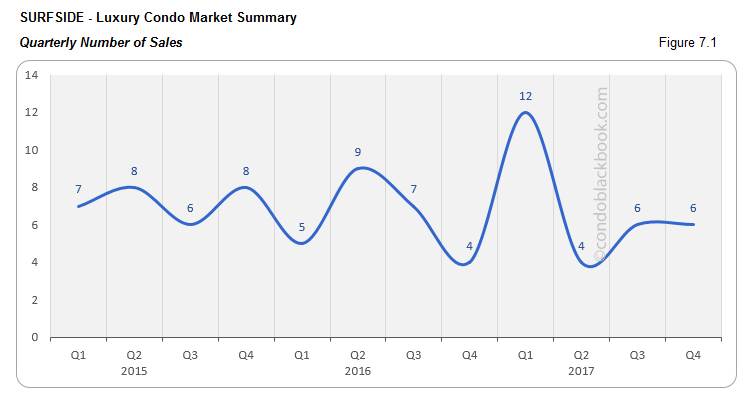
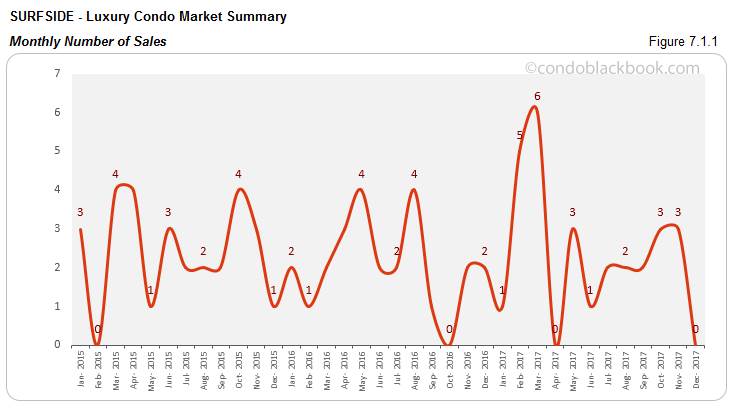
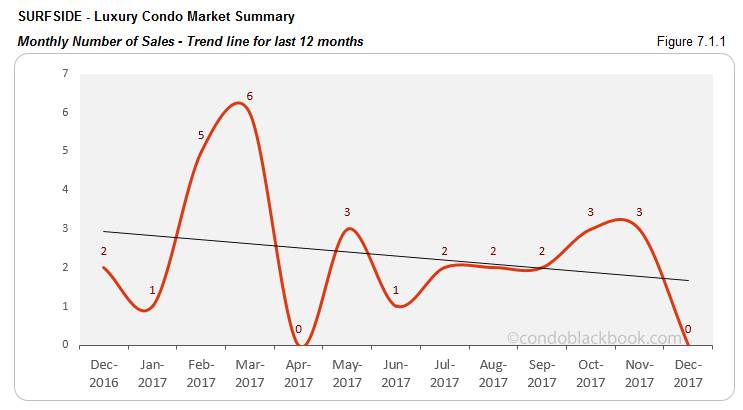
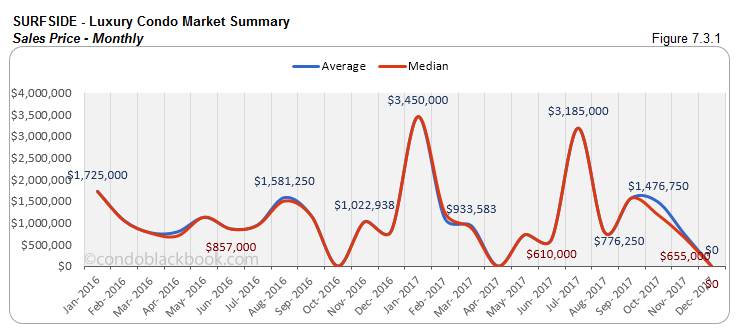
- Quarterly numbers consistent, though zero sales in December make trend line nose dive. Being a modest market for luxury condos in Miami, it is not surprising to see Surfside come up with zero sales below (fig. 7.1.1). This is why we also see the 12-month trend line decline sharply (fig. 7.1.2). However, the last quarter did have some positives to report (fig. 7.1). Q4 matched the sales in Q3 and posted a 50% increase over same quarter last year. It is also worth mentioning that this small market has consistently reported an average of 27 sales for the last 3 years.
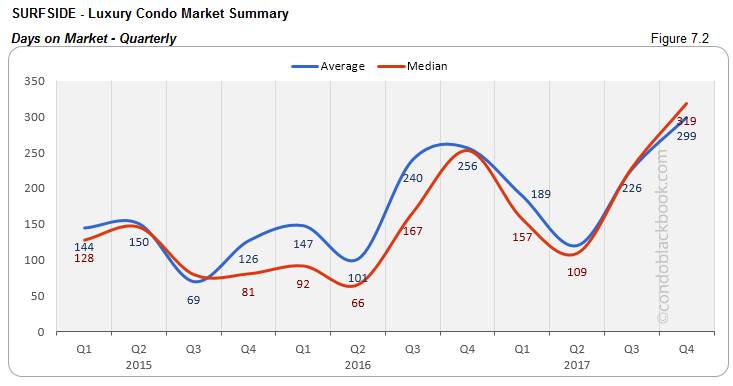
- Quarterly days on market increase. Even with a consistent number of annual sales for the past three years, we do see the days on market increase 26% year-over-year in Q4. There is also a 39% increase in the median days on market compared to Q3. (fig. 7.2)
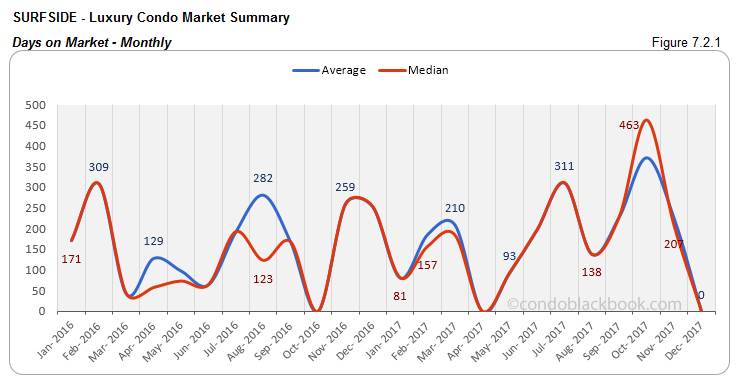
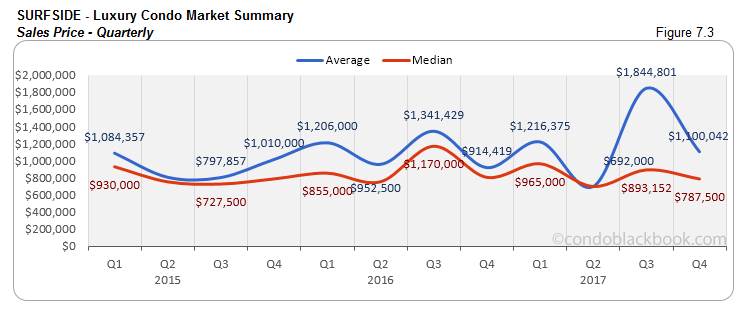
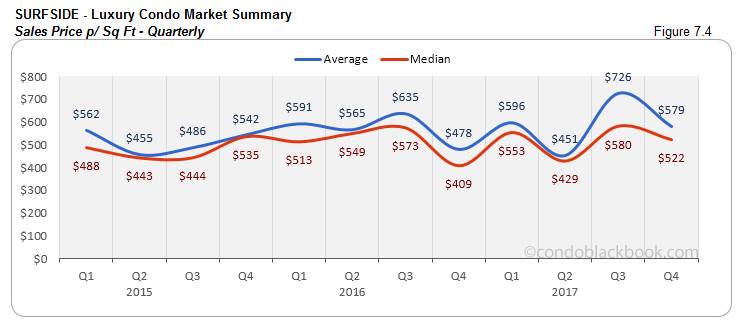
- Quarterly prices decline. Surfside reports a drop in its quarterly prices. Fig. 7.3 shows a 12% drop compared to Q3 and 2% drop year-over-year. Even the price per sq. ft. is 10% lower than Q3 (fig. 7.4). Since there were no sales in December, our summary chart above shows no change since November.
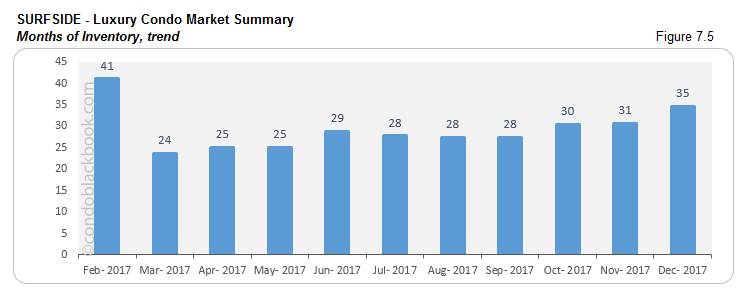
- Months of inventory climbs higher, buyers should go shopping. Fig. 7.5 below reports months of inventory to now be at 35 (72 active listings + 3 pending divided by a 6-month average of 2 deals a month). This is 14% higher than last month and further off the 9-12 months of a balanced market. With zero sales and new additions, buyers should take a cue and search a Surfside condo for sale here, or see what lifestyle makes up the community of Surfside.
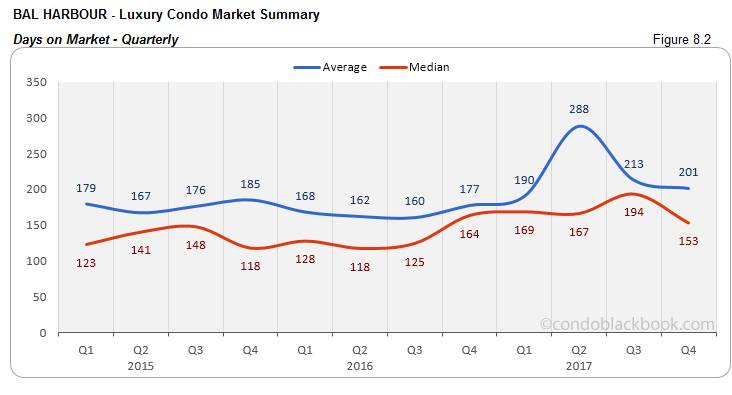
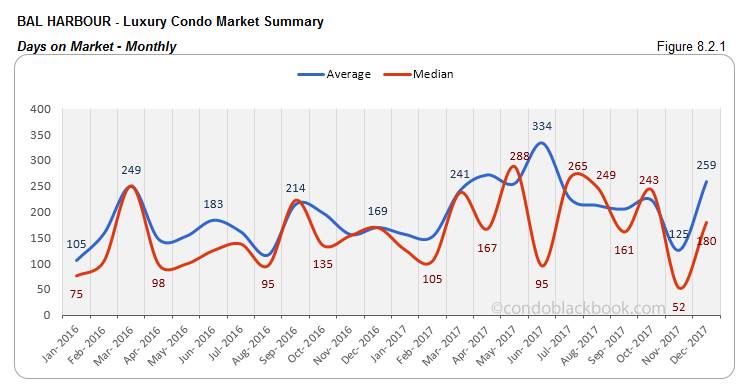
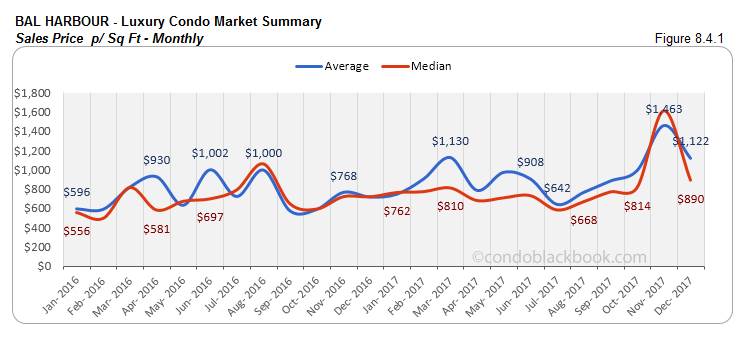
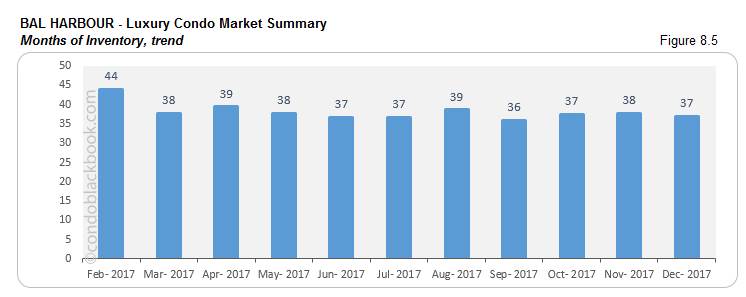
Bal Harbour Luxury Condo Market Summary back to top
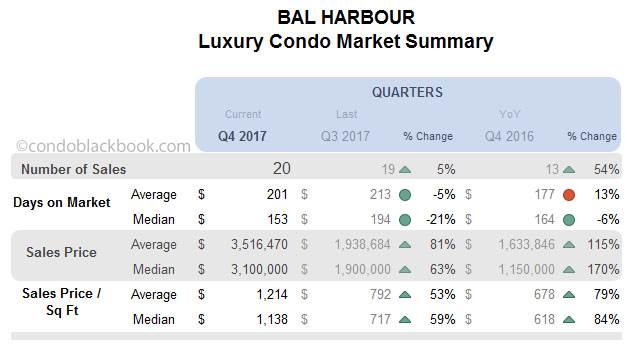
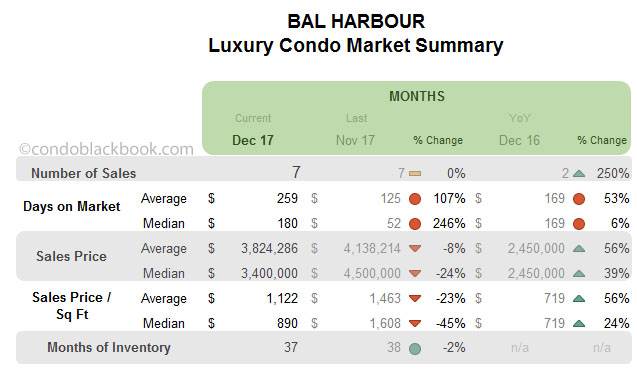
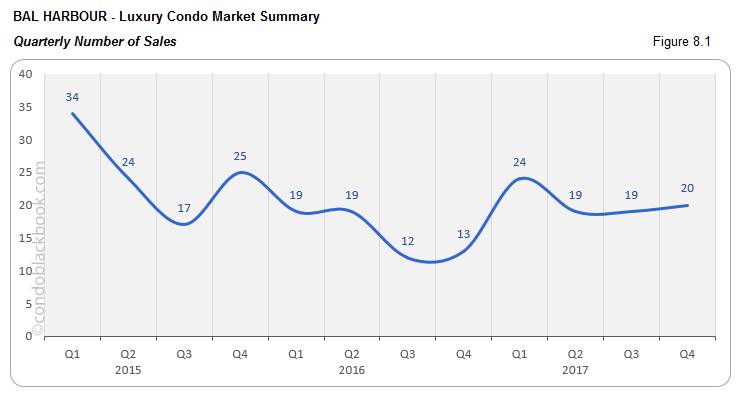
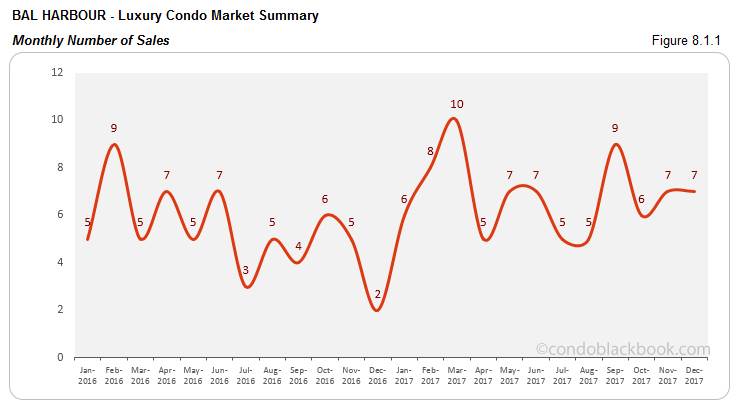
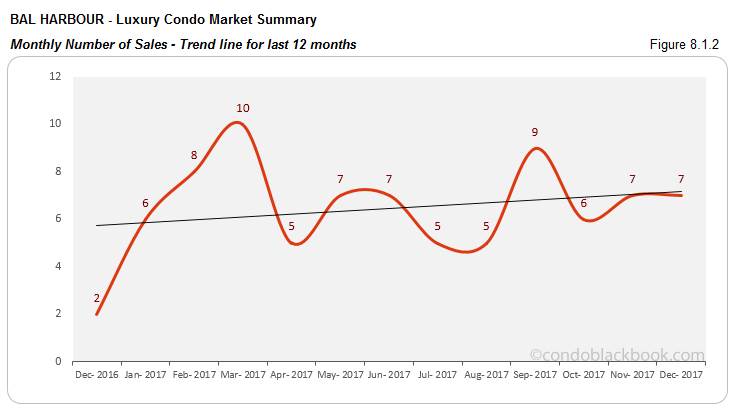
- Growth in quarterly and monthly sales keeps annual trend line positive. Bal Harbour is one of the few neighborhoods in our study to report a positive trend line for the year (fig. 8.1.2). We see the quarterly sales improve 5% over Q3 and 54% year-over-year (fig. 8.1). We also December match November’s performance with a significant increase in sales compared to December 2016 (fig. 8.1.1).
- Days on market pull down for last quarter. Even though we see a significant increase in the monthly days on market in fig. 8.2.1, the quarterly charts report an improvement. The median days on market for Q4 were 21% lower compared to Q3 and 6% lower than same quarter in the previous year.
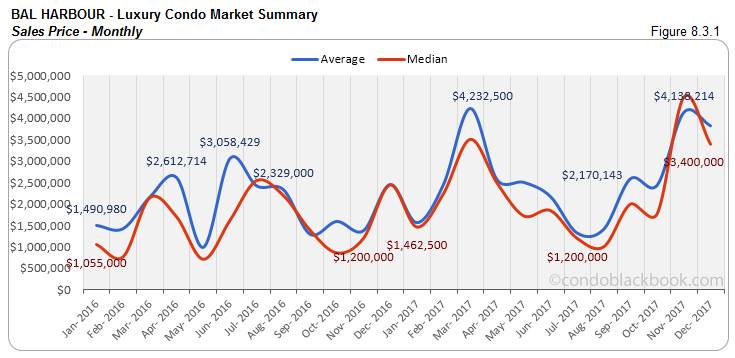
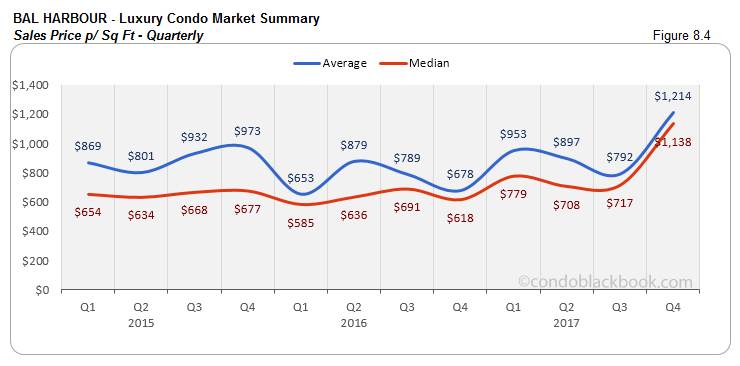
- Ultra-luxury deals fuel price inflation. With almost triple the ultra-luxury sales (above $2 million) in Bal Harbour, we see the price charts report much volatility. While the median price for Q4 inflated 170% compared to same quarter last year, the price per sq. ft. posted an increase of 84%. (See fig. 8.3 and 8.4 below). Also, the price in December came up 39% higher than same time last year, while the price per sq. ft. increased 24%. (See fig. 8.3.1 and 8.4.1 below.)

- Inventory reduces 2%. Fig. 8.5 puts the months of inventory at 37 (233 active listings + 12 pending divided by a 6-month average of 7 deals a month). This is still way off the 9-12 months of a normal market in spite of a decline. With plenty of choices on hand, buyers should look into striking a good deal by searching for Bal Harbour condos for sale here or browse through this upscale neighborhood here.
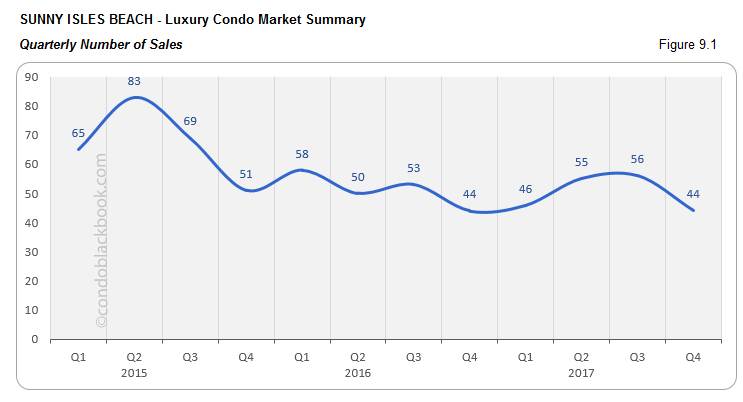
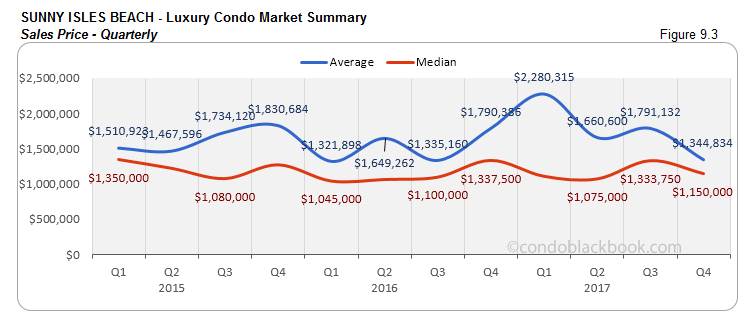
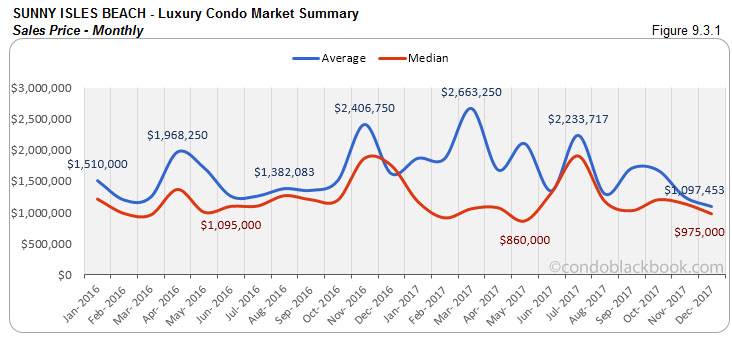
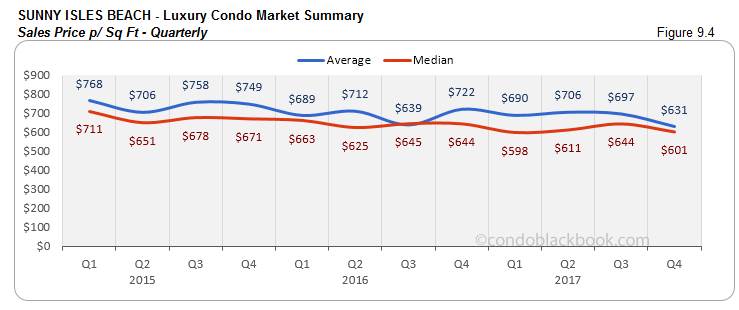
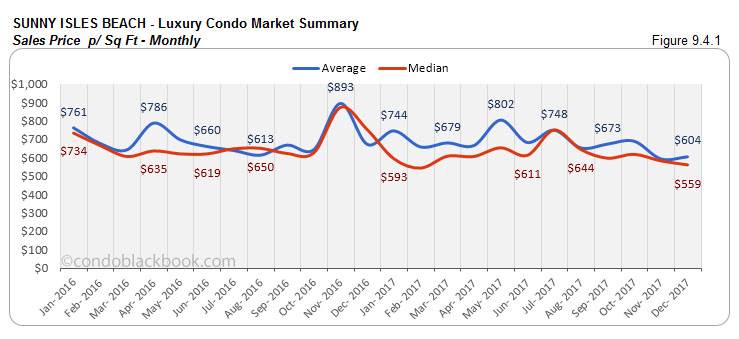
Sunny Isles Beach Luxury Condo Market Summary back to top
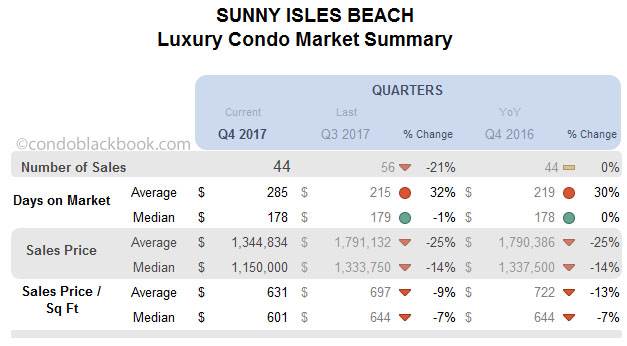
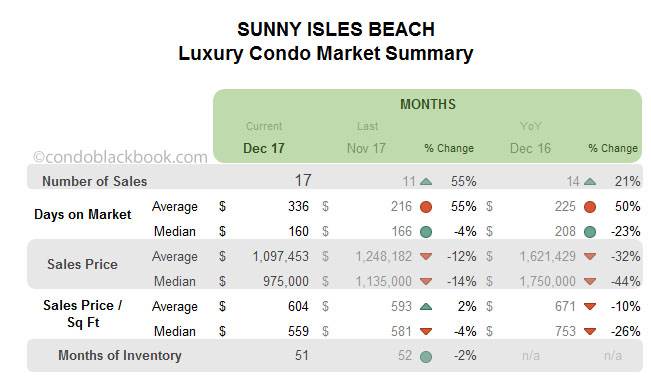
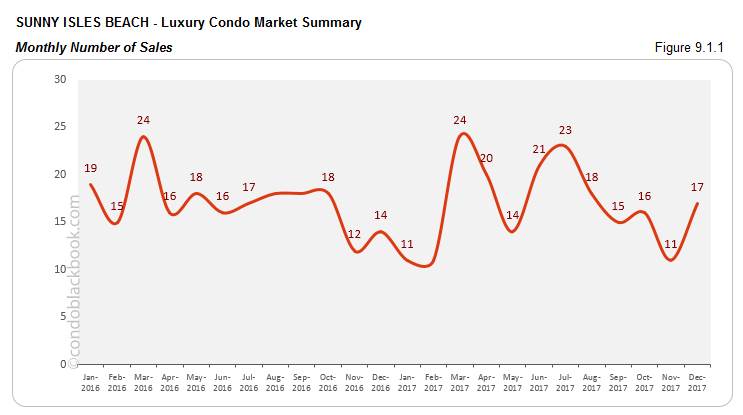
- Monthly sales impress, quarterly sales hover with positive trend line. December posts an increase of 55% month-on-month and 21% year-over-year (fig. 9.1.1). Though Q4 matched sales in 2016, it registered 21% lower sales compared to Q3 (fig. 9.1). Talking about yearly figures, 2017 posted a 2% reduction in sales compared to 2016 and 25% lower than 2015. Even with a lot of catching up to do, this sunny neighborhood managed to keep its annual trend line positive (fig. 9.1.2).

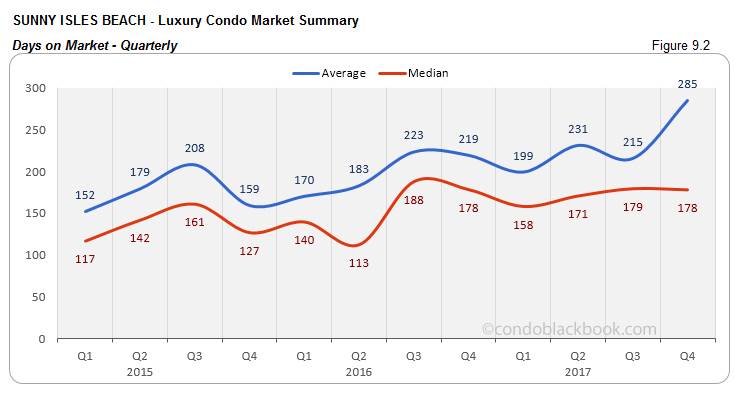
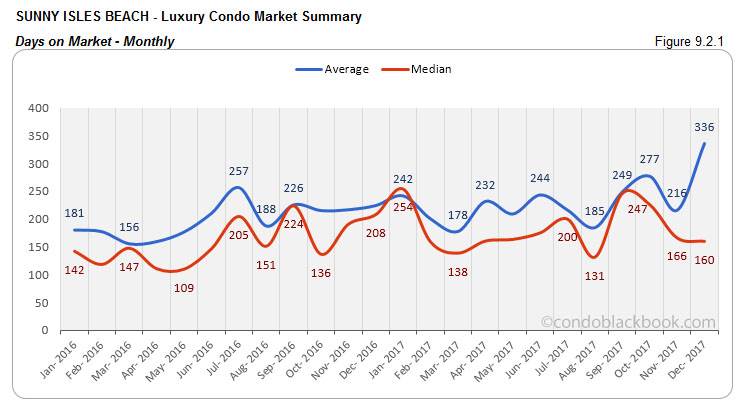
- Days on market drop marginally. A positive for the neighborhood, we see the days on market drop 4% month-on-month and 23% year-over-year in December (fig. 9.2.1). Even the median days in Q4 were 1% lower compared to Q3 (fig. 9.2).
- Quarterly and monthly prices post reduction. This branded condo corridor saw a decrease in both its quarterly and monthly prices. We see a 14% year-over-year decline in the median price for Q4, and a 7% decline in the price per sq. ft. (fig. 9.3 and 9.4). Even the monthly price came down 44% year-over-year, with the price per sq. ft. reducing 26% (fig. 9.3.1 and fig. 9.4.1).
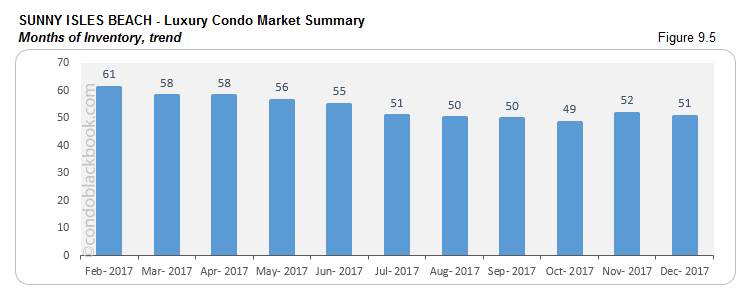
- Months of inventory down 2%. Fig. 9.5 reports a lower months of inventory at 51 (834 active listings + 20 pending divided by a 6-month average of 17 deals a month). In spite of a reduction, this is way off the 9-12 month mark of a balanced market. This means buyers still have the edge and can take advantage of lower prices by searching Sunny Isles Beach condos for sale here, or can explore the lifestyle of this branded condo corridor here.
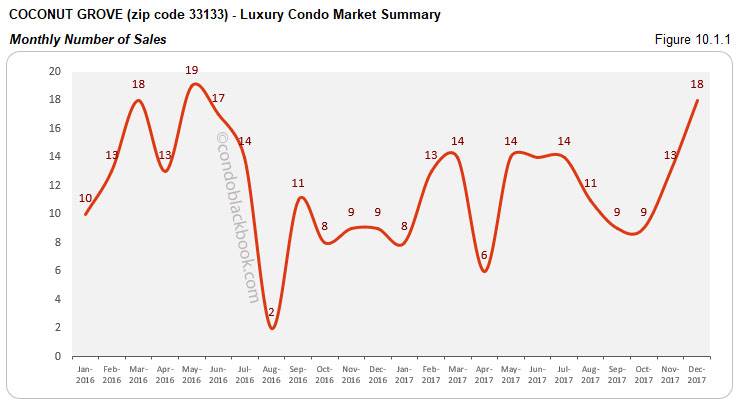
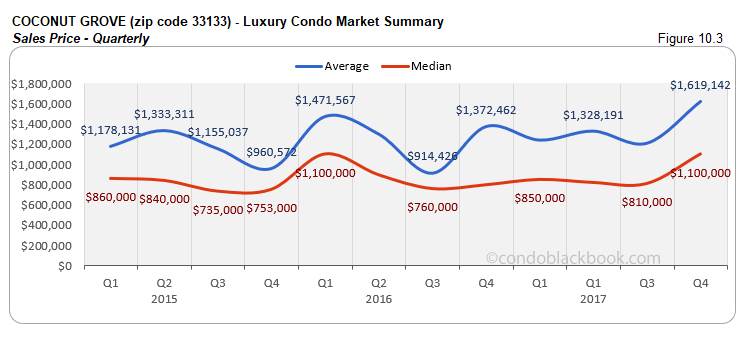
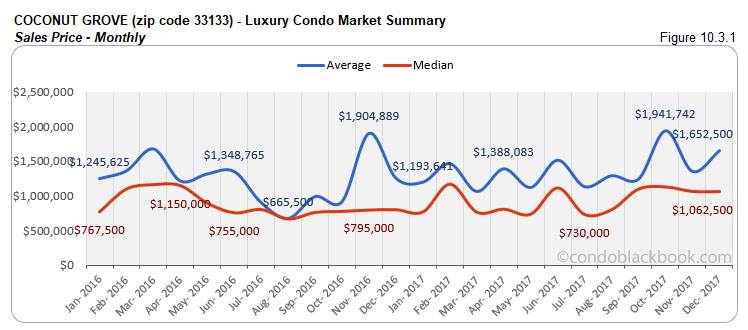
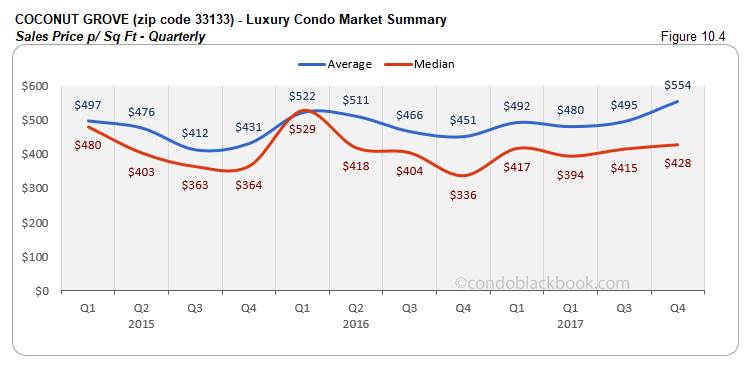
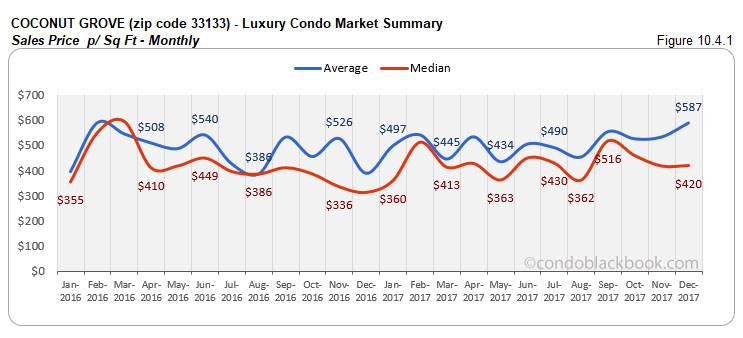
Coconut Grove Luxury Condo Market Summary (33133 zip) back to top
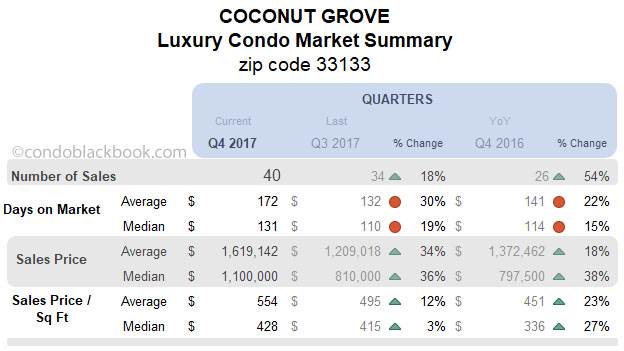
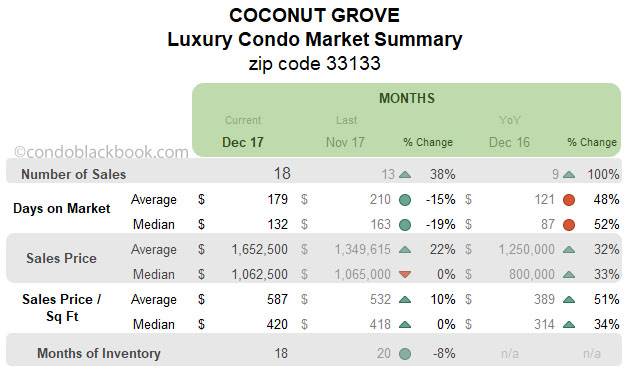
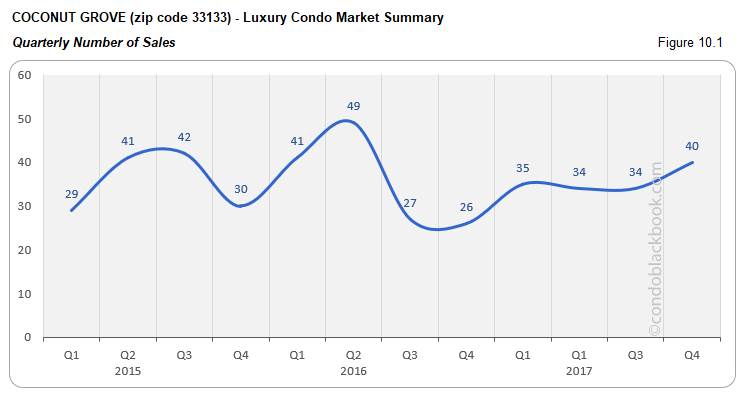
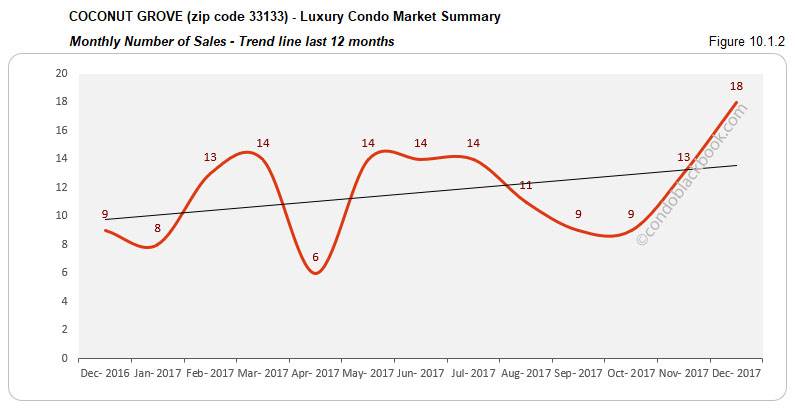
- Quarterly and monthly sales soar with positive trend line. Coconut Grove has played the early bird of recovery throughout 2017 in our study, which is reflected by its soaring annual trend line (fig. 10.1.2). It also posts some great sales for Q4 and December. We see an increase of 18% over Q3 and 54% increase over Q4 2016 (fig. 10.1). There is also a 38% month-on-month and 100% year-over-year increase to report (fig. 10.1.1). Speaking of annual numbers, the vibrant neighborhood has been consistently averaging 143 sales per year for the past three years.
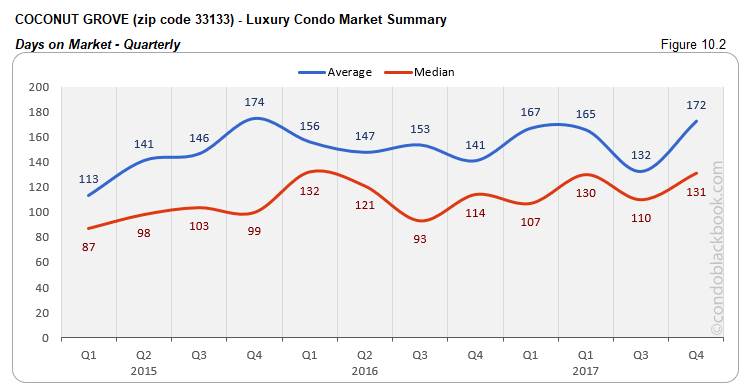
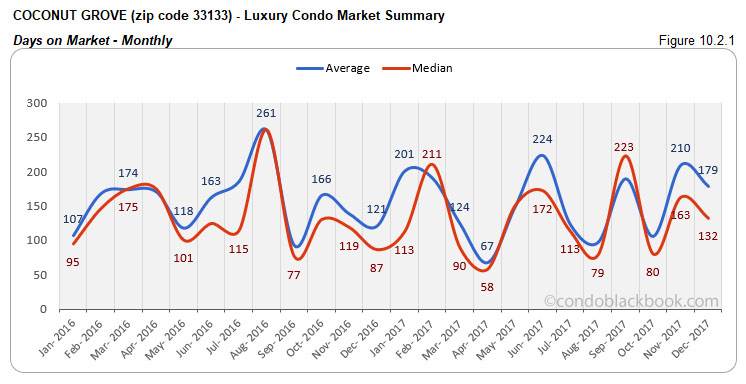
- Q4 posts higher days on market. We see an increase of 19% over Q3 and 15% over Q4 2016 in the median days on market for luxury condos in Coconut Grove (fig. 10.2). Even December posts a 52% year-over-year increase in the median days (fig. 10.2.1).
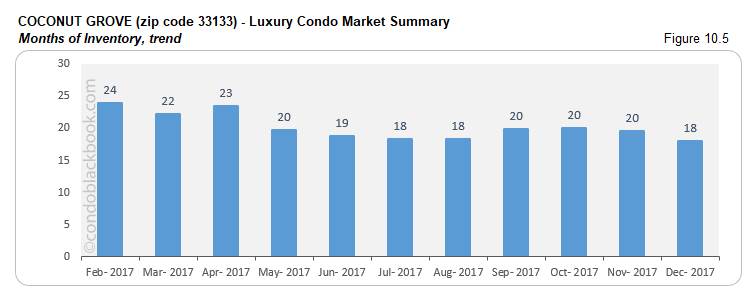
- Inventory reduces 8%. Fig. 10.5 shows 18 months of inventory on the market for the fastest selling district in our study (215 active listings + 24 pending divided by a 6-month average of 13 deals a month). Closest to reaching the ideal 9-12 months of inventory, buyers should hurry and look at what’s new by searching Coconut Grove condos for sale here, or check out what lifestyle makes this the fastest selling neighborhood here.
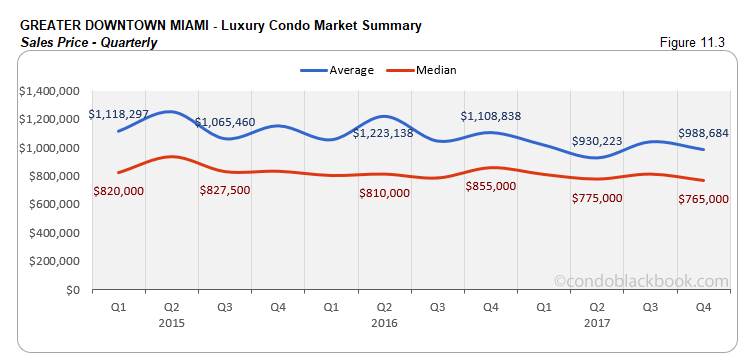
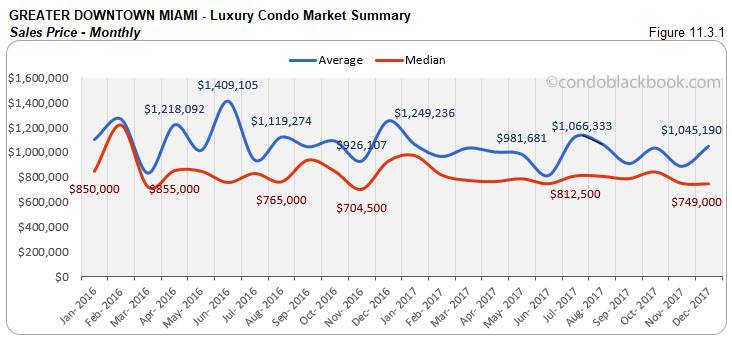
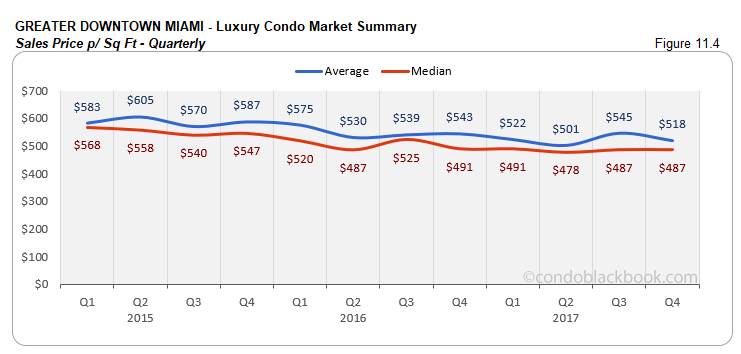
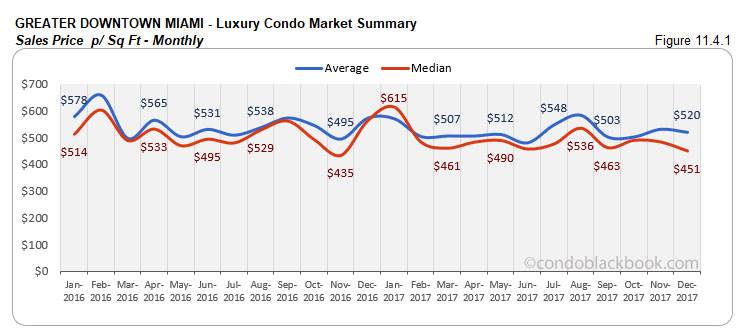
Greater Downtown Miami Luxury Condo Market Summary (33129, 33130, 33131, 33136, 33137 zips) back to top
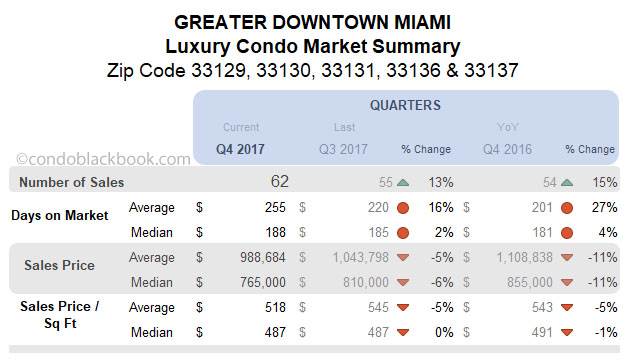
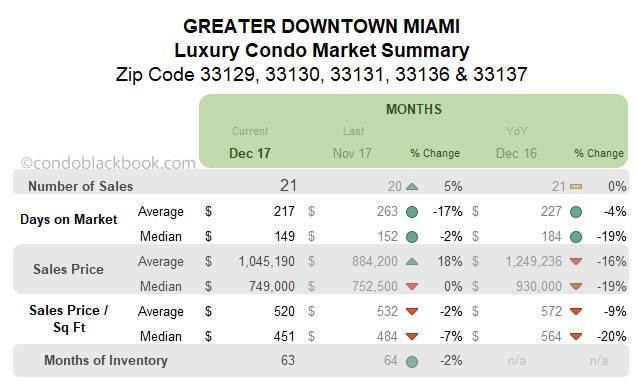
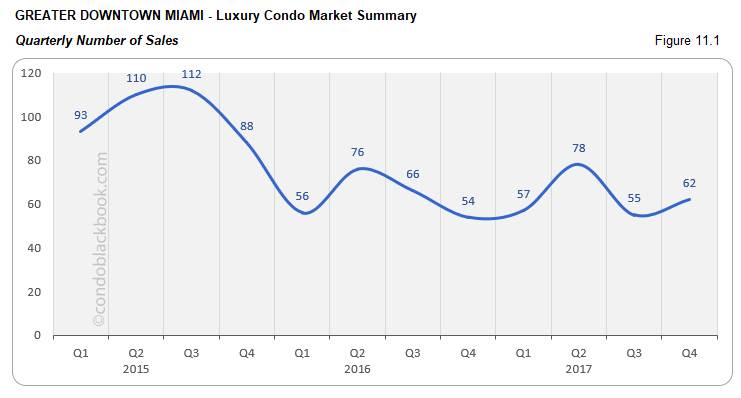
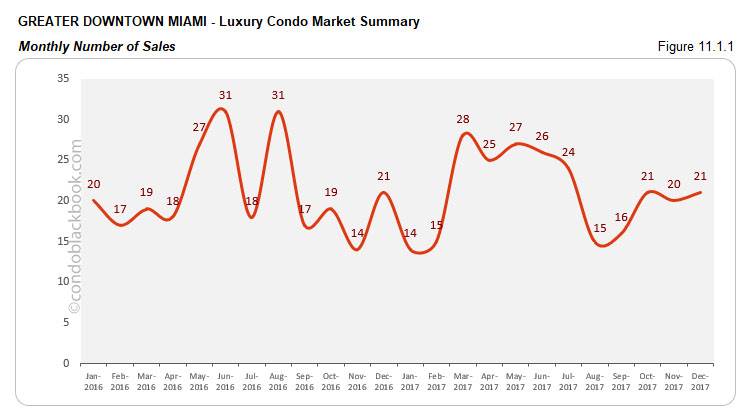
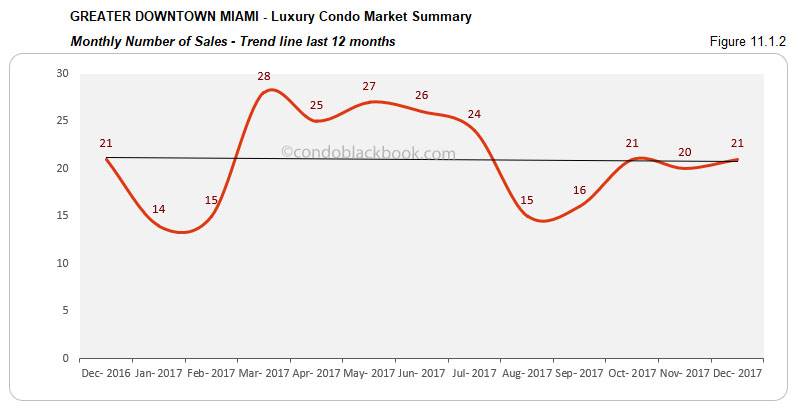
- Quarterly and monthly sales improve, trend line hovers. Annually, 2017 matched 2016’s 252 sales, while lagging 37% behind 2015. Nonetheless, the last quarter picked up pace for the Greater Downtown Miami area. Q4 posted a 13% increase over Q3 and 15% increase over the same quarter in 2016 (fig. 11.1). Talking about December, the month matched its performance from last year and posted a 5% improvement since November (fig. 11.1.1). However, even after this improvement, we get to see a slightly downward tilt in the 12-month trend line below (fig. 11.1.2).
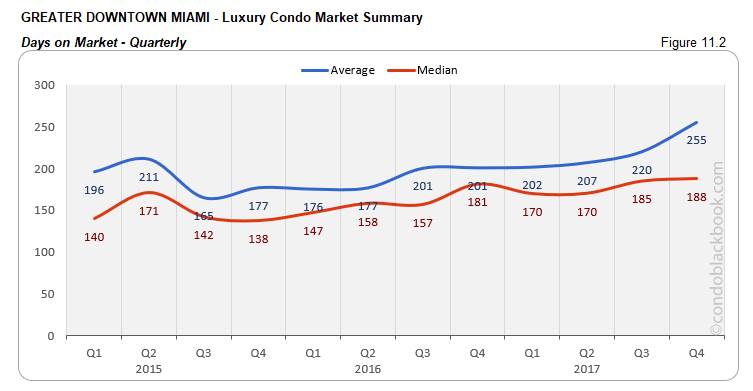
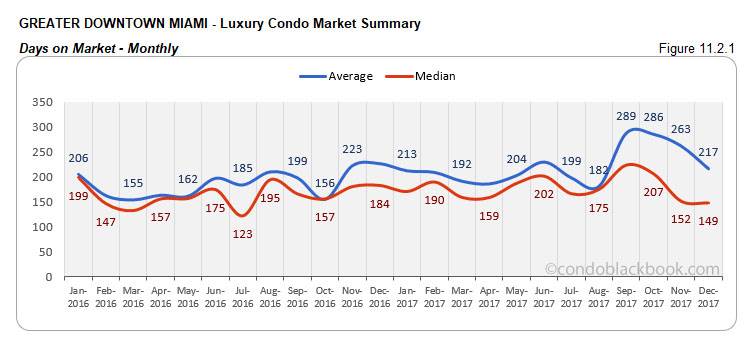
Quarter reports higher days on market, monthly data shows improvement. We see Q4 post a 2% quarter-over-quarter and 4% year-over-year increase in the median days on market (fig. 11.2). But, December came in with a correction of 19% in the year-over-year median days (fig. 11.2.1). Hopefully, this positive trend continues into 2018 for the dynamic district.
- Prices drop for the last quarter and month. Much to the delight of buyers, Greater Downtown Miami reported an 11% decline in its year-over-year median price (fig. 11.3). Even the year-over-year median for December was 19% lower (fig. 11.3.1). The quarter and month’s price per sq. ft. hovered around Q3 and November’s numbers (see fig. 11.4 and 11.4.1).
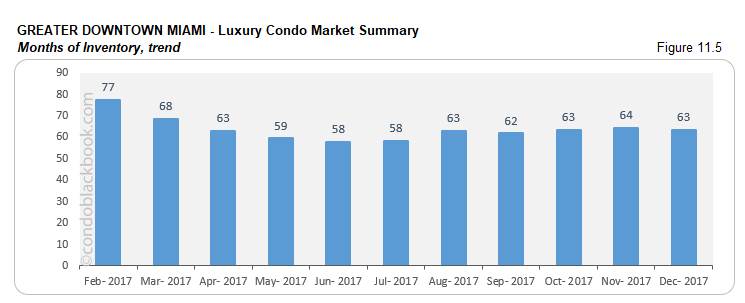
- Months of inventory reduce by 2%. Fig. 11.5 shows a lower months of inventory at 63 (1311 active listings + 32 pending divided by a 6-month average of 21 deals a month). Even after a reduction, this is one of the highest inventories in our study and way off the 9-12 month mark of a normal market. This opens up a big window for buyers to look for deals in the Greater Downtown Miami area here.
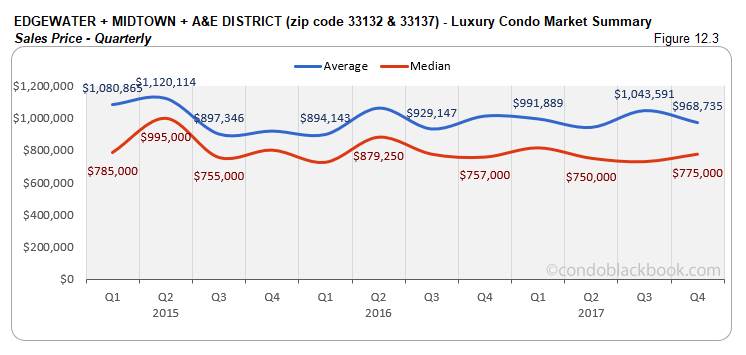
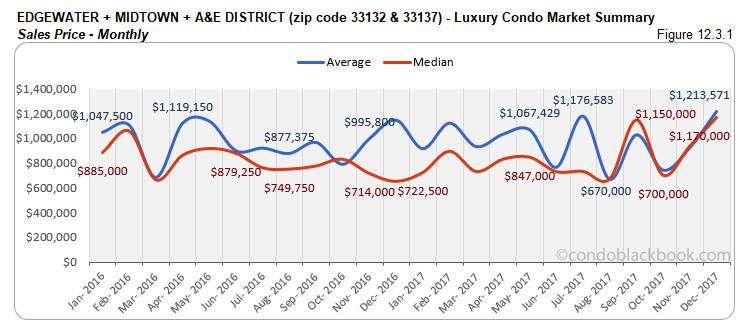
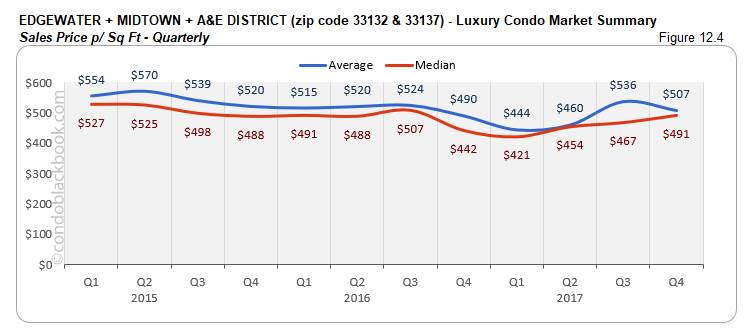
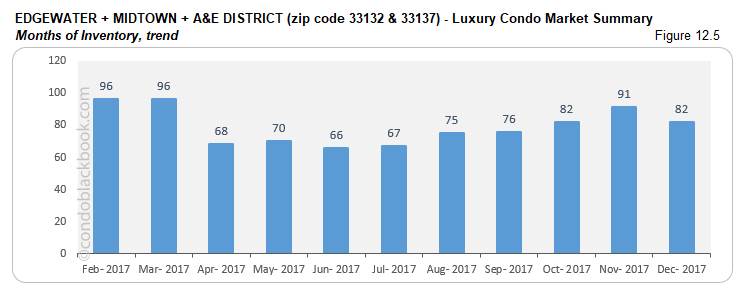
Edgewater + Midtown + A&E District Luxury Condo Market Summary (33132 + 33137 zip) back to top
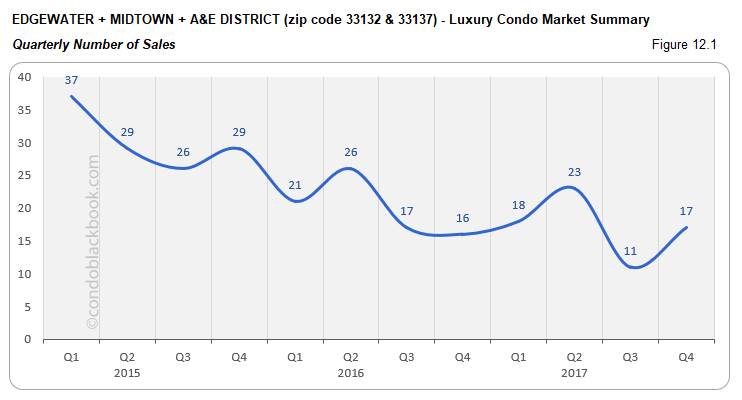
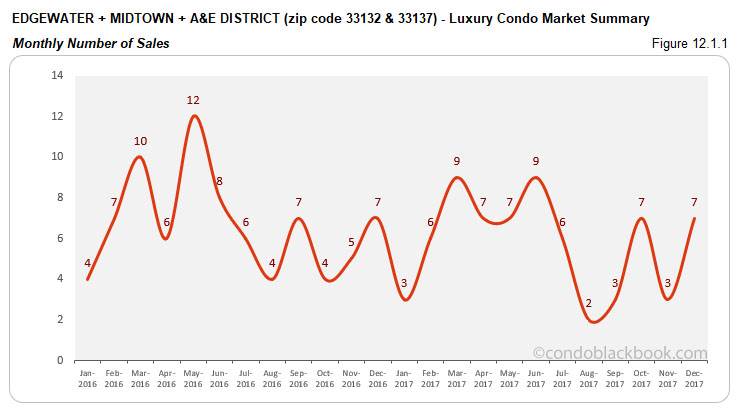
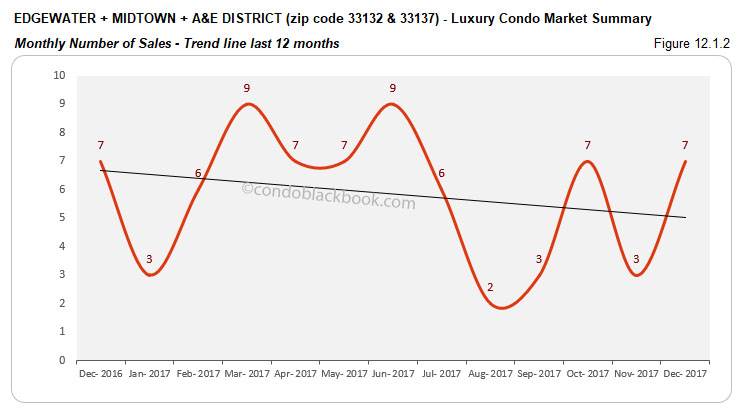
- Quarterly and monthly sales positive, but negative trend line captures slower market. Looking into annual figures, our study reveals 2017’s sales to be 14% below 2016 and 43% below 2015. This negative position also shows up in the decline seen in the 12-month trend line tracing sales (fig.12.1.2).
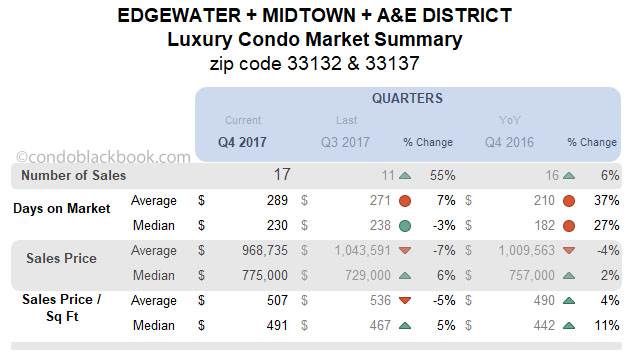
On the other hand, we have Q4 reporting an uptick of 55% over Q3 and 6% increase year-over-year (fig. 12.1). With December’s sales also comparing to those of 2016 (fig. 12.1.1), we hope to see this grouping fare better in 2018.
- Quarterly prices post slight uptick. The prices in this last quarter closed with a slight increase for the grouping. We see a 6% uptick in the median price over last quarter and a 2% increase over Q4 last year. (See fig. 12.3 below.) Even the median price per sq. ft. closed 5% higher than Q3 and 11% more than last year. (See fig. 12.4 below.) Some of the higher prices are coming from resales of newer, more expensive condos. December went ahead to post some volatility clearly visible in fig. 12.3.1 and 12.4.1 below.
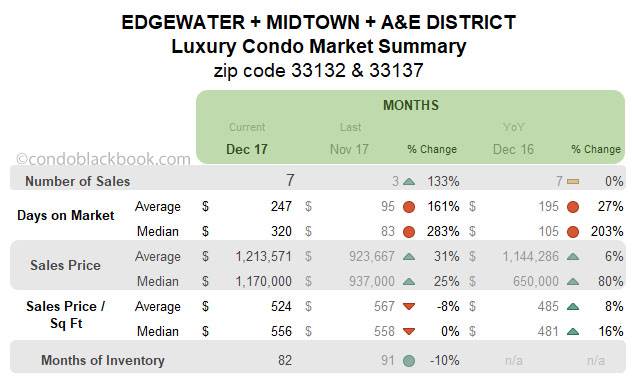
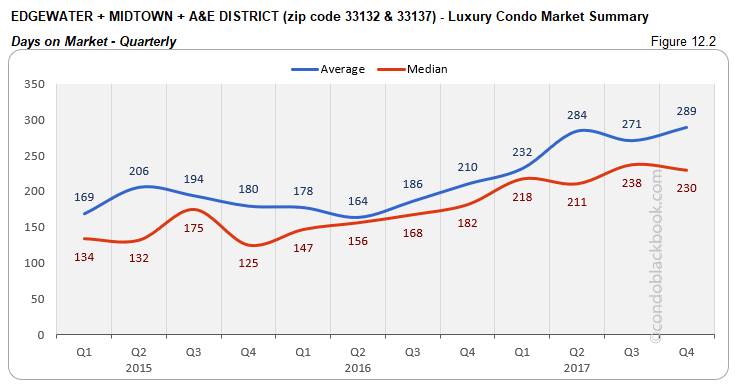
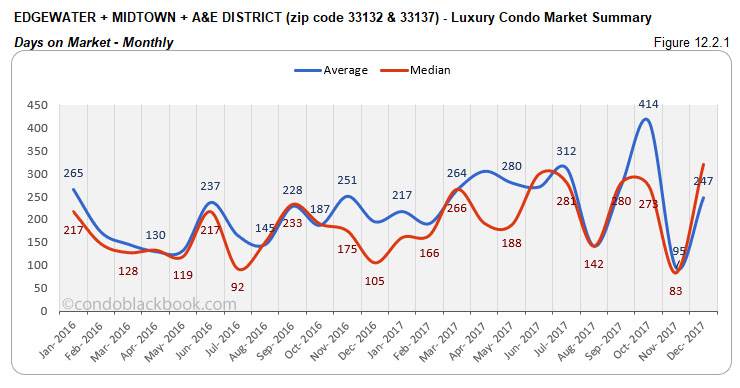
- Months of inventory decrease 10%. Fig. 12.5 puts the months of inventory at 82 (439 active listings + 11 pending divided by a 6-month average of 6 deals a month). Though this is 10% lower than November, it is still way off the 9-12 months of a balanced market. Being one of the slowest moving districts in our study, buyers would definitely hold the advantage as they search for Edgewater condos for sale here or see the individual lifestyle and condo options in Edgewater, Midtown and Arts & Entertainment District.
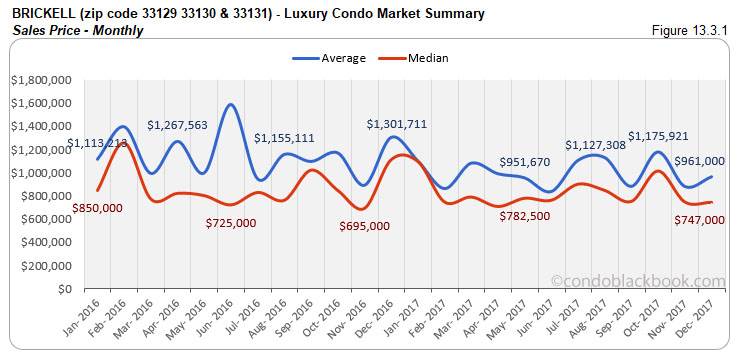
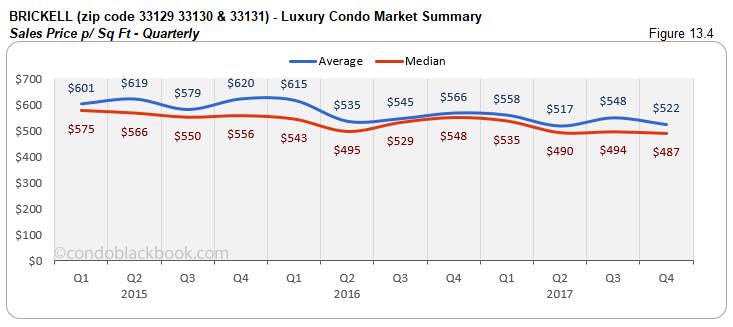
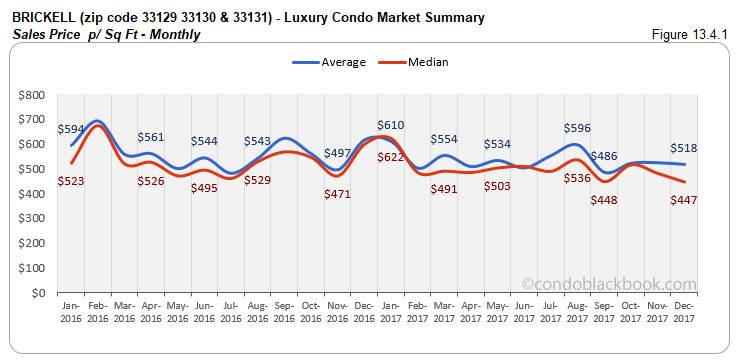
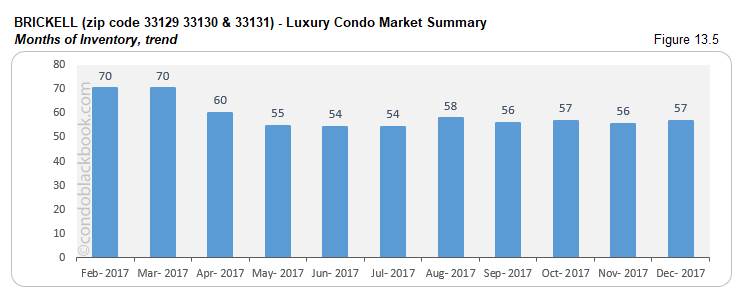
Brickell Luxury Condo Market Summary (33129, 33130, 33131 zip) back to top
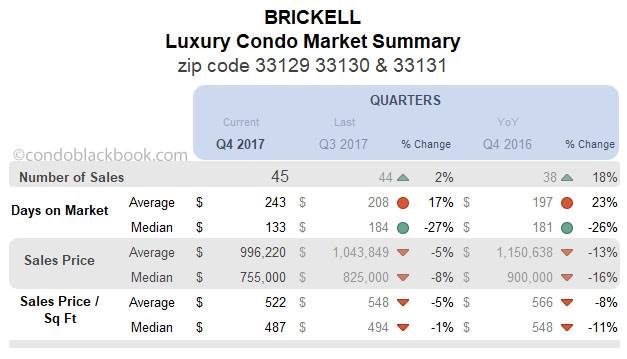
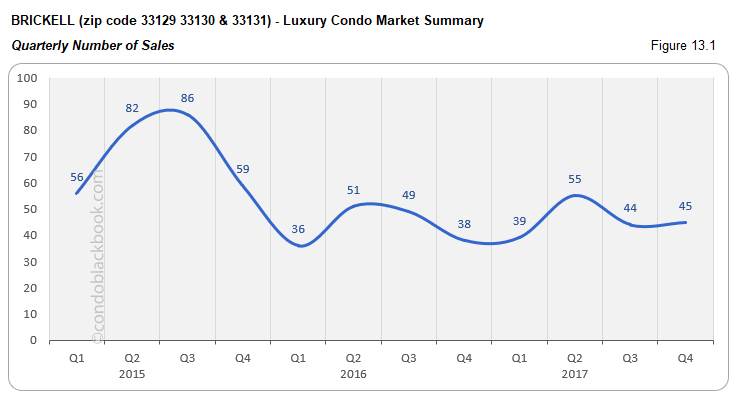
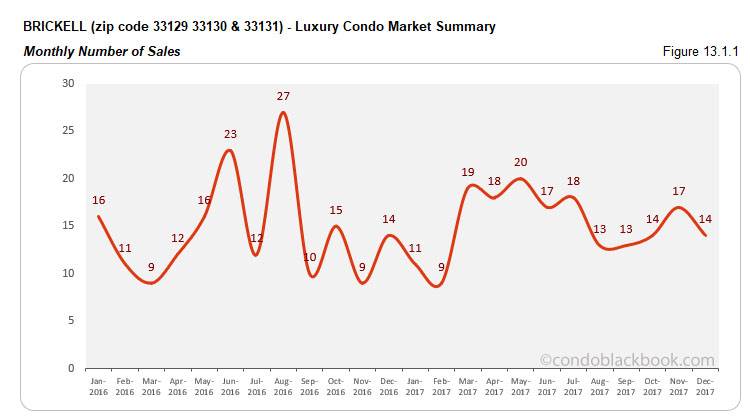
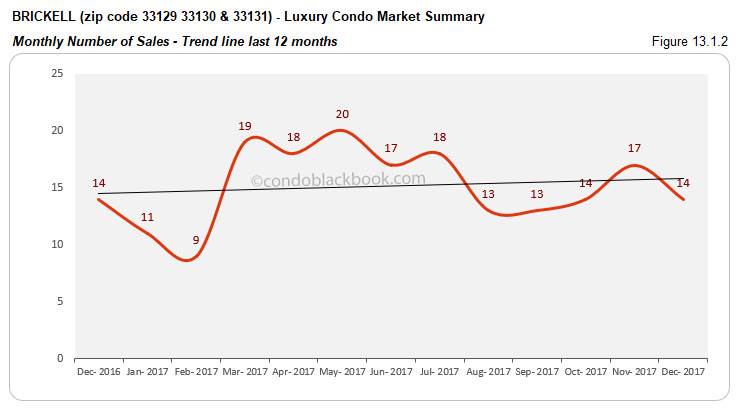
- Quarterly sales improve keeping trend line positive. Brickell recorded 5% more sales in 2017 compared to 2016, but still fell 35% short of 2015’s numbers. Nonetheless, the quarterly metrics kept hopes high by reporting an 18% year-over-year increase (fig. 13.1). This positivity further helps keep the 12-month trend line we see in fig. 13.1.2 afloat and directed upwards by year end.
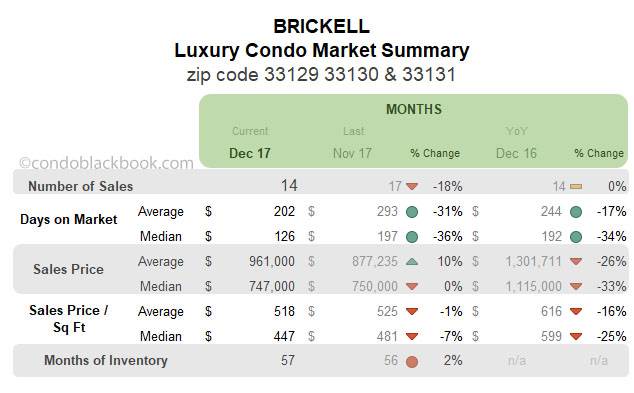
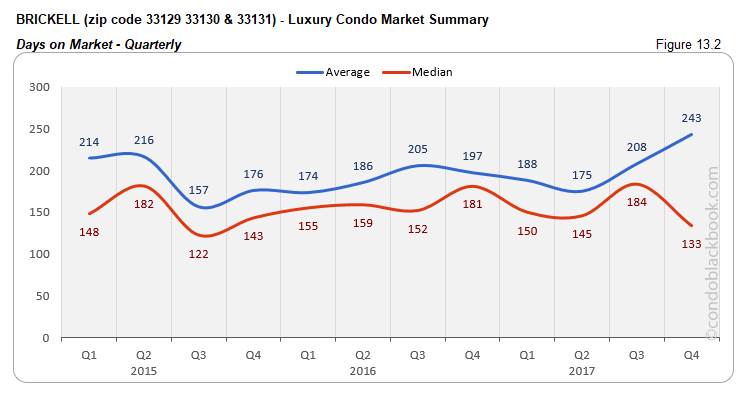
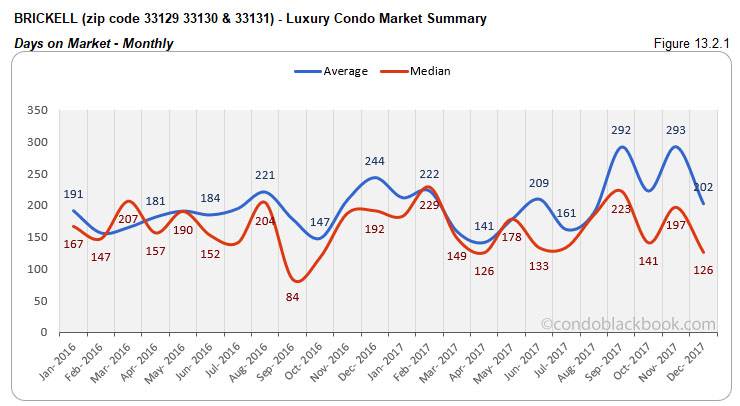
- Quarterly and monthly days on market decline. Another positive for this neighborhood, we see the days on market drop in Brickell. Q4 reports a 27% decrease over Q3 and a 26% fall since same quarter last year (fig.13.2). We also have the days on market declining 36% month-on-month and 34% year-over-year in December (fig. 13.2.1).
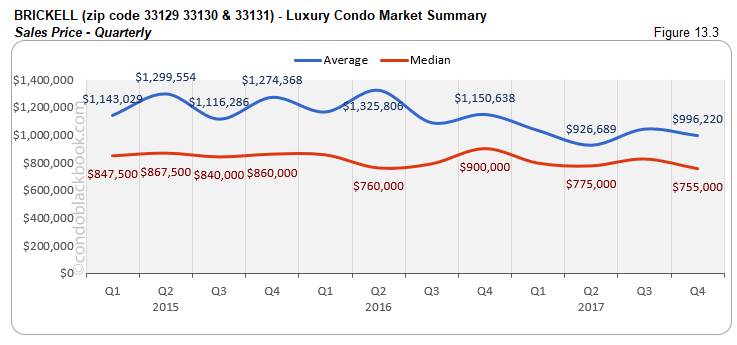
- Year closes to lower prices. We have the quarterly median sale price fall 16% year-over-year, and the price per sq. ft. fall 11%. (See fig. 13.3 and 13.4 below.) We also see the monthly median price go down 33% compared to December 2016, and price per sq. ft. drop 25%. This proves to be a definite incentive for prospective looking to buy into this dynamic financial district.
- Months of inventory increase 2%. Fig. 13.5 puts the months of inventory at 57 (872 active listings + 21 pending listings divided by a 6-month average of 16 deals a month). This is again much higher than the 9-12 months of a balanced market. With higher inventory and lower prices, buyers should take advantage by directly searching Brickell condos for sale here or taking a tour through Brickell here.
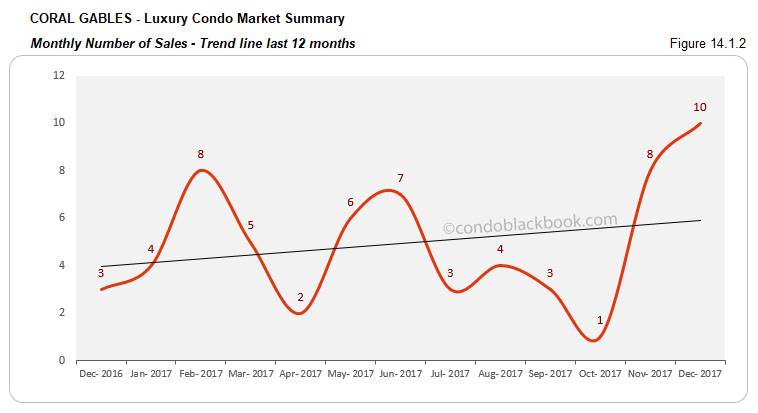
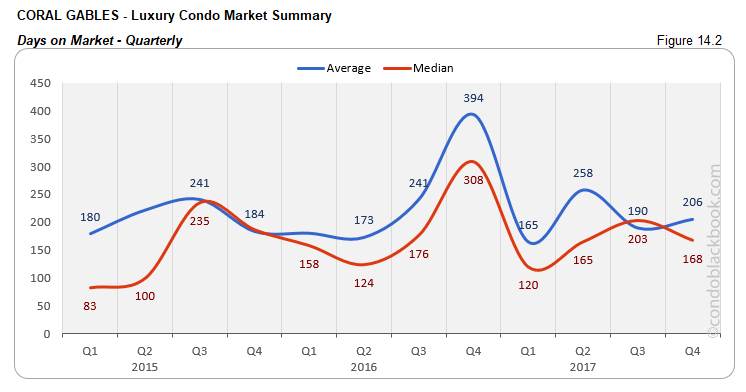
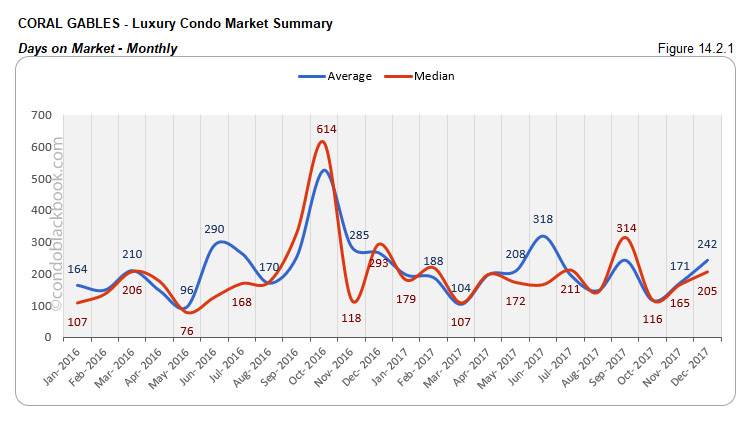
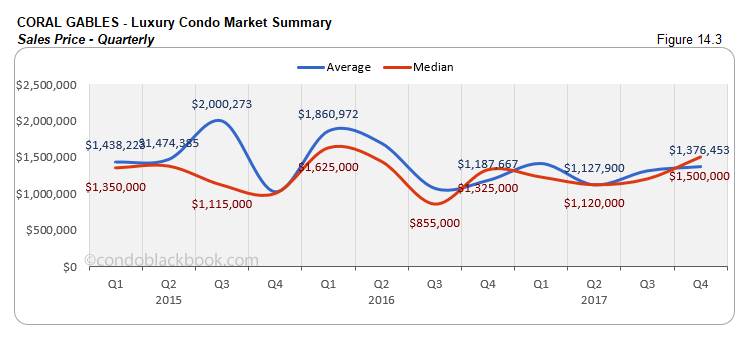
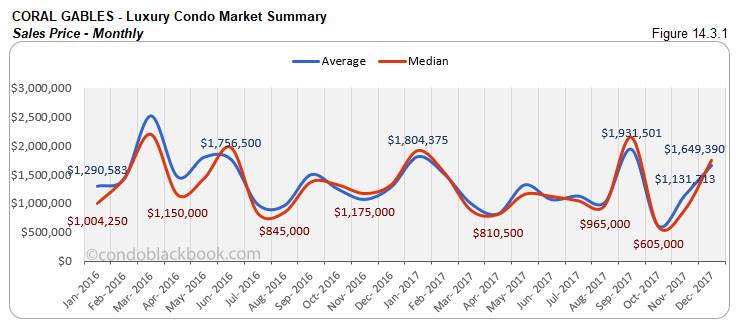
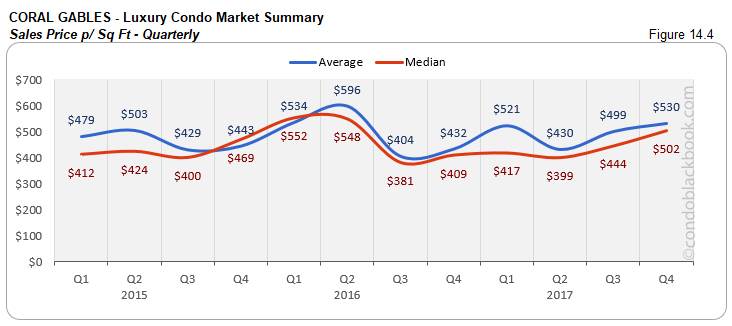
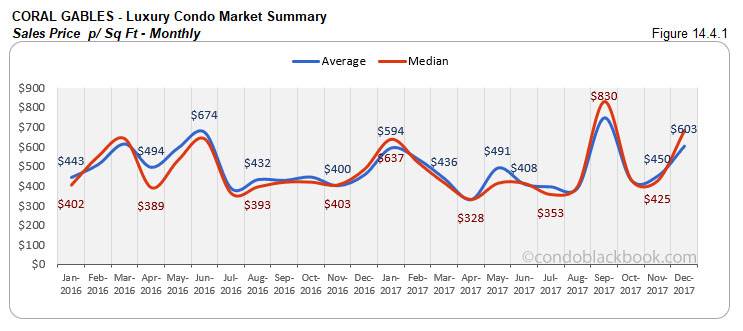
Coral Gables Luxury Condo Market Summary back to top
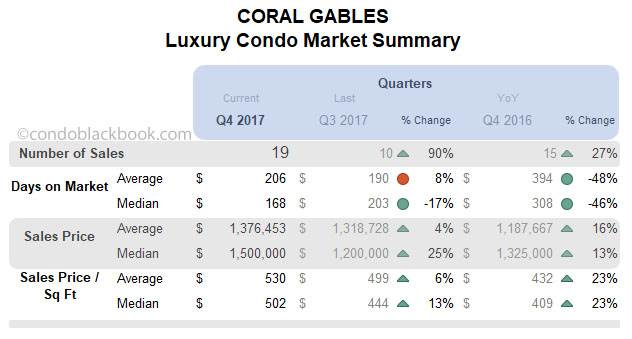
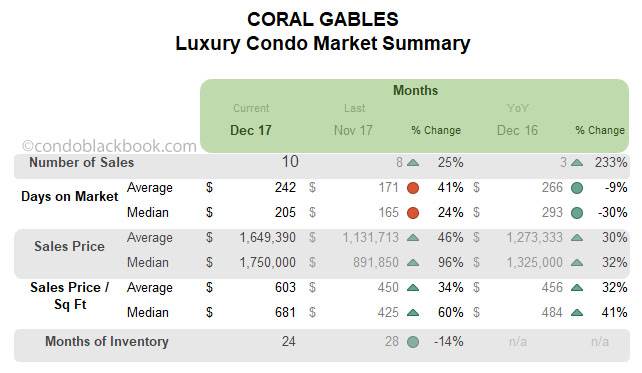
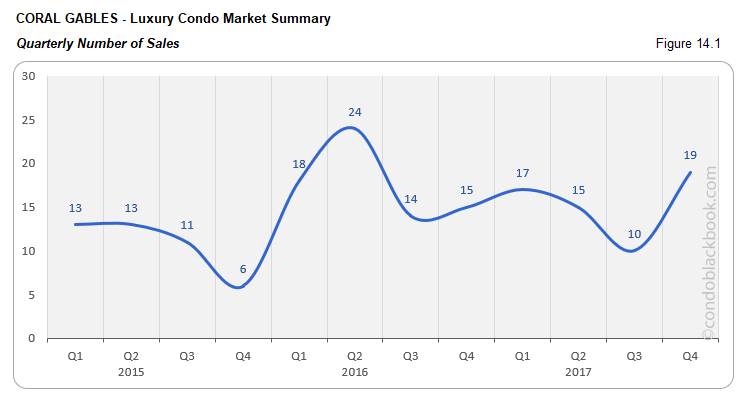
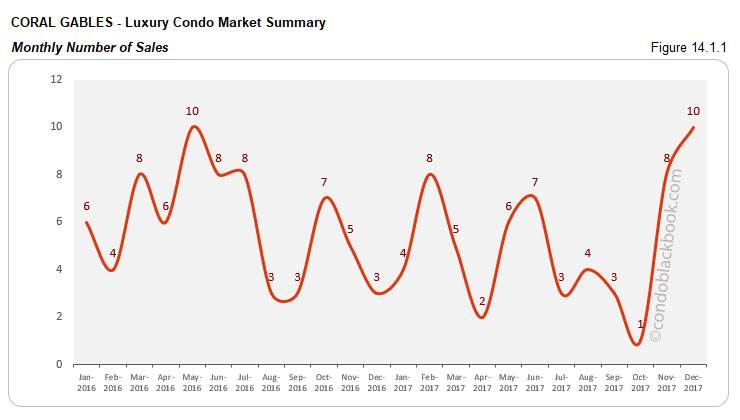
- Quarterly and monthly sales increase with positive trend line. Even as 2017’s sales were 14% lower than 2016, we see the 12-month trend line look up in fig. 14.1.2. This is due to the last quarter doing significantly well. Q4 posted a 90% increase over Q3 and a 27% increase over same quarter last year (fig. 14.1). We also see December coming out strongly with a 233% year-over-year increase (fig. 14.1.1).
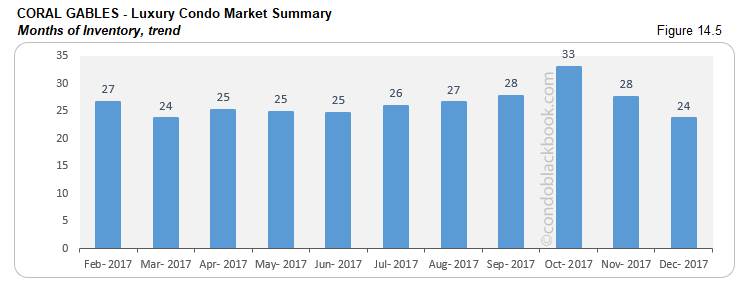
- 14% decline in inventory. Fig. 14.5 reports 24 months of inventory in Coral Gables (102 active listings + 22 pending, divided by a 6-month average of 5 deals a month). This is not only lower than November, but also closer to reaching the 9-12 month mark of a balanced market. That’s quite some progress for this modest luxury condo market. Until the balance mark is reached, buyers could gain by checking out the lifestyle options in Coral Gables, or directly search Coral Gables condos for sale here.
Conclusion
Predicting a stronger 2018, buyers should hustle. With December bringing in good sales momentum, we see the trend being carried forward into 2018. We expect more sales, more transactions to push a major chunk of inventory off the market by year-end. This leaves buyers with a limited amount of time to grab the best deals and make use of this “high inventory-low price” combo that has launched the New Year.
Love what you see? Don’t forget to share our blog and subscribe (see the subscribe link on the top menu) to receive the latest market news in your inbox.
Have any questions? Or see something wrong with the stats? Please contact Sep at sniakan (at) hbroswell.com or call 305-725-0566.
Share your thoughts with us

Your Miami Condo Awaits
Recent Posts


 (305) 697-7667
 (786) 321-7233
  contact@condoblackbook.com

