Luxury Miami Condo Report : Feb 2018
Mar 17, 2018 March 17, 2018
Miami Luxury Condo Report Overall Market Summary
City and Neighborhood Luxury Condo Reports
Miami Beach Luxury Condo Report
South Beach Luxury Condo Report
Bal Harbour Luxury Condo Report
Sunny Isles Beach Luxury Condo Report
Greater Downtown Miami Luxury Condo Report
Edgewater / Midtown / A&E District Luxury Condo Report
Coconut Grove Luxury Condo Report
Coral Gables Luxury Condo Report
Miami Luxury Condo Market Report: Summary back to top
With positives trickling in this February, the suspense is still on whether the first quarter will deliver a boost to the market. Till then, we see the luxury segment tame prices, ultra-luxury sales continue to make headlines and inventory trend positively compared to last year. Read on for a full analysis on the luxury condo market this February.
For the purpose of this luxury condo report, we have only considered properties priced $600,000 and above.
Overall Market Highlights:
- Sales outdo last year’s performance
- Overall days on market climb again after trending lower the past few months
- Ultra-luxury sales push up prices, but luxury segments remain modest with pricing
- Overall and most neighborhoods report reduction in inventory compared to last year
- Market still leans in favor of buyers
Sales stay on point. We see sales for most of the neighborhoods in our study post an uptick over January and February last year. This has put the market in an interesting position. If March comes in with the boost we are used to seeing, we could be looking at a great first quarter.
Days on market climb again. After last month’s descent, we see the days on market go up again this February. While this is a negative trend, we are hoping this is only a breather and expect sellers to continue being flexible to keep their properties selling.
Prices hover as luxury and ultra-luxury segments conflict. We see most price charts in our study reporting mixed price trends. This is because the luxury ($600K to $2 million) and ultra-luxury (above $2 million) segments are moving in opposite directions. The luxury segment has been keeping prices low to appeal to this buyer’s market. On the other hand, we have ultra-luxury deals typically going for over $12 million, pushing up metrics.
Months of inventory decrease. We see a vast improvement in the months of inventory in most of the neighborhoods. With most charts reporting a reduction compared to last year, we expect this influx of inventory to be absorbed slowly but surely.
Overall, we have a market gathering momentum and inching towards a more positive, balanced state. If March delivers on its history of higher sales, we could expect a turnaround to surface by the latter half of 2018.
Where Does the Market Go From Here? back to top
Buyers have been in control of the market for over a year now. However, if the following factors come through, the luxury condo market could regain its balance in Miami:
- The impact of tax cuts. While the full impact of the recent tax cuts is expected to come through by the end of Q2, we do have a shift to report. People from SALT tax states are now inquiring to set up their primary residence in Miami to take advantage of our zero state income tax. Here’s a brief on all the taxes you save when shifting residence to Florida.
- A softening U.S. Dollar. Our dollar has already weakened against the Euro to 2015 levels. It has also softened against key currencies like the Brazilian Real. This shift in trends should definitely motivate and bring back a chunk of our foreign buyers.
- The call of warmer shores. With spring on the horizon but the cold still rearing its head up north, we expect snowbirds to turn to the warmth of Miami to avoid any further cold this year, or in the years to come, and always have a sunny place to call home.
- Lower prices motivating buyers. While our charts could stay inflated due to ultra-luxury sales (above $2 million), we know that the luxury segment has kept a check on its prices to appeal to this buyer’s market. As sellers remain flexible, increased buyer motivation will get those properties off the market, as seems to be the case this month with reports of lower inventory levels compared to last year.
Below is an insight into Miami’s overall and neighborhood-level luxury condo trends for the month of February 2018: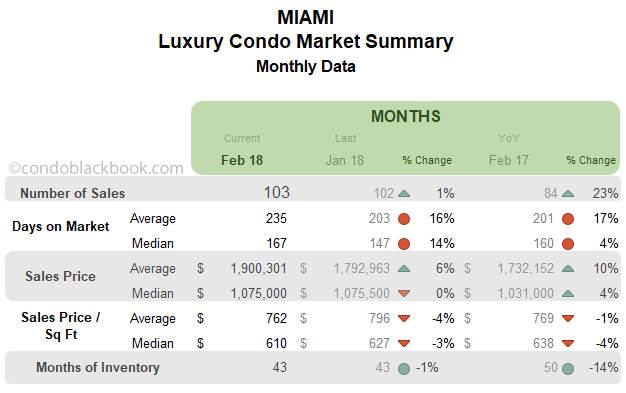
Monthly Number of Sales - Miami Luxury Condo Market Overall back to top
Sales continue upward climb. We see February echoing January’s sales build up, still keeping the suspense on whether we’ll get to see the usual boost in March or not. For now, the overall luxury condo market has a 1% month-on-month and 23% year-over-year increase to report. (See fig. 1.1 below)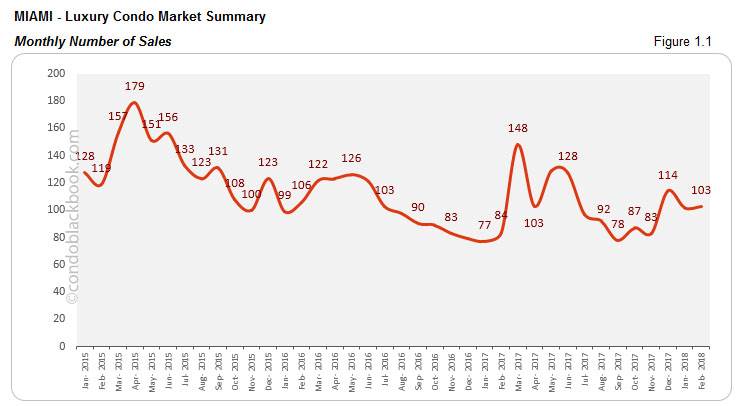
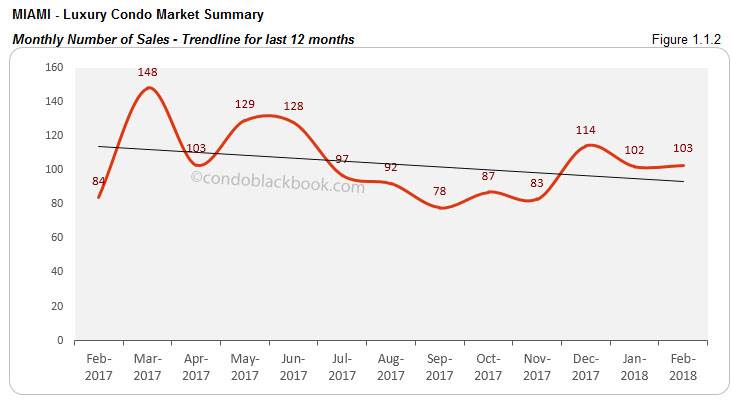
Trend line stays negative. Even with sales keeping up pace, the 12-month trend line below reports a decline. This means, the luxury condo market in Miami needs a much stronger push to catch up with last year’s performance.
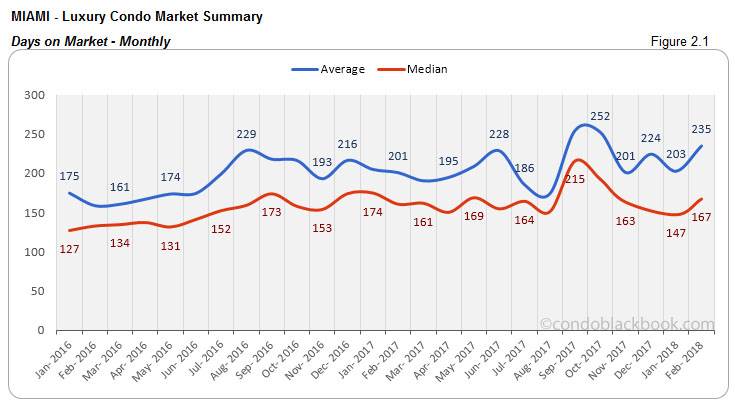
Days on Market - Miami Luxury Condo Market Overall back to top
“Days on market” are the total number of days from when a property is active to the day it goes under contract.
Days on market post uptick. After posting a decline for the past three months, we see the days on market take a break and move up again. February comes in with a 14% increase in month-on-month stats and 4% increase in year-over-year numbers below.
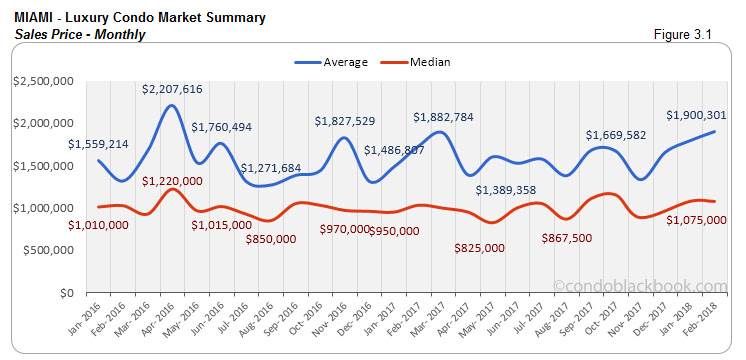
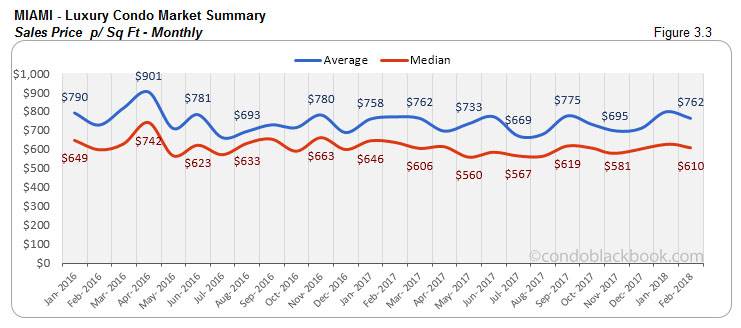
Sales Price Trends - Miami Luxury Condo Market Overall back to top
Sales prices hover as ultra-luxury sales stay consistent. Fig. 3.1 and 3.3 below report a minimal price variation of +/-4%. We see the same amount of ultra-luxury sales (above $2 million) take place in February as last month, with condos selling for as high as $12-17 million.
Inventory Trends - Miami Luxury Condo Market Overall back to top
A balanced market will only have 9-12 months of inventory.
Inventory deflates 14% year-over-year, market still in favor of buyers. This month, we find the months of inventory at 43 (4.1k active listings + 212 pending listings divided by a 6-month average of 95 deals a month). Even with a recent influx of listings, inventory reports a 14% reduction year-over-year. As we expect sales to pick up in upcoming months, buyers should look to grab deals while choices run aplenty.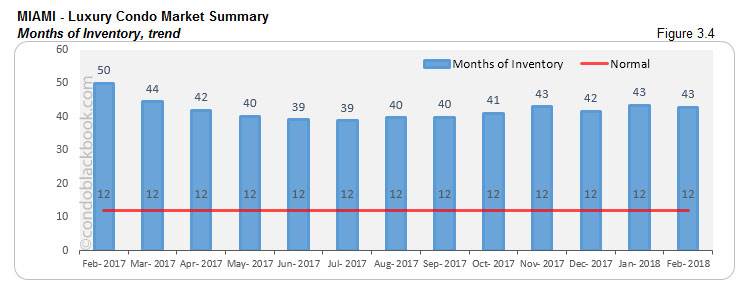
City and Neighborhood Market Reports back to top
Miami Beach Luxury Condo Market Summary back to top
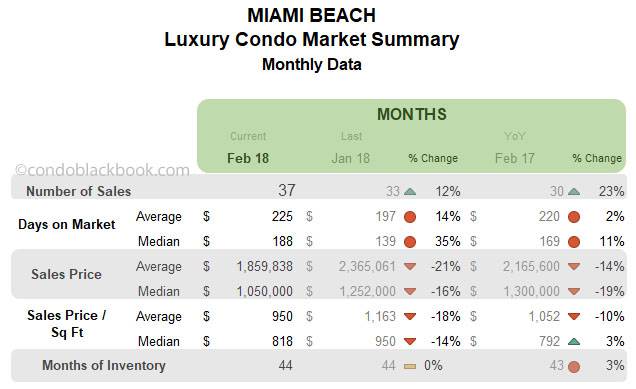
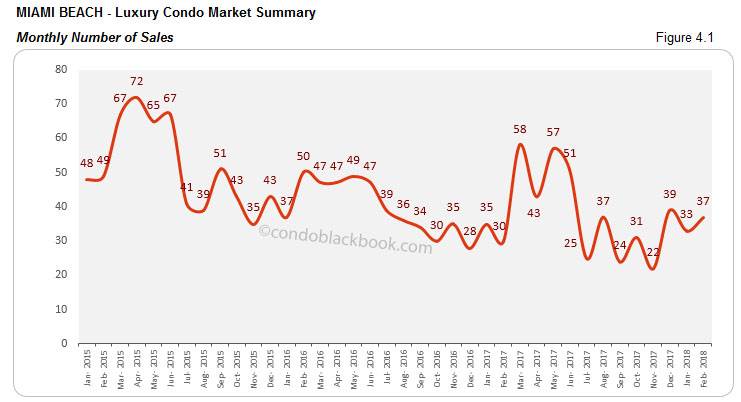
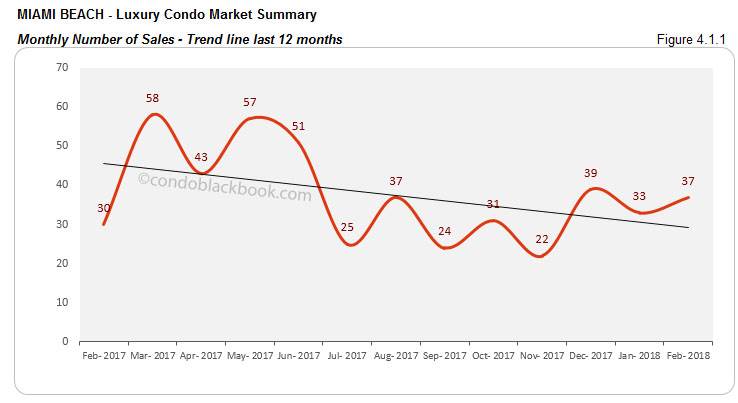
Sales post 23% year-over-year uptick, trend line sill dips. February reports good momentum for Miami Beach with a 23% year-over-year and 12% month-on-month increase in sales (fig. 4.1). However, we still see the 12-month trend line posting a decline in fig. 4.1.1. This means Miami Beach will require stronger sales to recover from the slack we’ve seen this past year. Hopefully, March will come in with its usual boost for an early correction.
Days on market bounce back up. After last month’s dip, the median days on market in Miami Beach have jumped 35% month-on-month and 11% compared to same month last year (fig. 4.2). Hopefully March comes in with its usual boost, and we can see a continuation on last month’s reducing trend.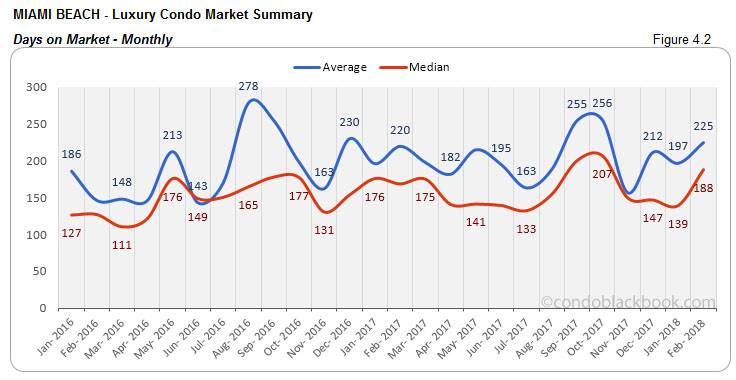
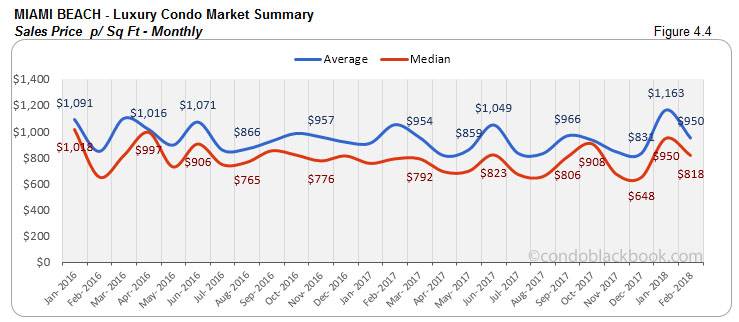
Prices post mixed results. We see a reduction in the sales price (fig. 4.3) and price per sq. ft. (fig. 4.4) for Miami Beach. But, this is not the complete picture. The luxury ($600K to $2 million) and ultra-luxury (above $2 million) segments actually have different trends to report. On one hand, the luxury segment has reduced its pricing. However, on the other, the ultra-luxury segment continues making high-value sales. It’s most expensive this month hit $12 million for an Apogee residence.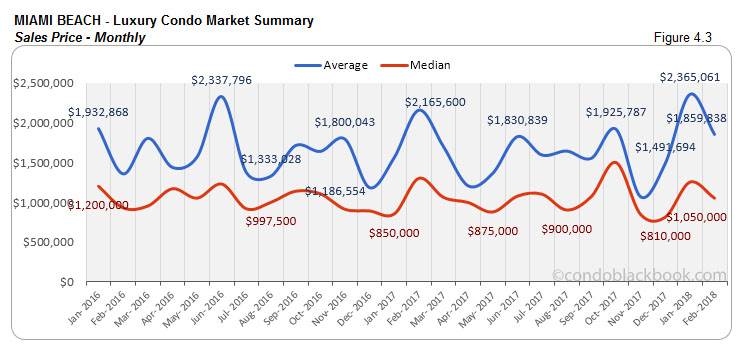
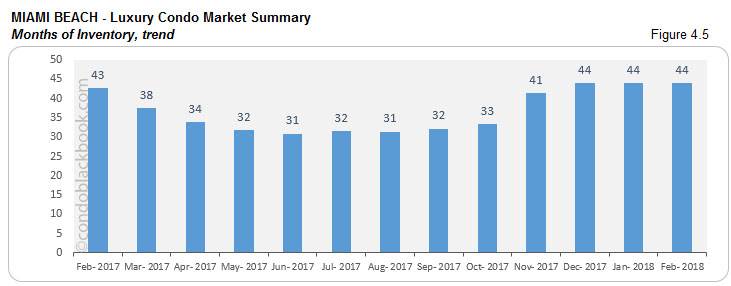
Inventory down 3% year-over-year. Fig. 4.5 below reports 44 months of inventory (1280 active listings + 77 pending divided by a 6-month average of 31 deals a month). Even though this is way off the 9-12 month mark of a normal market, there is a 3% reduction compared to same time last year. With sales momentum catching up, buyers should hurry and grab the best deals on Miami Beach condos for sale here.
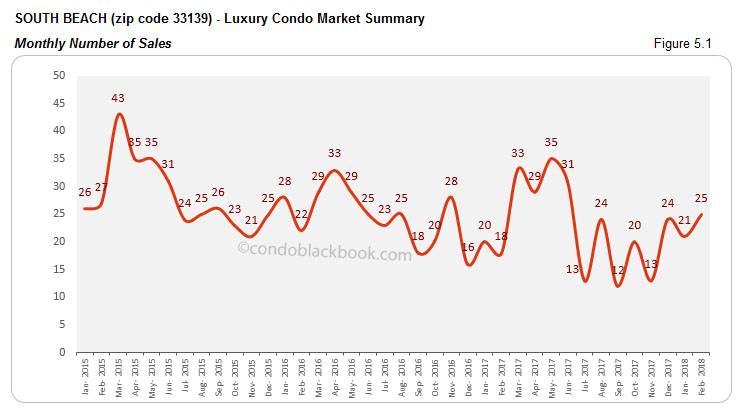
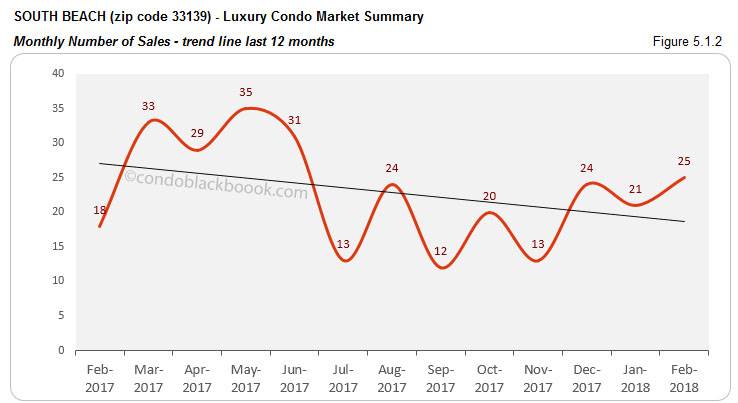
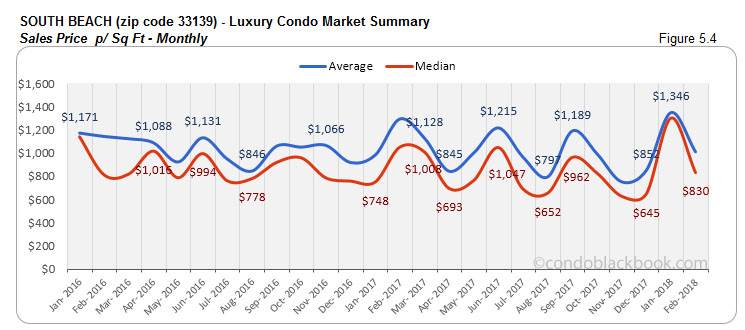
South Beach Luxury Condo Market Summary (33139 zip) back to top
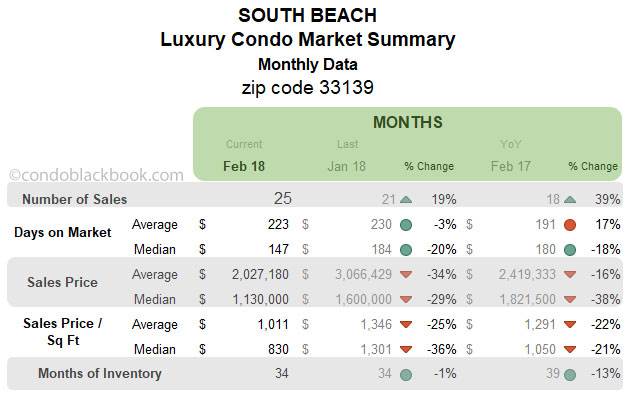
Sales jump 39% year-over-year, but trend line tips downwards. South Beach reports good numbers with a 19% month-on-month and 39% year-over-year increase this February (fig. 5.1). However, tracing the last 12 months, the trend line in fig. 5.1.2 still hasn’t received the push it needs . Hopefully, March will deliver on its usual boost to push the trend line back up to a positive.
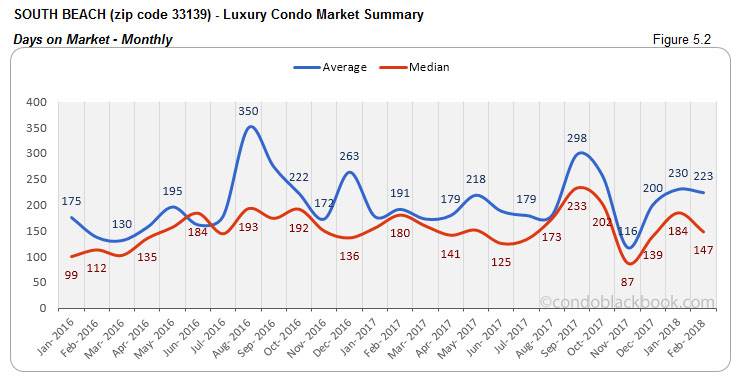
Days on market reduce 20%. South Beach is one of the few neighborhoods in our study to report a positive trend on the days on market. This vacation destination shows a 20% month-on-month and 18% year-over-year reduction in its median days on market (fig. 5.2).
Price trends decline, but ultra-luxury stays pricey. We see the price trends decline significantly in fig. 5.3 and 5.4 below. This is mainly due to the luxury ($600K to $2 million) segment keeping prices low. However, the ultra-luxury (above $2 million) segment continued with high value deals including this month’s $12 million Apogee sale.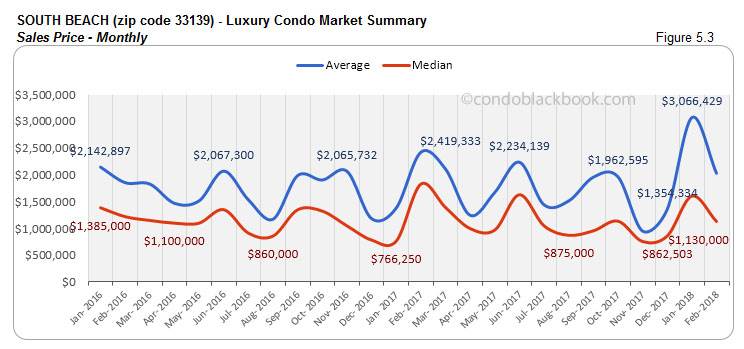
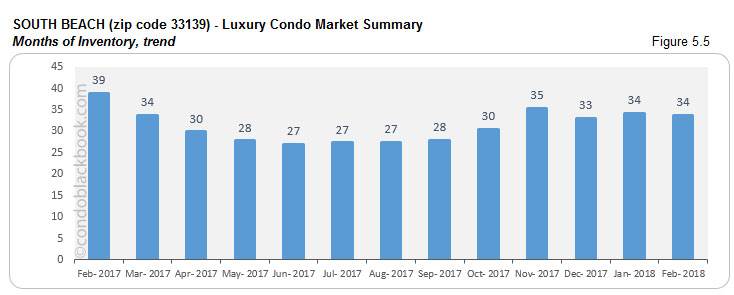
Inventory down 13% year-over-year. Fig. 5.5 below puts months of inventory at 34 (706 active listings + 29 pending listings divided by a 6-month average of 19 deals a month). Even though this is way off the 9-12 month mark of a balanced market, we see a 13% decrease compared to February last year. As sales are expected to pick up further, buyers should look into South Beach condos for sale here now, or begin with a tour of South Beach here.
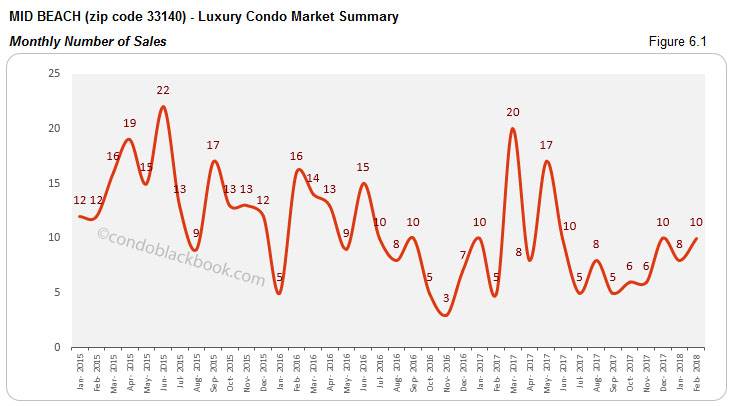
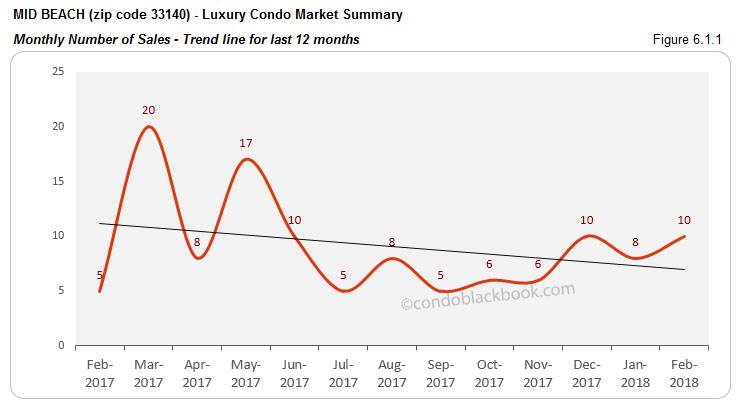
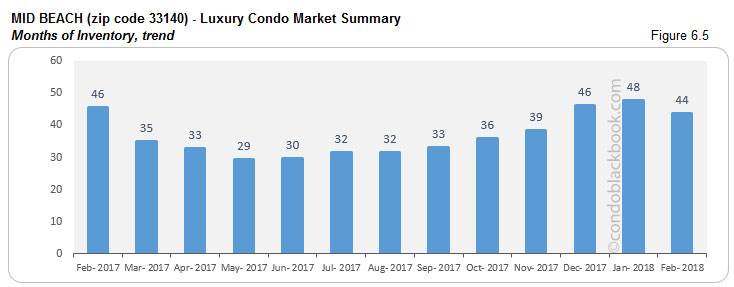
Mid-Beach Luxury Condo Market Summary (33140 zip) back to top
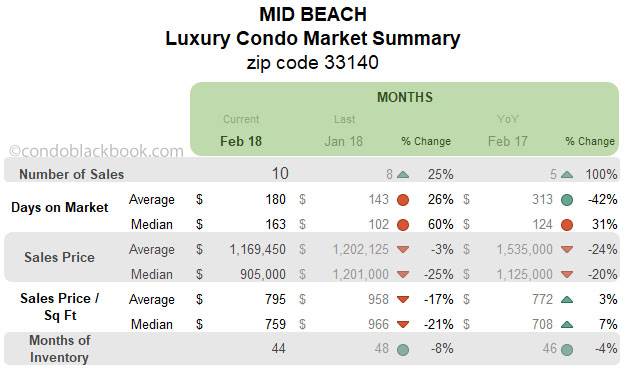
Sales soar, but trend line tips down. Mid-Beach reports a good month on sales. We see 25% more sales than January and double the sales of last year (fig. 6.1). However, the 12-month sales trend line still tips downwards (fig. 6.1.1), indicating that a stronger sales momentum is required to push those metrics up.
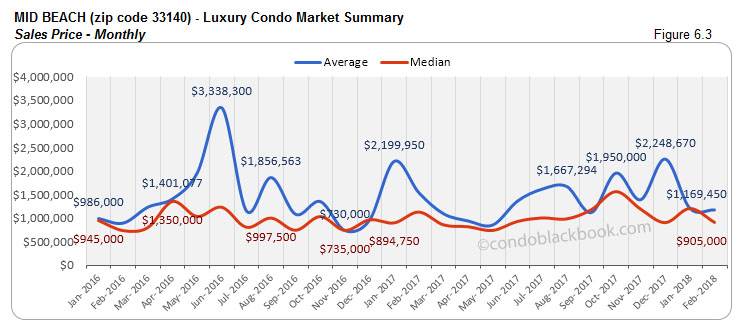
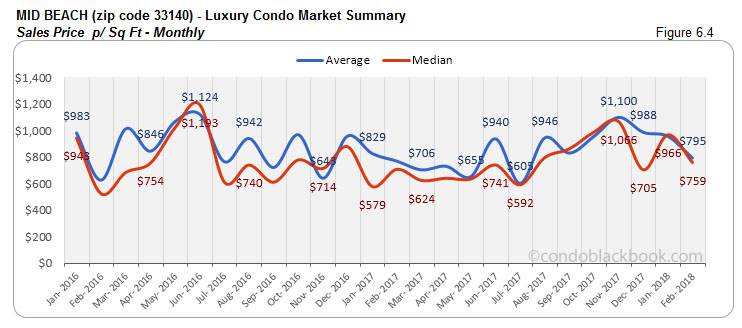
Price charts post volatility. After last month’s curious hike, we see the charts adjust lower this February. Fig. 6.3 and 6.4 report a drop in median price and price per sq. ft. What’s interesting to note is that this volatility is not related to the amount of ultra-luxury sales (above $2 million), as the neighborhood hardly has any.
Inventory drops 4% year-over-year. Fig. 6.5 reports 44 months of inventory (292 active listings + 26 pending listings divided by a 6-month average of 8 deals a month). This is 8% lower than January and 4% lower than same month last year. Again, the trend is much higher than the 9-12 month mark of a balanced scenario. With the market still favoring buyers, scout for deals on Mid-Beach condos for sale here, or begin with a tour of the neighborhood here.
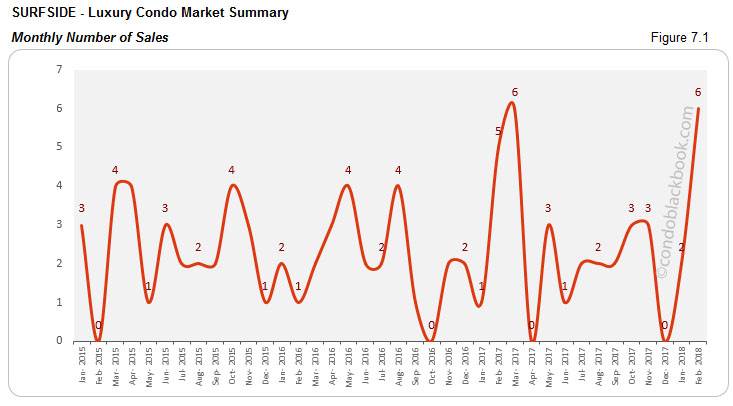
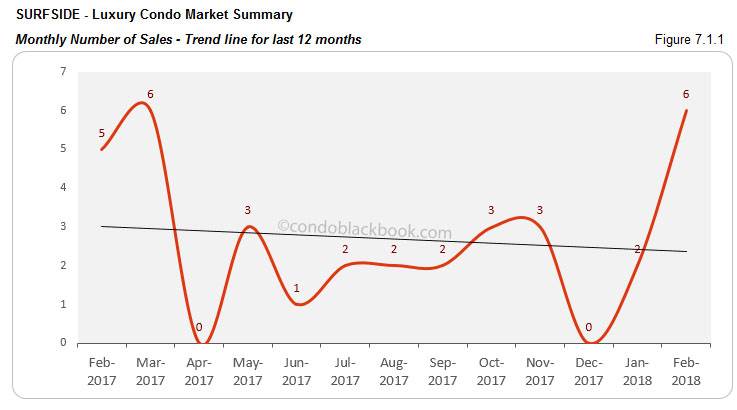
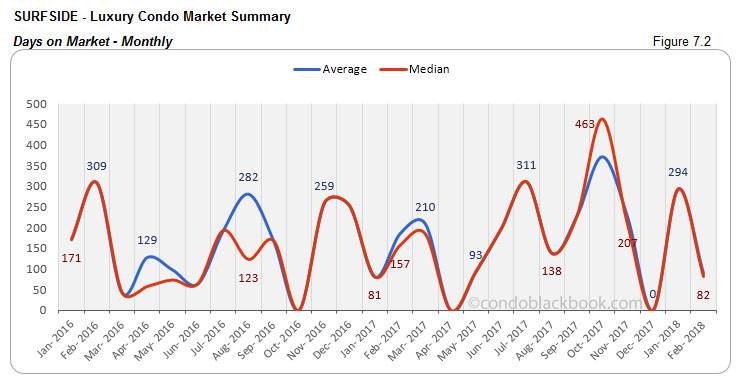
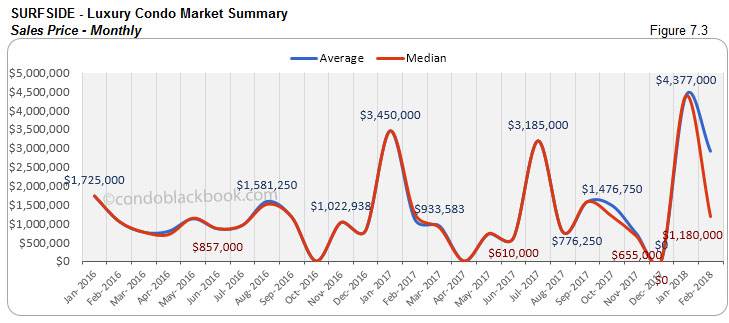
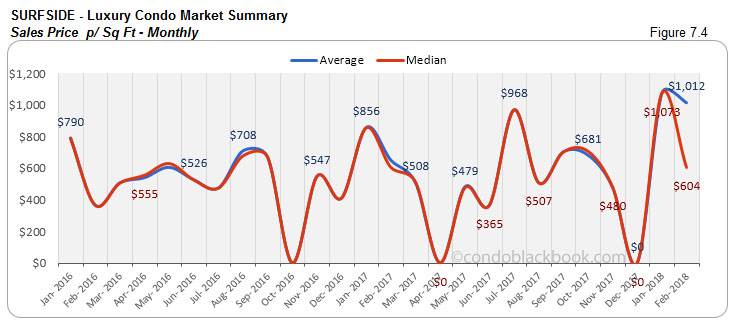
Surfside Luxury Condo Market Summary back to top
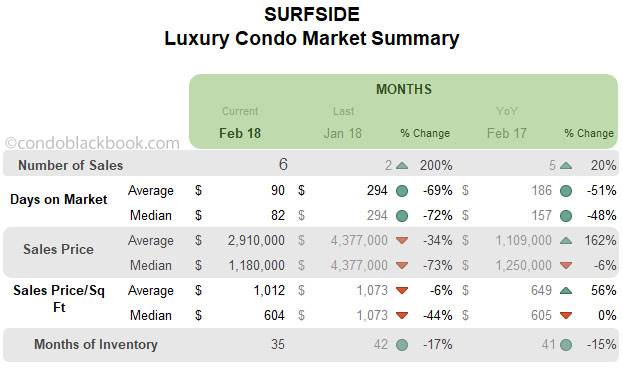
- Sales spike causes noise in other metrics. From hitting rock bottom in December to a spike this February, Surfside has quite an improvement to report (fig. 7.1). However, considering this is a rather modest market for luxury condos, we see much volatility in the days on market (fig. 7.2) and trend line below (fig. 7.1.1).
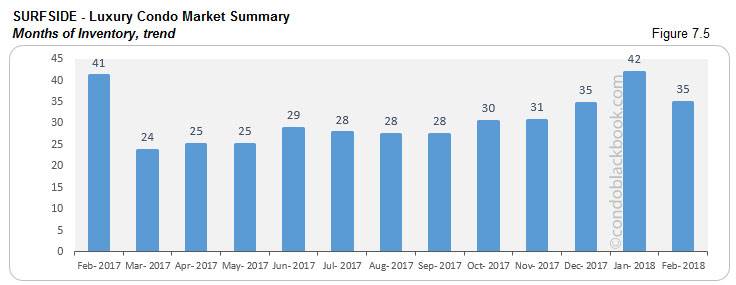
Inventory drops 15% year-over-year. Fig. 7.5 below reports 35 months of inventory (81 active listings + 3 pending divided by a 6-month average of 3 deals a month). This is 17% lower than January and 15% less than same month last year. However, as inventory is still off the 9-12 months of a balanced market, buyers should take advantage and search for a Surfside condo for sale here, or see what lifestyle makes up the chic community of Surfside here.
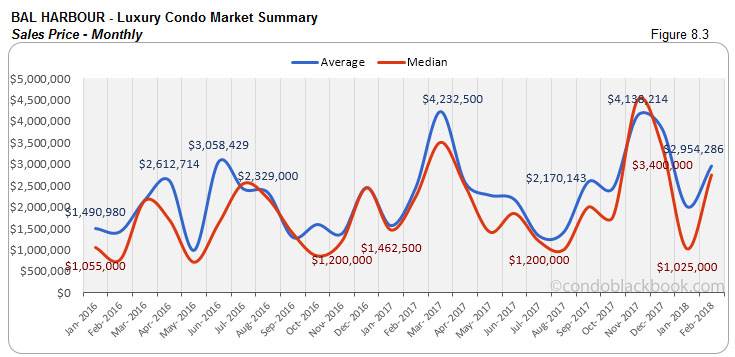
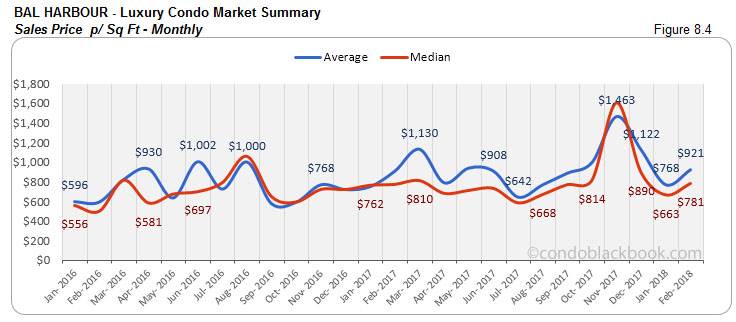
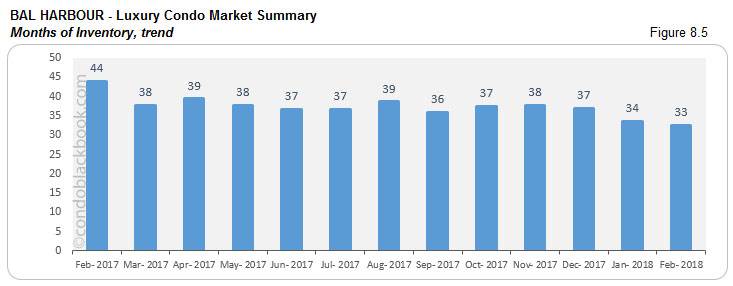
Bal Harbour Luxury Condo Market Summary back to top
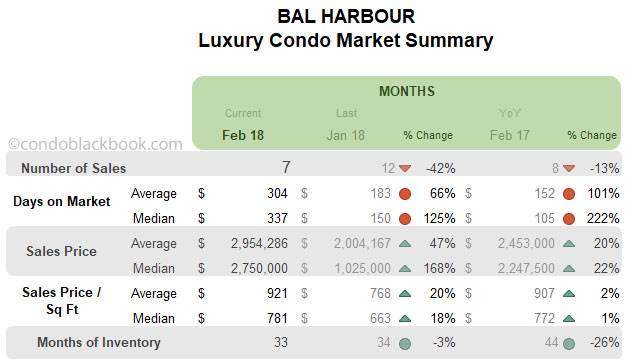
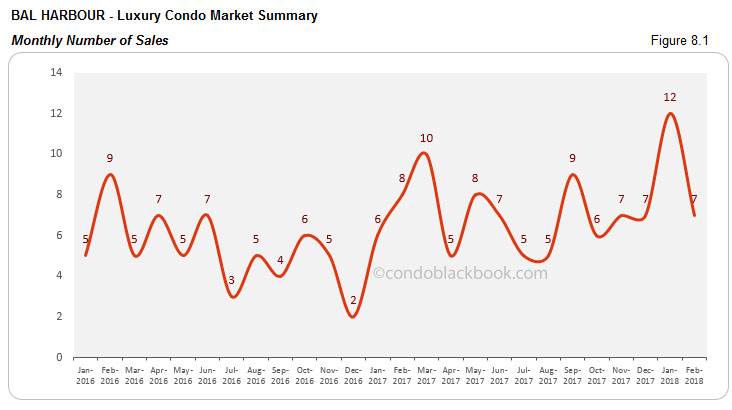
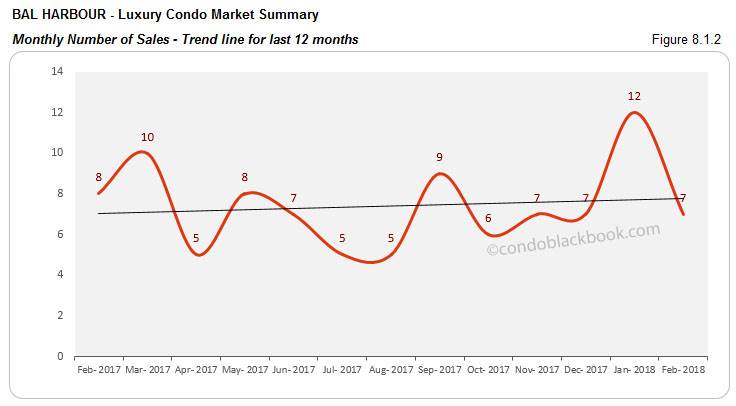
Sales dive, but trend line stays positive. Bal Harbour is one of the few neighborhoods in our study to report slower sales (fig. 8.1). This small market for luxury condos seems to be taking a breather after January’s peak. Last month’s performance also left its impact on the trend line, which remains positive for February (fig. 8.1.2).
Ultra-luxury sales make price charts highly volatile. With ultra-luxury sales (above $2 million) moving in and out, month after month, we see the price trends influenced easily. (See fig. 8.3 and 8.4 below.) Unable to find a stable average, prices peak this February after January’s sharp dive.
26% reduction in year-over-year inventory. Fig. 8.5 reports 33 months of inventory (229 active listings + 9 pending divided by a 6-month average of 8 deals a month). This is quite a positive, as the trend falls 3% month-on-month and 26% year-over-year. However, it is still off the 9-12 month mark of a balanced market, giving buyers the opportunity to fish for deals on Bal Harbour condos for sale here, or begin by checking out this upscale neighborhood here.
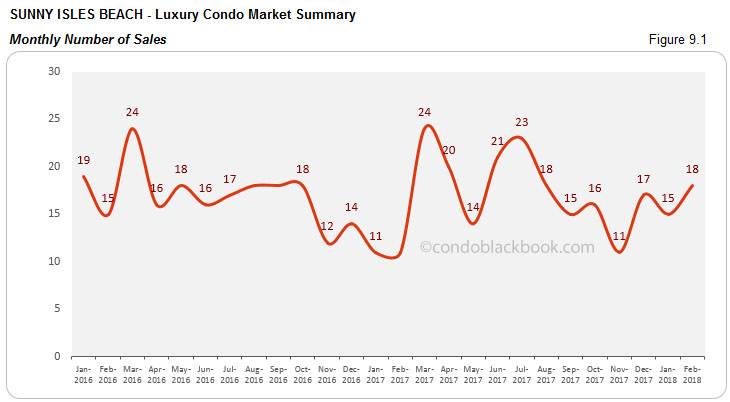
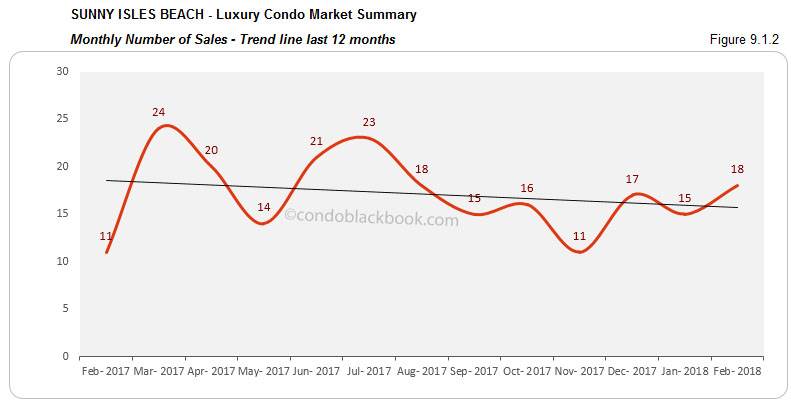
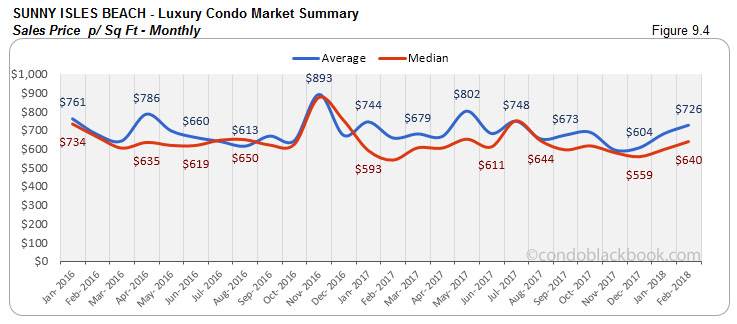
Sunny Isles Beach Luxury Condo Market Summary back to top
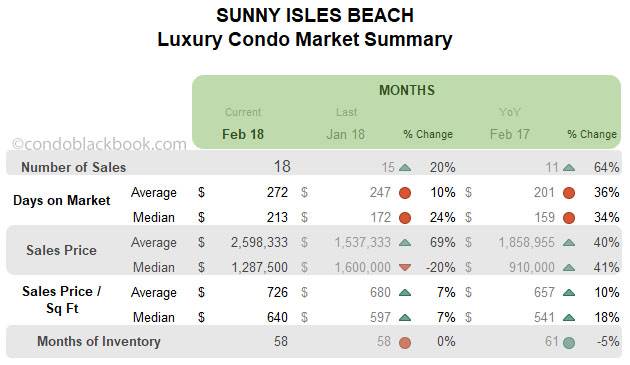
Sales post uptick, though trend line dips. We see a 20% month-on-month and 64% year-over-year spike in sales in this branded condo corridor (fig. 9.1). However, even this couldn’t stop the 12-month trend line from tipping down in fig. 9.1.2. Hopefully, a seasonal boost in March will help bring the trend back to its positive position.
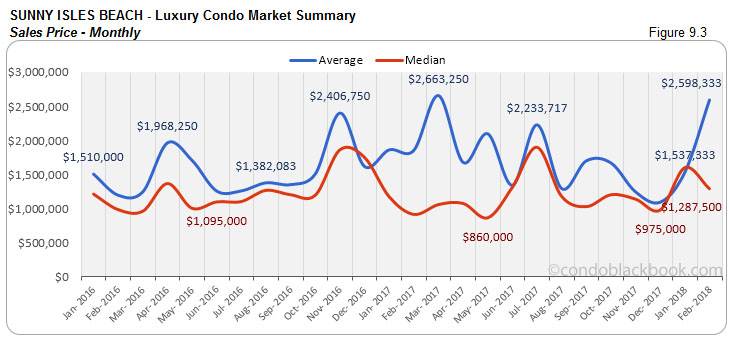
Prices post mixed trends. Fig. 9.3 and 9.4 show mixed results for the price and price per sq. ft. in Sunny Isles Beach. This is due to the luxury ($600K to $2 million) and ultra-luxury (above $2 million) segments moving in different directions. While the luxury segment continues to reduce prices, the ultra-luxury segment continues with expensive deals including February’s $17 million Mansions at Acqualina sale.
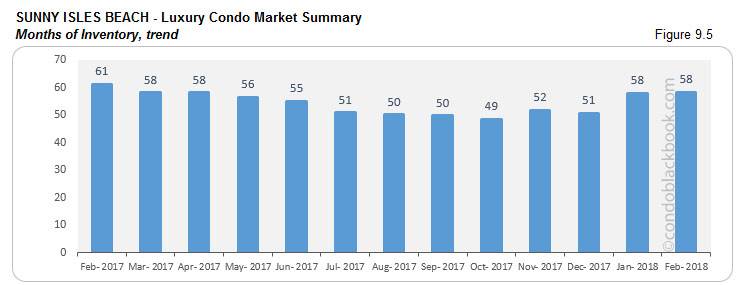
Year-over-year inventory down 5%. Fig. 9.5 reports 58 months of inventory (868 active listings + 24 pending divided by a 6-month average of 15 deals a month). This is the same as January, but 5% lower year-over-year. However, since the metric is still far off from the 9-12 month mark of a balanced market, buyers should take advantage and search Sunny Isles Beach condos for sale here, or explore lifestyle options here.
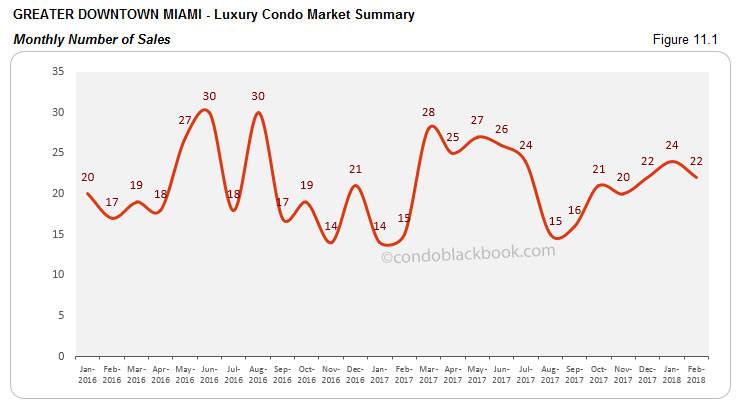
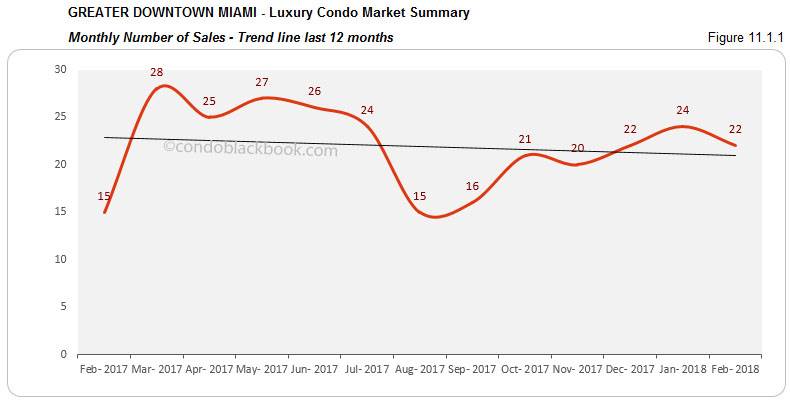
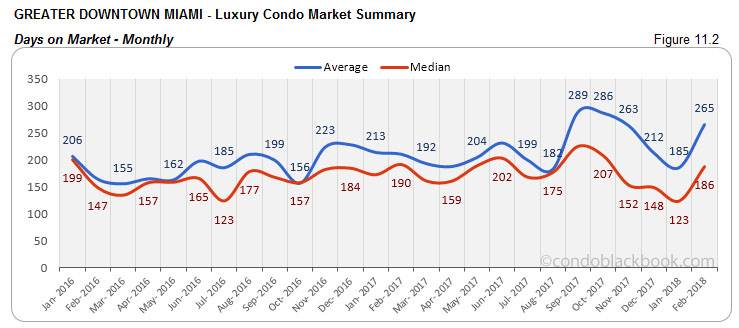
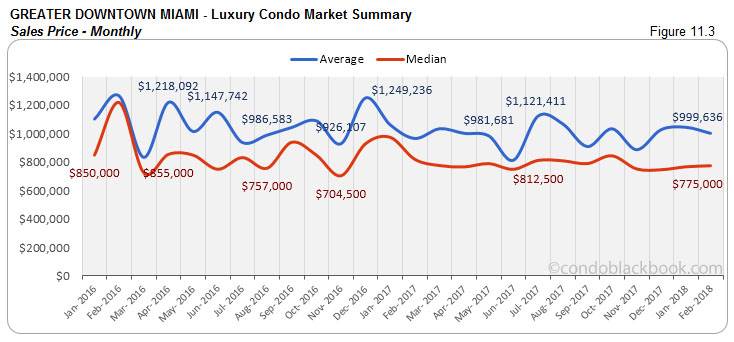
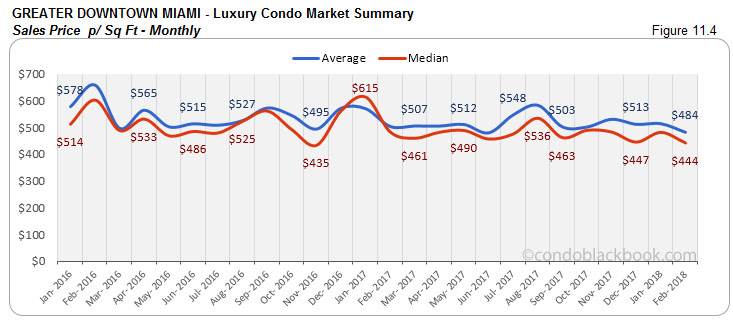
Greater Downtown Miami Luxury Condo Market Summary (33129, 33130, 33131, 33136, 33137 zips) back to top
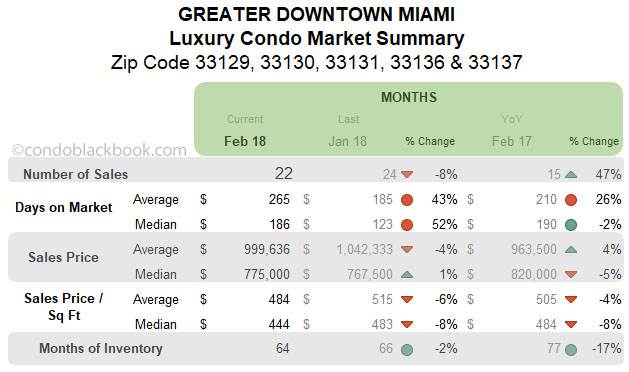
Sales and trend line slide slightly, but keep momentum. Though sales seem to have declined compared to January, they are still 47% higher than February last year (fig. 11.1). This means the neighborhood has not lost all its steam (progress). Even the trend line in fig. 11.1.1 is tipped downward, but if March comes in with its expected boost, we could soon see a correction soon.
Mixed trend in price charts. Fig. 11.3 and 11.4 do not show much of a reduction in median trends even as the luxury segment has lowered its prices. This is due to a small boost in ultra-luxury sales (above $2 million) that’s keeping indices up.
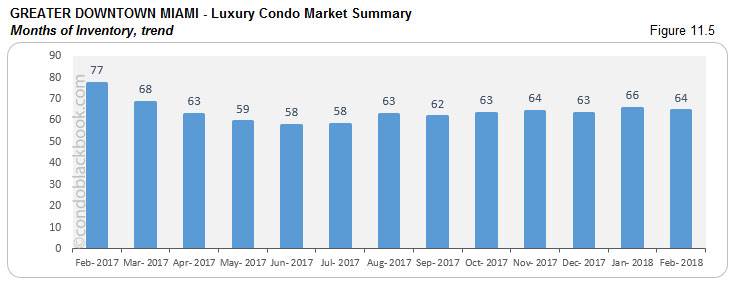
Months of inventory reduce 17% year-over-year. Fig. 11.5 shows 66 months of inventory (1351 active listings + 48 pending divided by a 6-month average of 21 deals a month). This is 17% lower than same month last year and 2% lower compared to January. Still with one of the highest inventories in our study and way off the ideal 9-12 month mark, buyers hold a great advantage and should look for luxury condo deals in the dynamic Greater Downtown Miami area here.
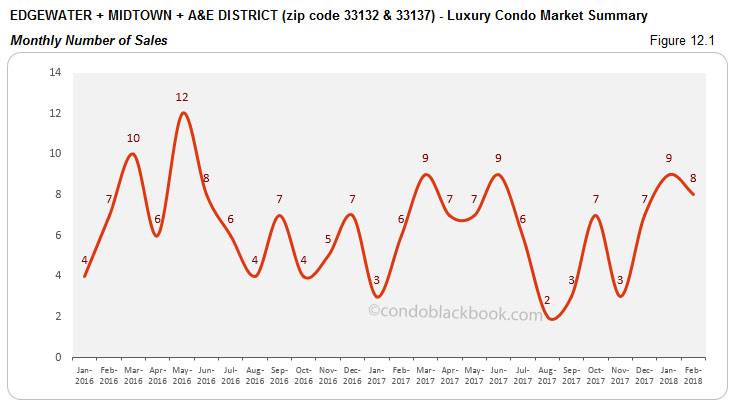
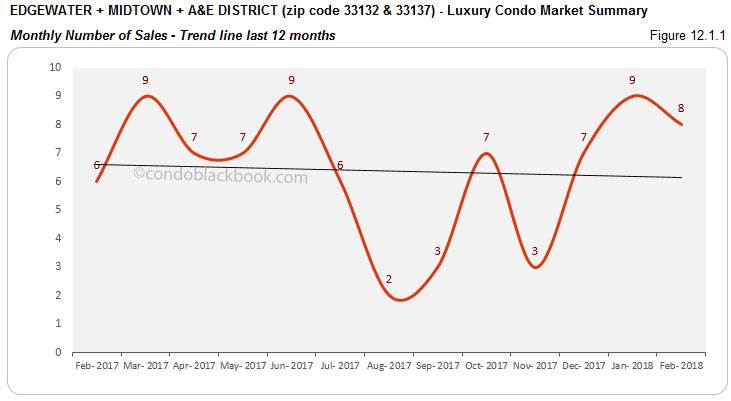
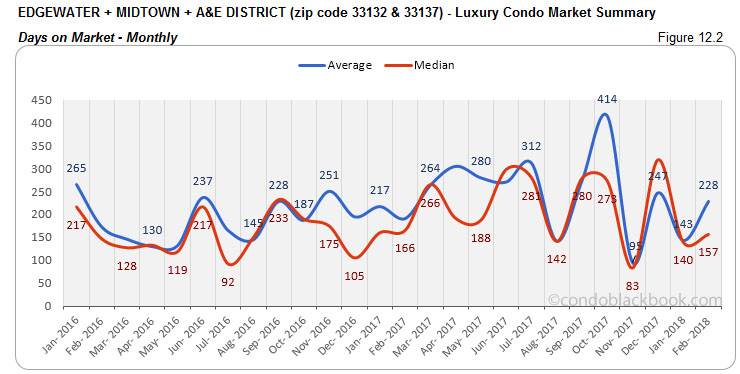
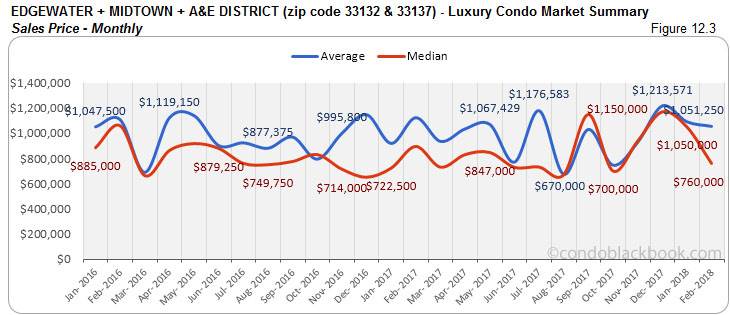
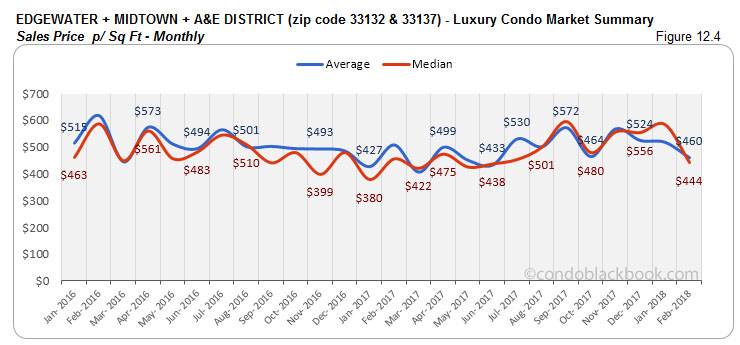
Edgewater + Midtown + A&E District Luxury Condo Market Summary (33132 + 33137 zip) back to top
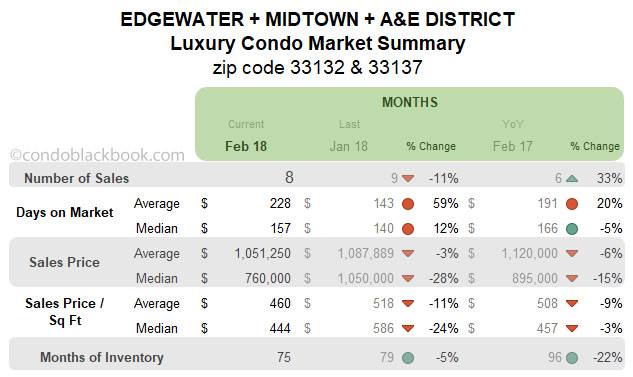
Sales improve year-over-year, though trend line and prices make downward adjustment. Reporting a negative on its month-on-month sales, this grouping still shines with a 33% improvement year-over-year (fig. 12.1). Perhaps a month-on-month decline of 28% in prices (fig. 12.3) and 24% in price per sq. ft. (fig. 12.4) could have fueled buyer motivation. Nonetheless, the trend line dipped this February capturing a loss in momentum.
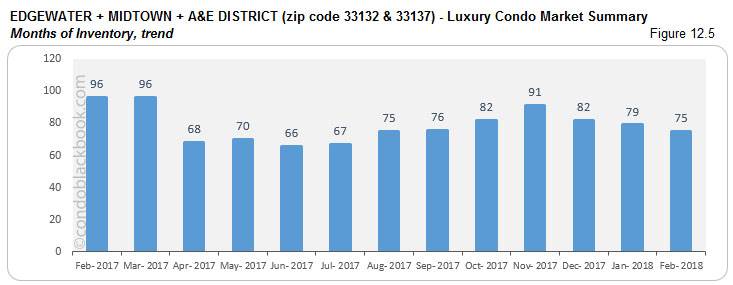
Year-over-year inventory down 22%. Fig. 12.5 reports 75 months of inventory for this grouping (444 active listings + 13 pending divided by a 6-month average of 6 deals a month). This is 5% lower than last month and 22% lower than last year. In spite of a decrease, this is one of the highest inventories in our study. Again, way off the 9-12 month mark of a normal market, buyers will hold the advantage as they search for Edgewater condos for sale here or simply begin by exploring the individual lifestyle and condo options in Edgewater, Midtown and Arts & Entertainment District.
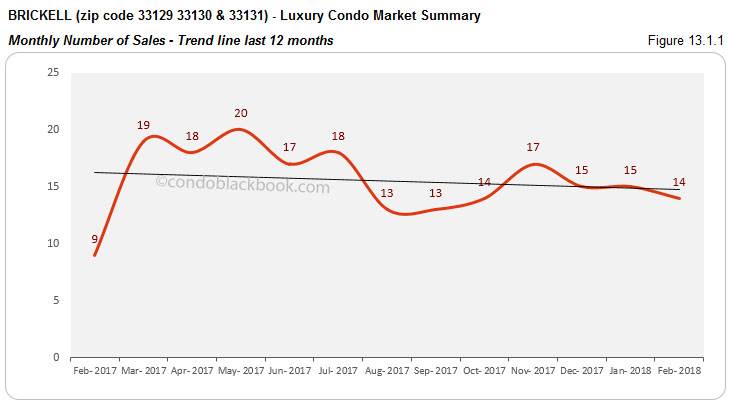
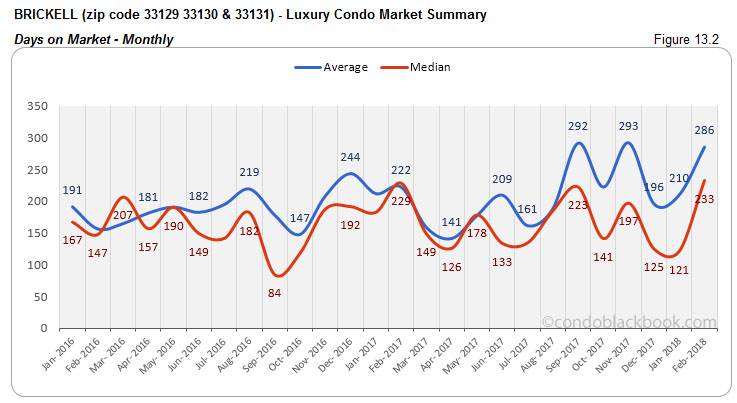
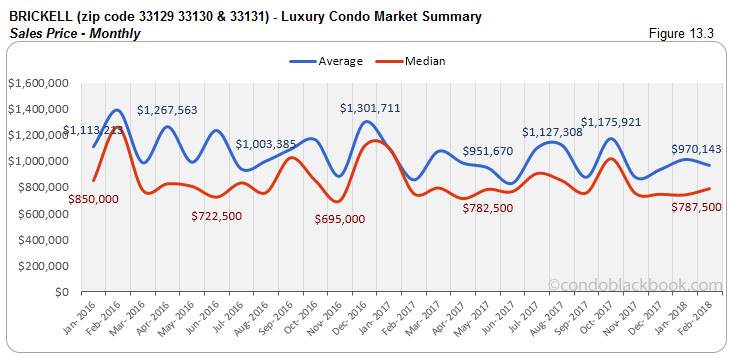
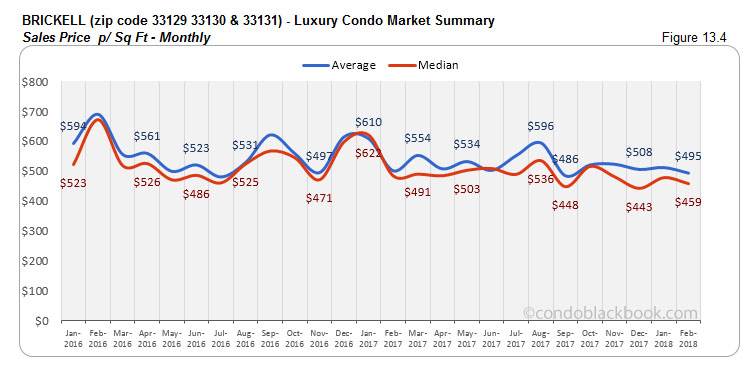
Brickell Luxury Condo Market Summary (33129, 33130, 33131 zip) back to top
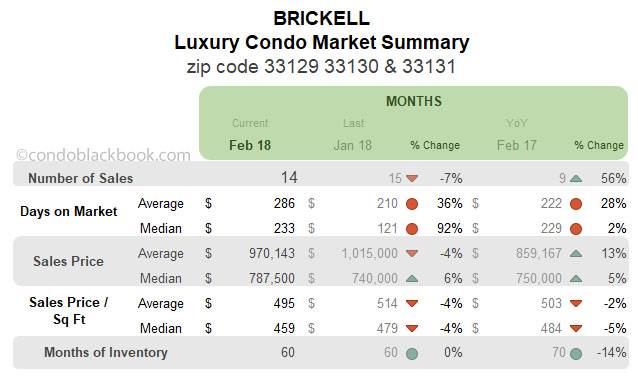
Year-over-year sales improve, but trend line goes negative. Missing the mark slightly in February, we see a 7% dip in sales (fig. 13.1). However, compared to same month last year, there is a 56% jump. Nonetheless, we see a negative trend line for Brickell this February (fig. 13.1.1). Hopefully, we’ll get to see the seasonal boost expected of March to turn around this trend.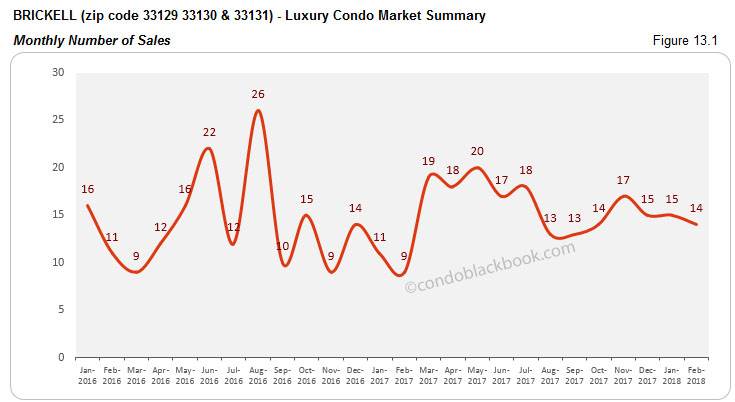
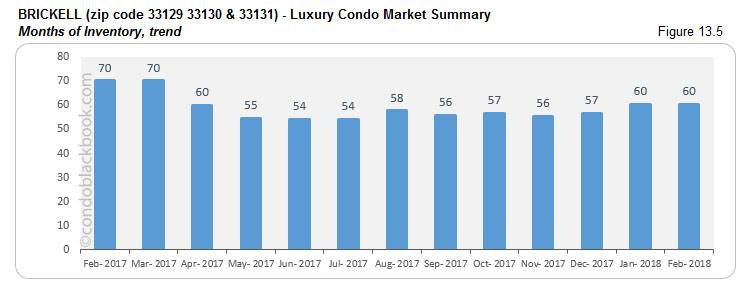
14% reduction in year-over-year inventory. Fig. 13.5 reports 60 months of inventory (906 active listings + 35 pending listings divided by a 6-month average of 15 deals a month). This is 14% lower than last year, but much higher than the 9-12 months of a normal market. With ample choices available, buyers should take advantage by searching Brickell condos for sale here or by first taking a tour through Brickell here.
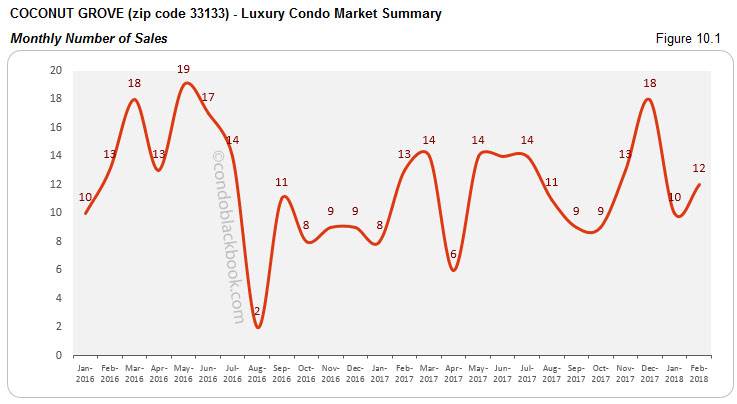
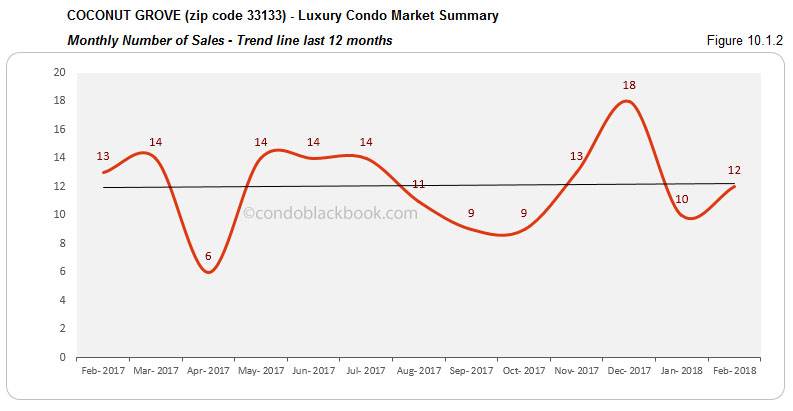
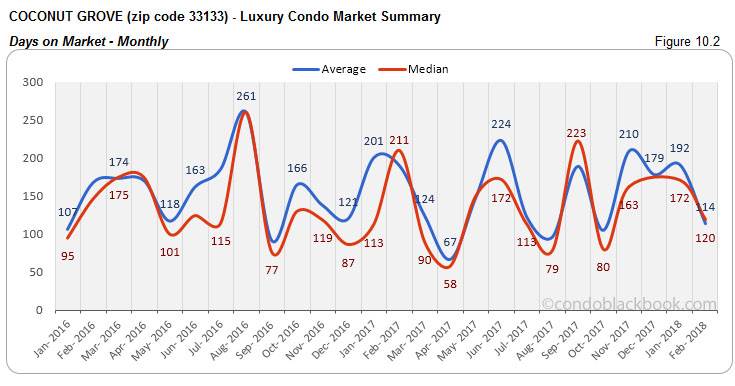
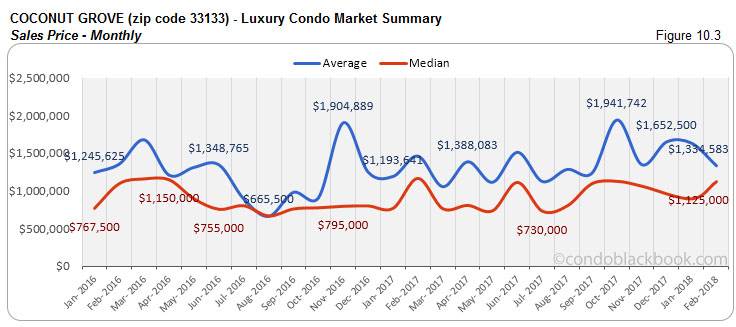
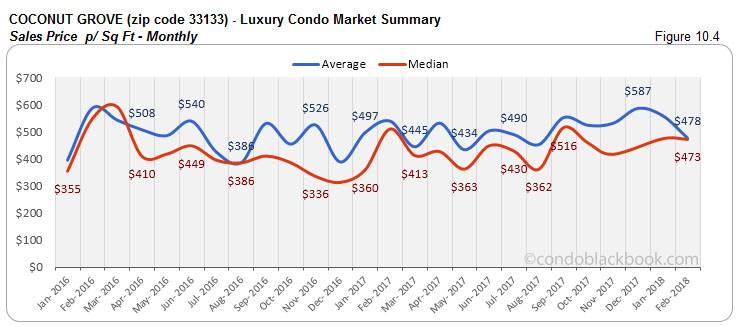
Coconut Grove Luxury Condo Market Summary (33133 zip) back to top
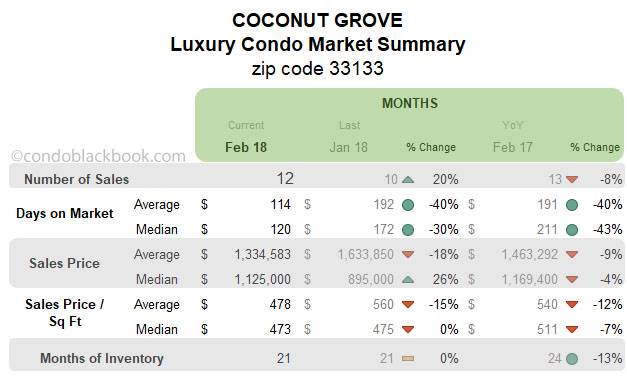
Sales maintain momentum, trend line stays positive. Coconut Grove reports a 20% uptick since January, but slacks 8% compared to same month last year (fig. 10.1). Nonetheless, a positive trend line in fig. 10.1.2 shows that progress is on point for this vibrant neighborhood.
Days on market drop. In another positive, we see a 30% decline in the median days on market compared to January and 43% drop compared to same month last year (fig. 10.2).
Price charts report volatility. Since Coconut Grove is a rather modest market for luxury condos, volatility in prices (fig. 10.3 and 10.4) is expected.
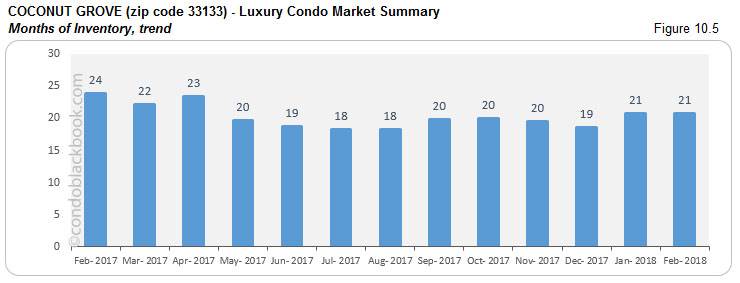
Year-over-year inventory down 13%. Fig. 10.5 below shows 21 months of inventory (219 active listings + 30 pending divided by a 6-month average of 12 deals a month). This is 13% lower than same month last year and the closest to reaching the ideal 9-12 month mark. Until a balance is reached, buyers should hurry to grab deals by searching Coconut Grove condos for sale here, or check out what lifestyle makes this the fastest selling neighborhood in our luxury condo study here.
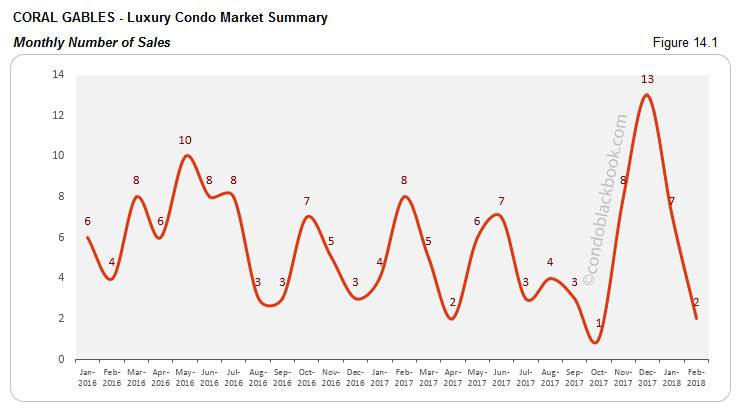
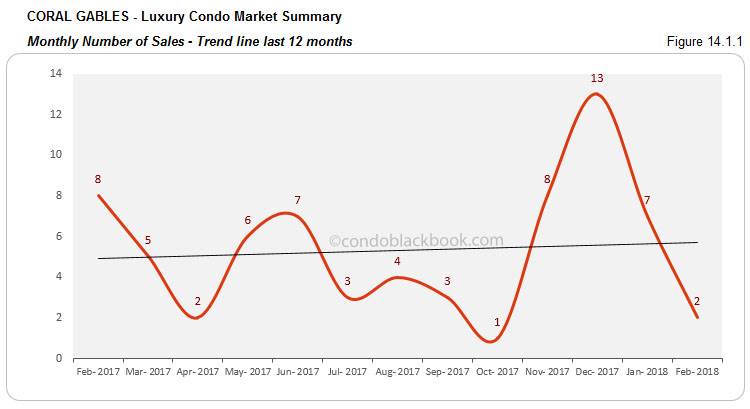
Coral Gables Luxury Condo Market Summary back to top
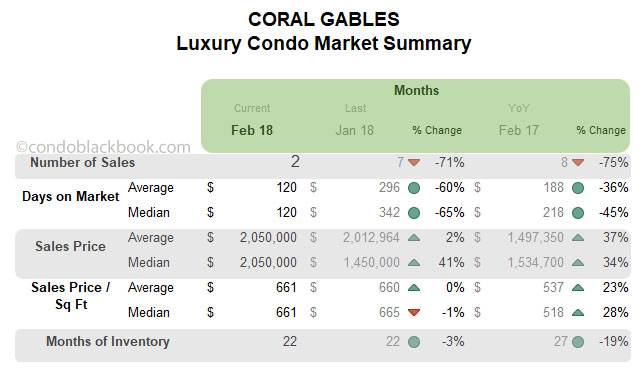
Sales dip, but trend line maintains positivity. We see quite a dive in sales for Coral Gables (fig. 14.1). This is unusual of February, as we notice a 75% year-over-year decline. However, the trend line is still positive (fig. 14.1.1), indicating that the momentum gathered over the last 3 months is still keeping in this small market.
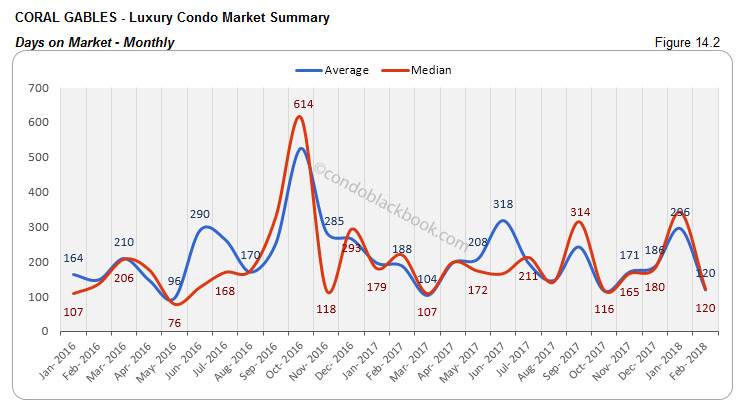
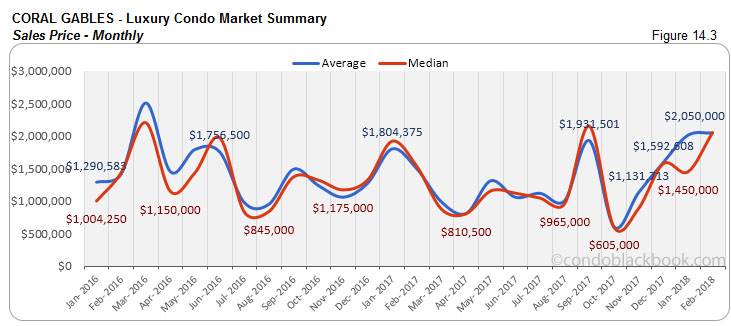
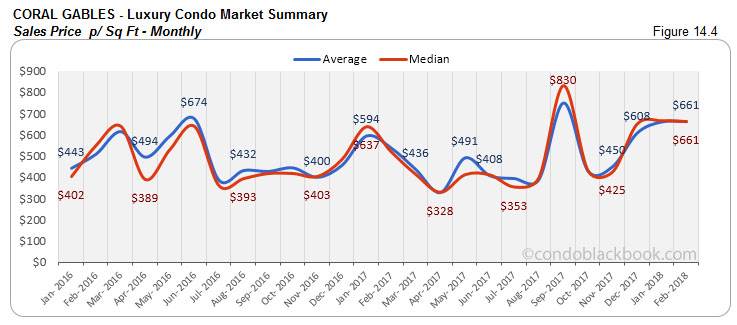
Highly volatile days on market and prices. Since Coral Gables is a small market for luxury condos, it is normal to see even a small shift in numbers causing much volatility in the charts.
19% decline in year-over-year inventory. Fig. 14.5 shows the same 22 months of inventory (95 active listings + 27 pending, divided by a 6-month average of 6 deals a month). But, a closer analysis reveals a 19% improvement compared to same month last year. Another neighborhood closer to reaching the 9-12 month ideal of a balanced market, buyers should be quicker to take advantage by searching Coral Gables condos for sale here, or by checking out the lifestyle options in Coral Gables.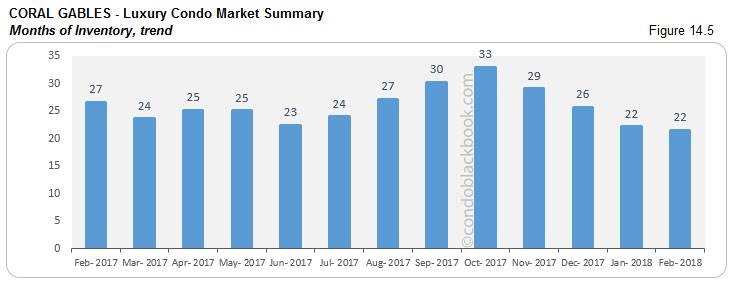
Conclusion back to top
Sales pick up pace, buyers continue to have the upper hand. Though not the hike we were expecting, we see February deliver higher sales for most neighborhoods in our study. We also see the months of inventory decrease significantly compared to last year. These little signs could translate into a complete shift by the year-end. However, until then, buyers should get aggressive on their offers and take advantage of the overall market weakness while it lasts.
Love what you see? Don’t forget to share our blog and subscribe (see the subscribe link on the top menu) to receive the latest market news in your inbox.
Have any questions? Or see something wrong with the stats? Please contact Sep at sniakan (at) hbroswell.com or call 305-725-0566.
Share your thoughts with us

Your Miami Condo Awaits
Recent Posts


 (305) 697-7667
 (786) 321-7233
  contact@condoblackbook.com

