Luxury Miami Condo Report : Jan 2018
Feb 25, 2018 February 25, 2018
Miami Luxury Condo Report Overall Market Summary
City and Neighborhood Luxury Condo Reports
Miami Beach Luxury Condo Report
South Beach Luxury Condo Report
Bal Harbour Luxury Condo Report
Sunny Isles Beach Luxury Condo Report
Greater Downtown Miami Luxury Condo Report
Edgewater / Midtown / A&E District Luxury Condo Report
Coconut Grove Luxury Condo Report
Coral Gables Luxury Condo Report
Miami Luxury Condo Market Report: Summary back to top
It’s a New Year and we have brand new hopes for the luxury condo market in Miami. Sales went off to a slower start compared to December, but they did do much better compared to January last year. After a long time, most neighborhoods reported a decline in their days on market, showing real progress. With two more months left in the quarter, we expect a strong first quarter for 2018. Read the full report below for a deeper analysis and more on market expectations.
For the purpose of this luxury condo report, we have only considered properties priced $600,000 and above.
Overall Market Highlights:
- Overall sales outpace January 2017
- Lower days on market add to optimistic tone
- Charts feature price surges owing to ultra-luxury sales
- Months of inventory creep higher with rush of new listings
- Market favors buyers, but expecting a strong first quarter to fuel a turnaround
Year opens to better sales than 2017. Even though we see January’s sales slow against December, most neighborhoods in our study reported an increase in sales volume compared to January 2017. This adds to our hope of a great first quarter this year, as February and March are (historically) known to deliver a boost.
Days on market begin their descent. It’s refreshing to see the days on market drop in most neighborhoods. This demonstrates that buyers and sellers are coming to a consensus sooner, thus helping properties sell faster.
Overall price trend moves upwards. We know that the luxury market has has price pressure given the longstanding buyer’s market. The latest upticks are not quite the sign of a turnaround but rather a combination of more expensive new construction units selling and a higher number of ultra-luxury sales (above $2 million) taking place.
Months of inventory crawl up, but not to much effect. With more condo projects being delivered by December last year and a general upswing in the number of listings, an increase in inventory was inevitable. However, most neighborhoods reported an increase of a single month, which is not of much consequence. If the first quarter delivers on its expected increase in sales pace, we should see a healthy reduction of inventory.
Overall, we have a market trying to maintain and improve its momentum. If the rest of the months in the quarter deliver on their history of higher sales, we could expect a healthier year this year than the last two years.
Where Does the Market Go From Here? back to top
Sitting in a buyer’s market for over a year, we expect the following factors to reverse trends and bring the luxury condo market back into balance:
- Impending impact of tax cuts. With the recent tax cuts favoring the wealthy, we expect a lot of our moneyed friends to come shopping for second homes in Florida. However, we will get a taste of the full impact of these cuts only by the end of the first two quarters.
- A softening U.S. Dollar. Our dollar has already weakened against the Euro to 2015 levels. It has also softened against key currencies like the Brazilian Real. This shift in trends should definitely motivate and bring back a chunk of our foreign buyers.
- The call of warmer shores. Sitting in the dead of winter, we expect snowbirds to turn to the warmth of Miami to avoid any further cold this year, or in the years to come, and always have a sunny place to call home.
- Lower prices motivating buyers. While our charts stay inflated due to more ultra-luxury sales (above $2 million), we know that the luxury segment has kept a check on its prices to appeal to this buyer’s market. As sellers remain flexible, increased buyer motivation will get those properties off the market sooner, as seems to be the case this month with reports of lower overall median days on market.
Below is an insight into Miami’s overall and neighborhood-level luxury condo trends for the month of January 2018: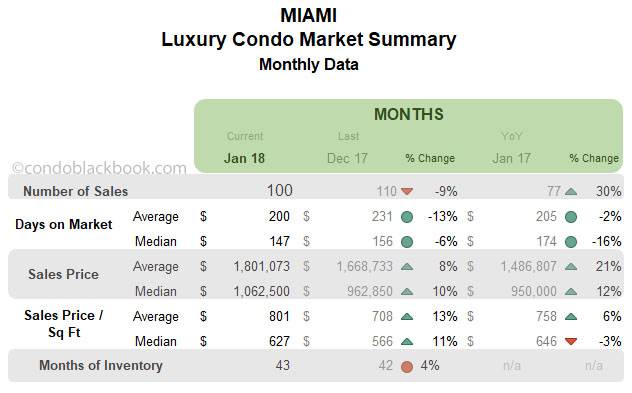
Monthly Number of Sales - Miami Luxury Condo Market Overall back to top
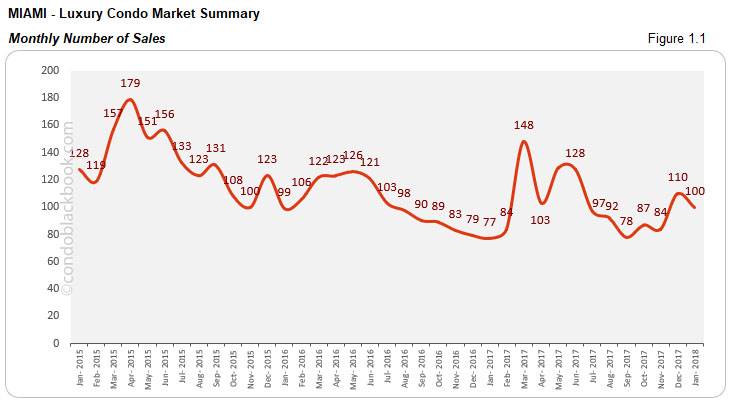
- Year-over-year sales up 30%, set optimistic tone. Even as January’s sales fell 9% short of December’s, the market’s still headed in the right direction. A closer look at fig. 1.1 reveals that the luxury condo market has a 30% increase to report (year-over-year). This means that the market has definitely carried forward its momentum. Also, if February and March come through with their usual boost to the first quarter, the market could receive the pick-me-up it’s been looking for.
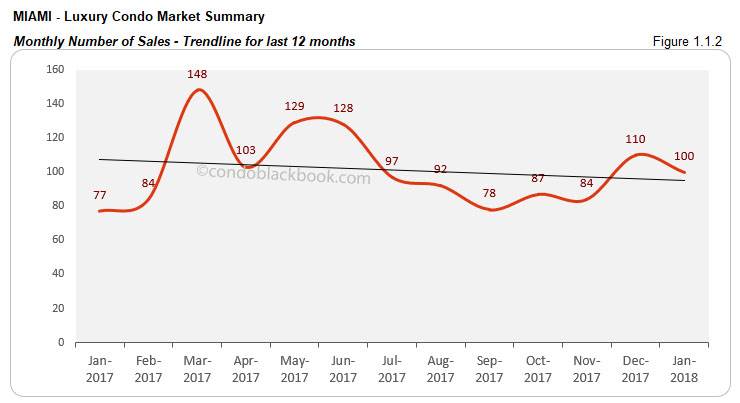
- Trend line tips downwards. In spite of a decent number of sales this month, we see the 12-month trend line tip lower in fig. 1.1.2. This means the luxury condo market needs a much higher number of sales in order to get its groove back. Hopefully, February and March will help deliver this much needed boost.
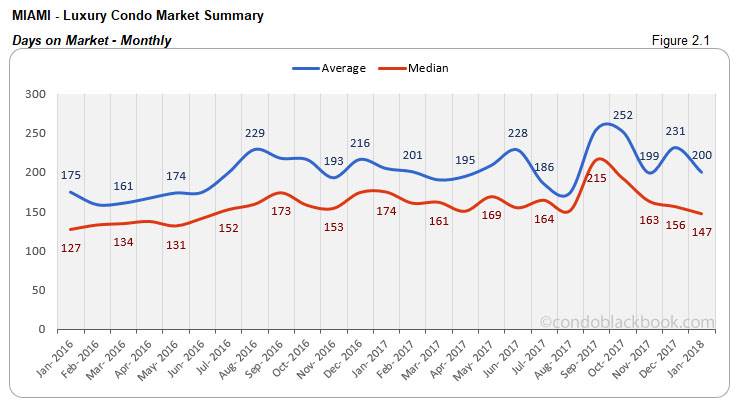
Days on Market - Miami Luxury Condo Market Overall back to top
“Days on market” are the total number of days from when a property is active to the day it goes under contract.
- Days on market continue descent. After months of inflation, we see the days on market deflate for a third month straight. This is definitely a positive indication. The median days on market closed 6% lower against December. And, the year-over-year trend too reports a 16% reduction (fig. 2.1).
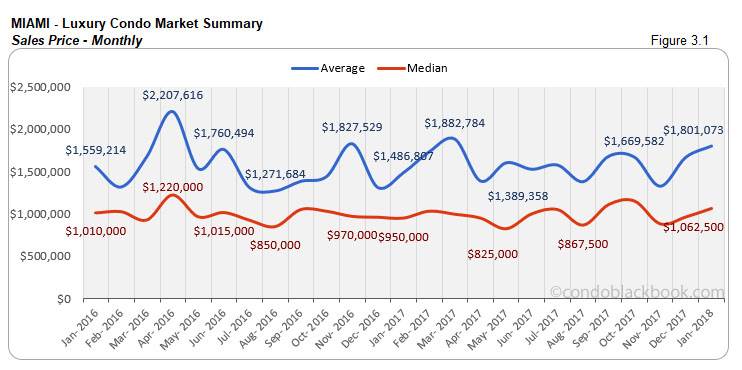
Sales Price Trends - Miami Luxury Condo Market Overall back to top
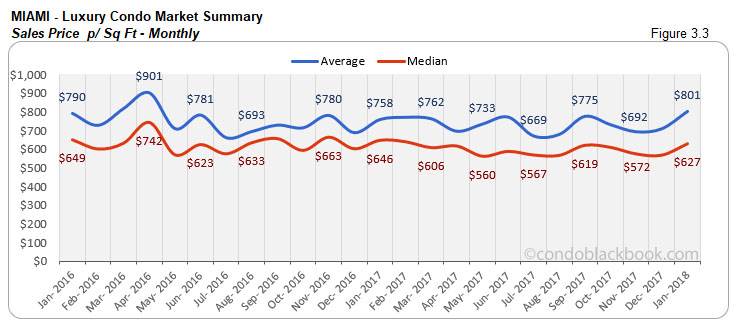
- Ultra-luxury sales fuel price increase. Pricier new constructions and ultra-luxury sales (above $2 million) mostly on the beaches have pushed up the overall sales price this January. We see the median sales price close 10% higher than December and 12% more than same time last year (fig. 3.1). The price per sq. ft. too closes 11% higher compared to last month (fig. 3.3).
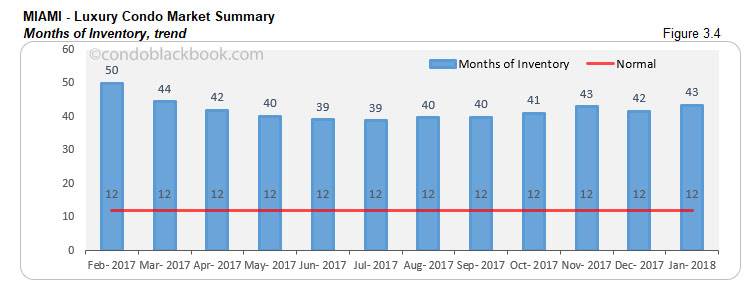
Inventory Trends - Miami Luxury Condo Market Overall back to top
A balanced market will only have 9-12 months of inventory.
- Influx of listings boost inventory by 4%, trend still favors buyers. Fig. 3.4 below reveals that the overall months of inventory has risen to 43 (4.1k active listings + 208 pending listings divided by a 6-month average of 92 deals a month). This increase is mostly fueled by a rush of new listings, rather than a lack of sales. If the next two months in the quarter play out as expected, we could be looking at a correction real soon. Until then, buyers can enjoy shopping with ample choices and an upper hand in negotiations.
City and Neighborhood Market Reports back to top
Miami Beach Luxury Condo Market Summary back to top
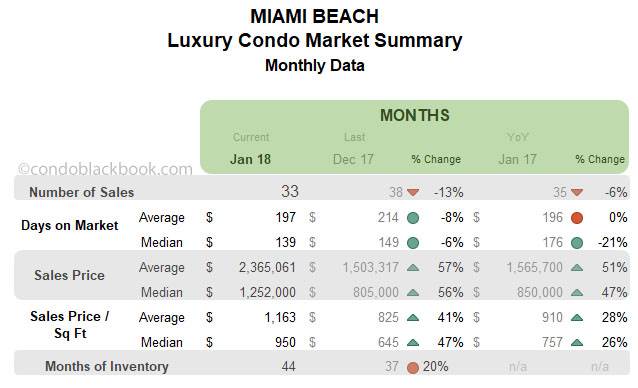
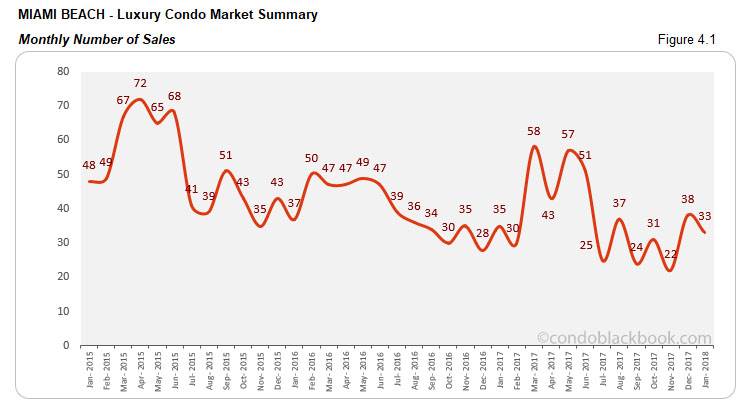
- Sales drop slightly, still future-positive. After December’s sales spike, Miami Beach sees a bit of a drop. There is a 13% month-on-month decline and 6% year-over-year decrease in sales to report this January (fig. 4.1). However, the first quarter usually delivers a boost somewhere, so we are expecting this beach neighborhood to make a comeback soon enough.
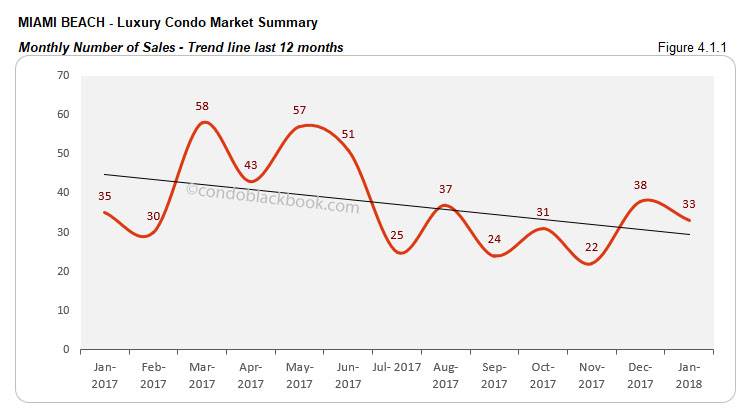
- Trend line continues to plunge. We see the negative trend continuing in fig. 4.1.1. With sales posting some sharp declines over the past few months, the 12-month trend line continues to slope downwards in January as well.
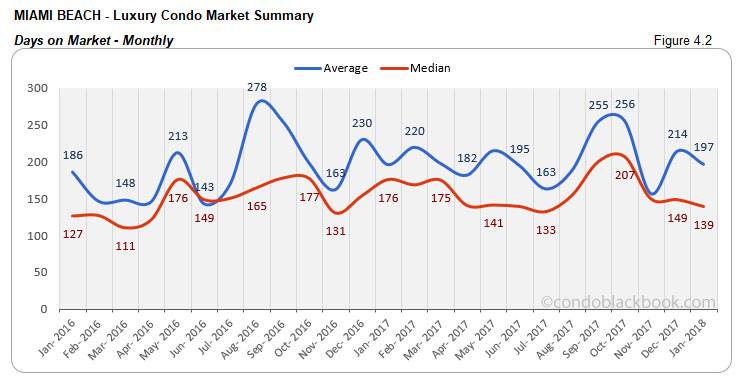
- Days on market drop, make progress. Even as sales slacked this January, we see the days on market decline in Miami Beach. The neighborhood reports a decrease of 6% month-on-month and 21% year-over-year (fig. 4.2) in its median days. This is a definite positive, as properties are spending less time sitting on the market.
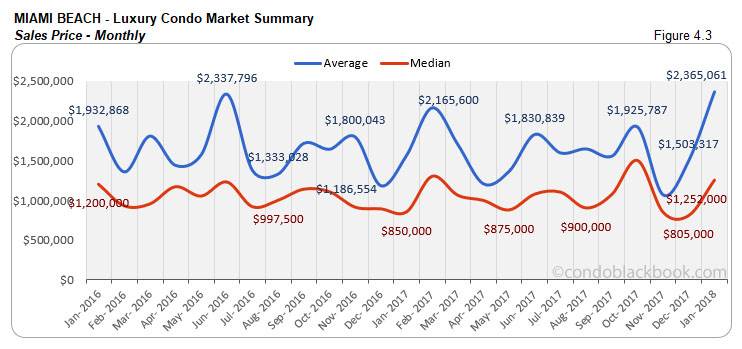
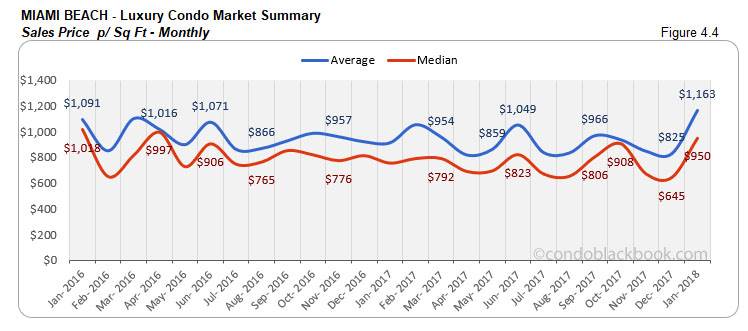
- Ultra-luxury sales influence prices upwards. Miami Beach saw a good number of ultra-luxury sales (above $2 million) take place in January. This is why we see the median price skyrocket compared to last month and same time last year (fig. 4.3). The most expensive sale here hit $13.75 million for a Continuum South Beach condo.
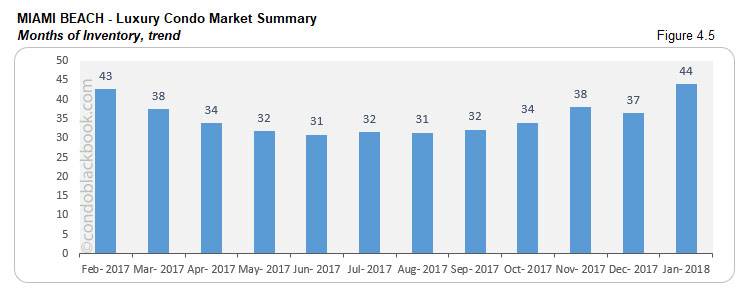
- Inventory stays put, buyers retain edge. January puts 44 months of inventory on the charts in Miami Beach (1279 active listings + 77 pending divided by a 6-month average of 31 deals a month). A long way off the 9-12 months of a normal market, buyers can easily make use of this surplus and have their pick of the litter by browsing through Miami Beach condos for sale here.
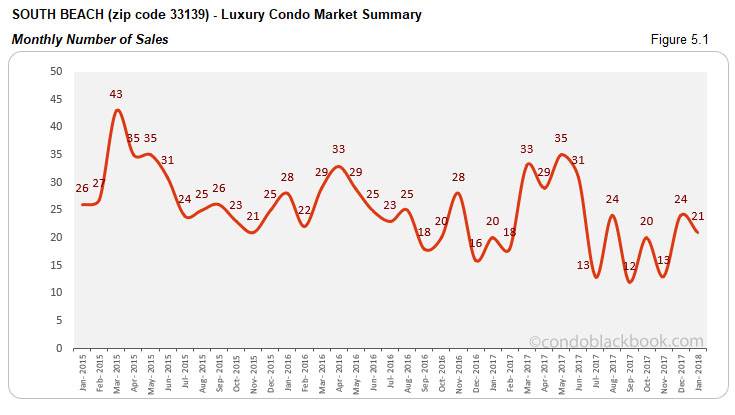
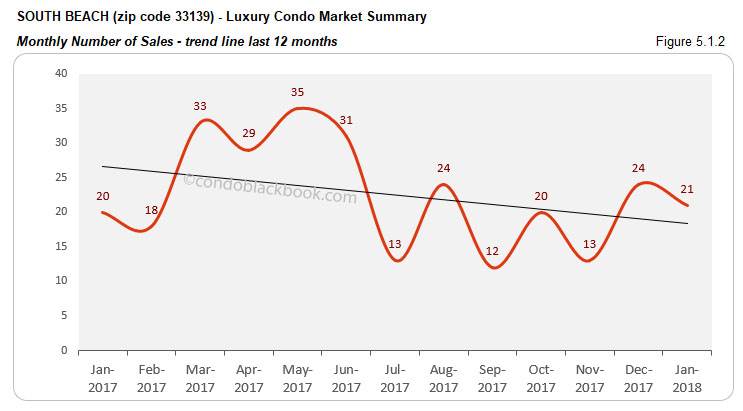
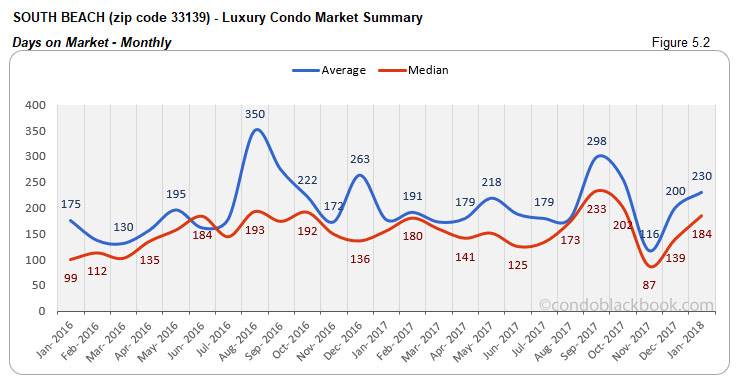
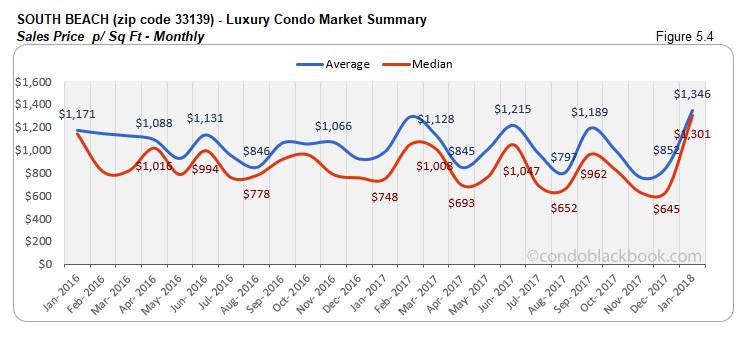
South Beach Luxury Condo Market Summary (33139 zip) back to top
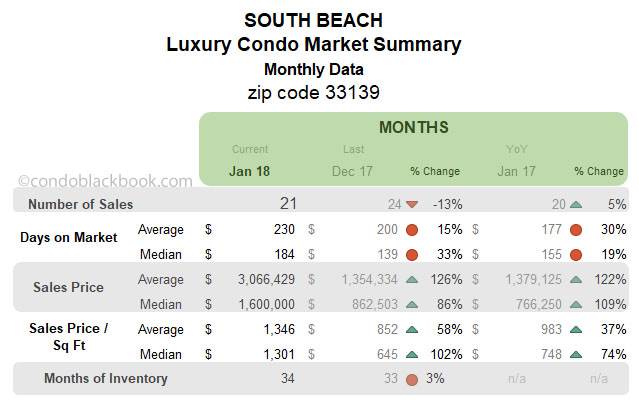
- Sales improve year-over-year, but trend line and days on market post negatives. January came in with a 5% improvement in its year-over-year sales (fig. 5.1). But, with the month-on-month numbers falling 13% short, we see the trend line tip lower in fig. 5.1.2. There is also an increase in the monthly and yearly comparison of median days on market (fig. 5.2). With the remaining months in the first quarter usually turning up with a boost, we hope to see these negative trends balance out sooner.
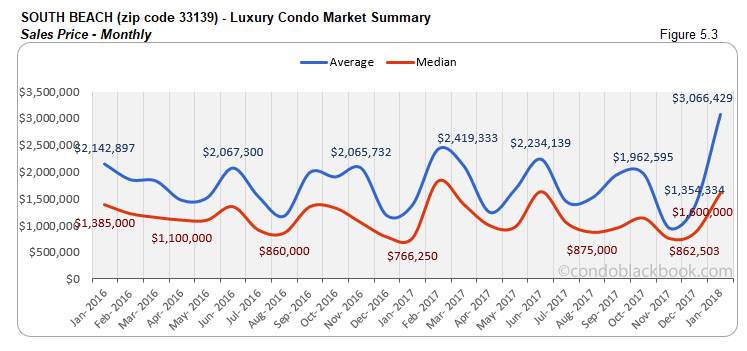
- Ultra-luxury sales push up prices. Price trends shot up sharply this January with more ultra-luxury sales (above $2 million) taking place. The price per sq. ft. is 74% higher than same month last year and the median sales price is 109% higher. (See fig. 5.3 and 5.4.) The most expensive deal for the month was recorded at $13.75 million (Continuum South Beach).
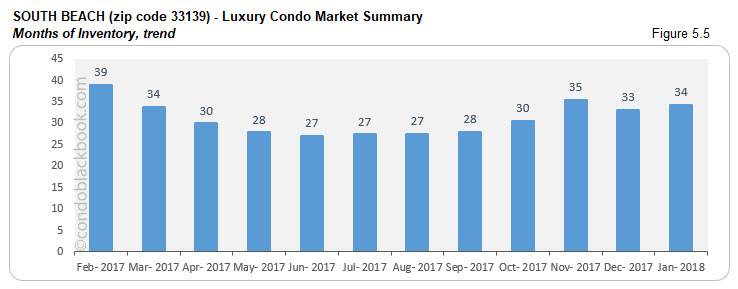
- Inventory up 3%. Fig. 5.5 below shows a higher months of inventory at 34 (705 active listings + 28 pending listings divided by a 6-month average of 19 deals a month). Though this is a minimal increase, it is still way off the 9-12 month mark of a balanced market. With higher inventory trends favoring buyers, we recommend looking at South Beach condos for sale here, or begin by checking out this vacation destination here.
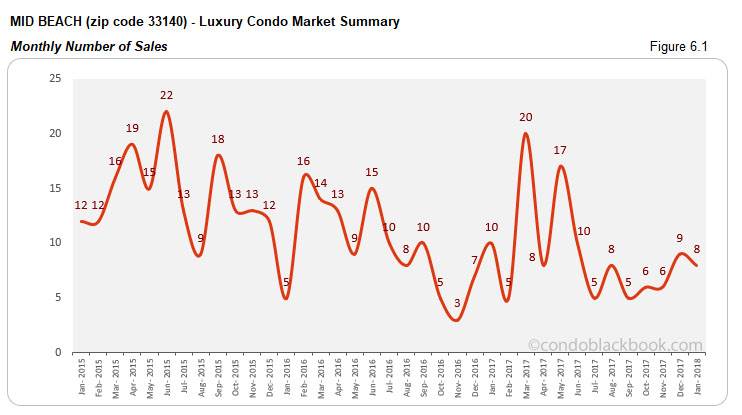
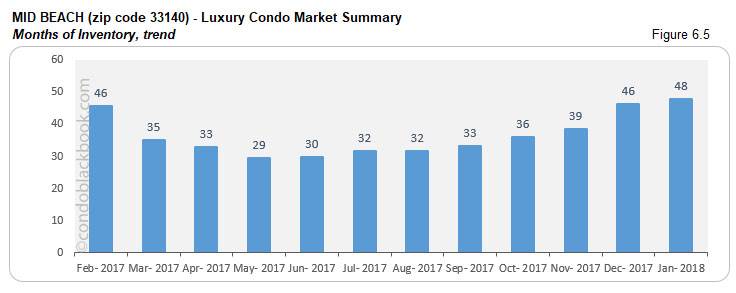
Mid-Beach Luxury Condo Market Summary (33140 zip) back to top
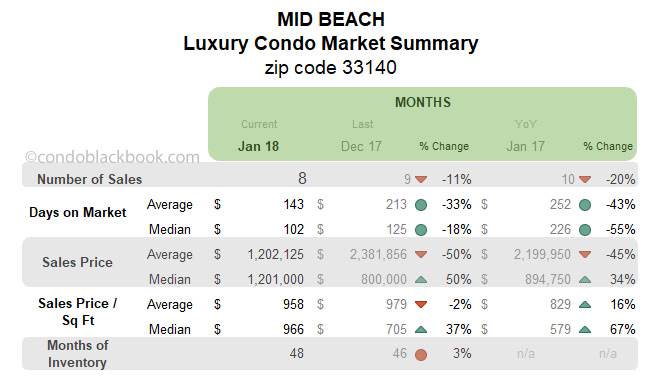
- Minimal sales dip results in negative trend line. We see a slight loss of momentum in Mid-Beach, with sales declining 11% against December and 20% against January 2017 (fig. 6.1). This has resulted in the 12-month trend line tipping lower in fig. 6.1.1 below. However, historically, February and March do bring in a boost, so we hope to see a reversal pretty soon.
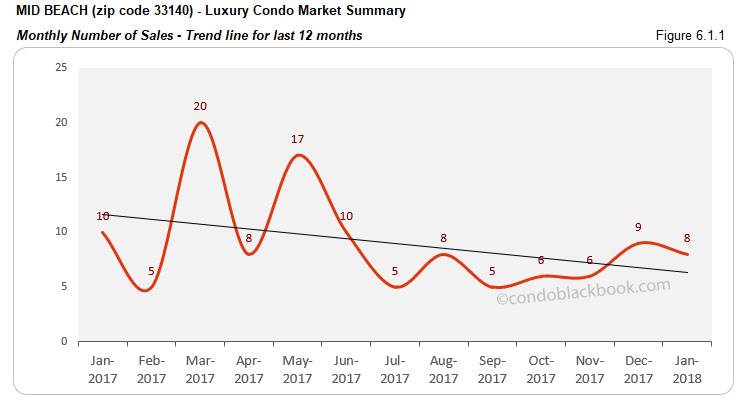
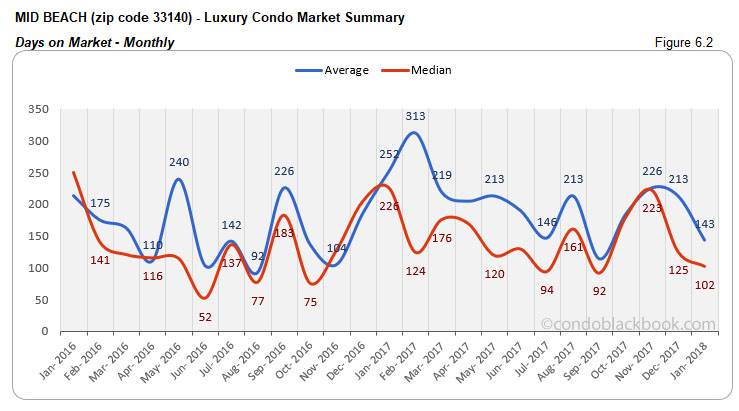
- Days on market deliver hope with decrease. With the median days on market 18% lower than December and 55% lower than January 2017, we see that the luxury condo market has kept its momentum here (fig. 6.2). Hopefully, this positive trend is sustained throughout the first quarter.
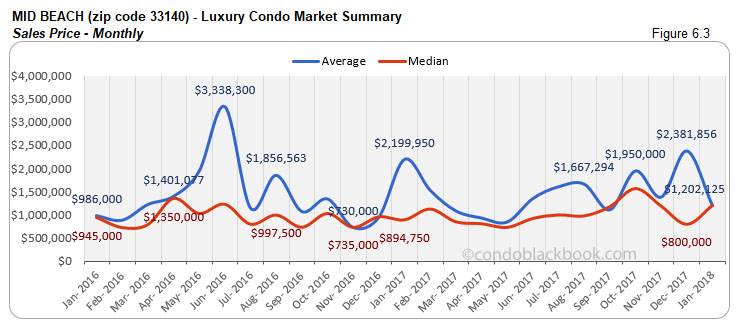
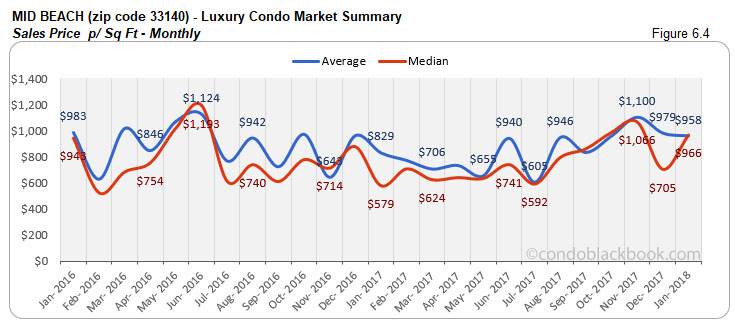
- Curious price hike. The charts below reveal a 50% jump in the month-on-month median sales price (fig. 6.3). Even the price per sq. ft. is up 37% since December (fig. 6.4). Curious thing is that this volatility in prices is not related to an increase in ultra-luxury sales (above $2 million). These types of anomalies do happen when there are only a handful of sales in a given month.
- Months of inventory continue trekking higher. Fig. 6.5 below puts January’s months of inventory at 48 (291 active listings + 30 pending listings divided by a 6-month average of 7 deals a month). With sales not losing too much steam, this hike seems to be related to an influx of listings that happen typically during high season. Nonetheless, the trend is much higher than the 9-12 months of a normal market. So, buyers should make the most of it by scouting for deals on Mid-Beach condos for sale here, or begin with a tour around this family-friendly neighborhood here.
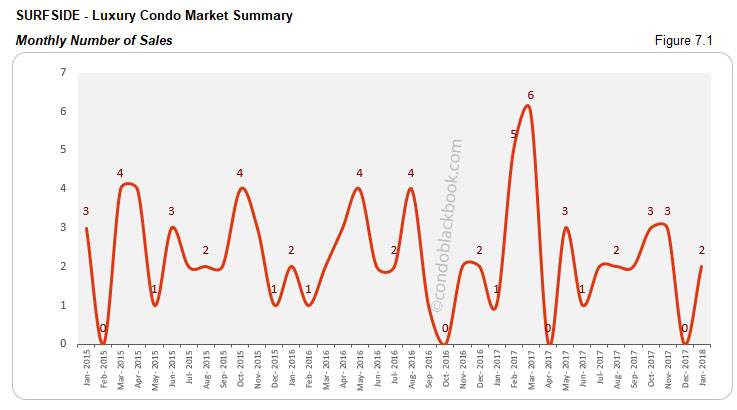
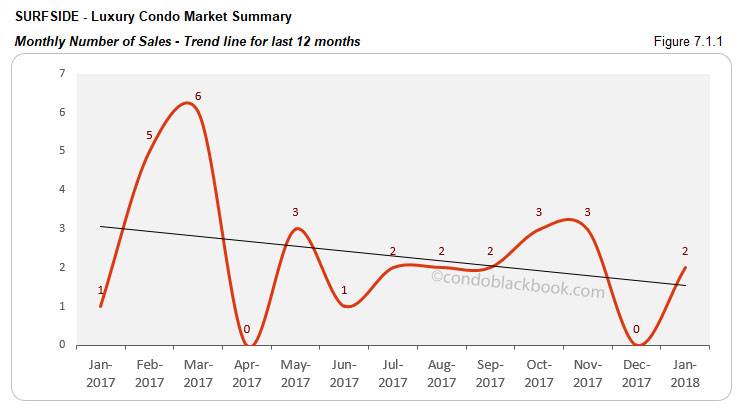
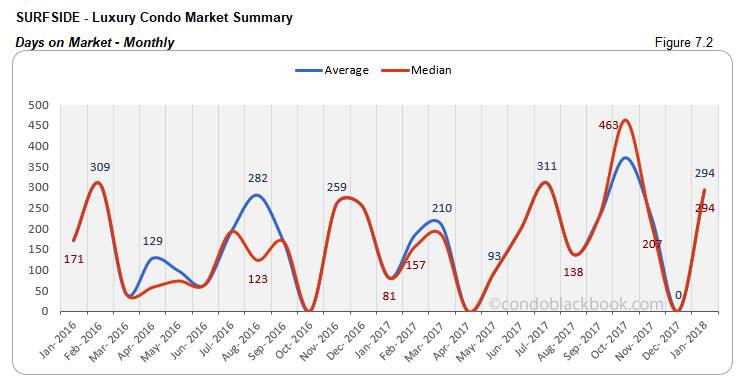
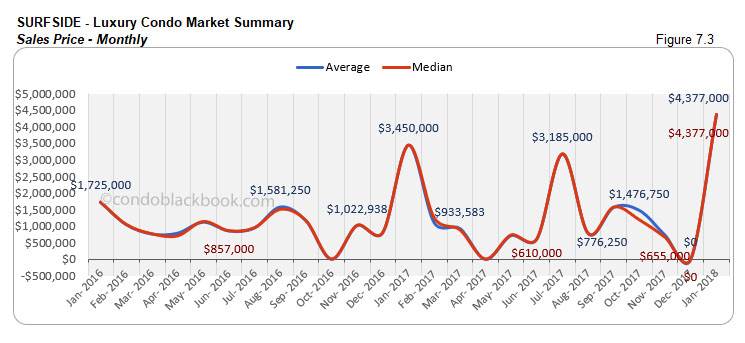
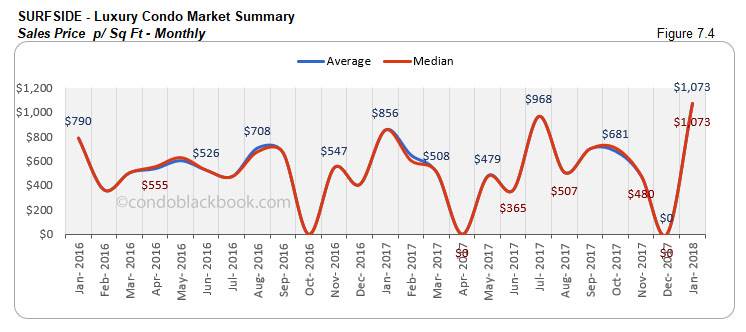
Surfside Luxury Condo Market Summary back to top
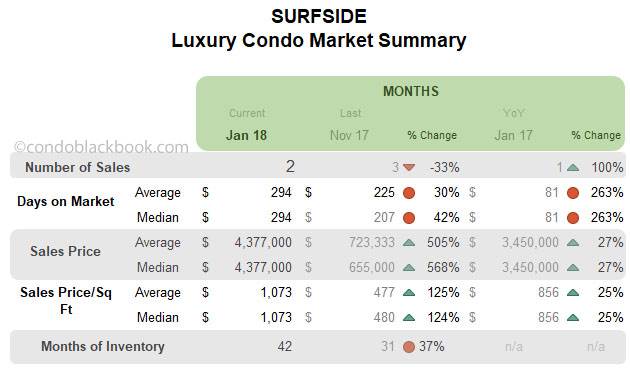
- Small market posts decent sales and high volatility in other metrics. After a no-show in December, Surfside came up with 2 sales this January (fig. 7.1). Considering this is a modest market for luxury condos in Miami, this sudden spike in sales results in skewed metrics below (fig. 7.1.1 and 7.2). Also, as one of these sales was ultra-luxury ($8 million for a condo in the Fendi Chateau Residences), we see a lot of noise in the price charts below (fig. 7.3 and 7.4).
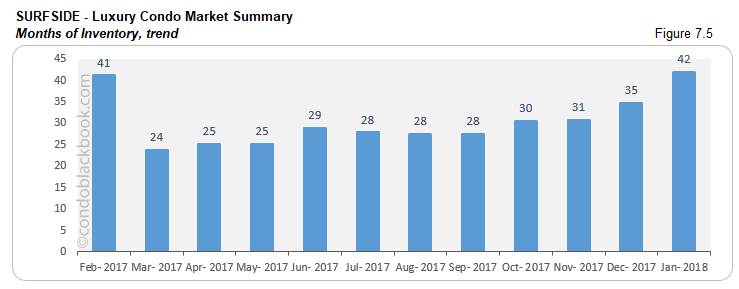
- Inventory up 37%, buyers hold advantage. Fig. 7.5 below reports 42 months of inventory for Surfside (78 active listings + 6 pending divided by a 6-month average of 2 deals a month). With ample new additions and numbers way off the 9-12 month mark of a balanced market, buyers should take notice and go shopping for a Surfside condo for sale here, or see what lifestyle makes up the chic community of Surfside.
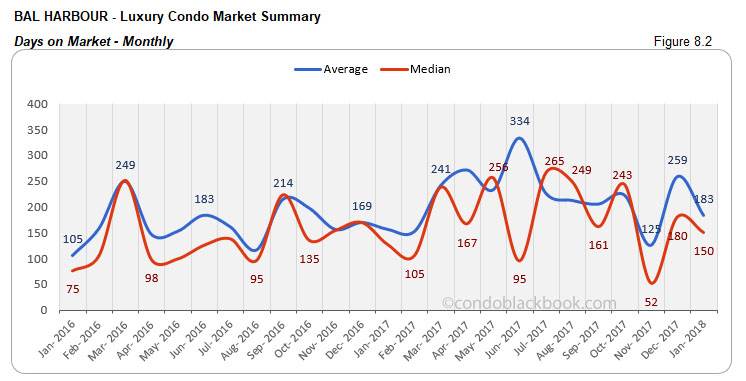
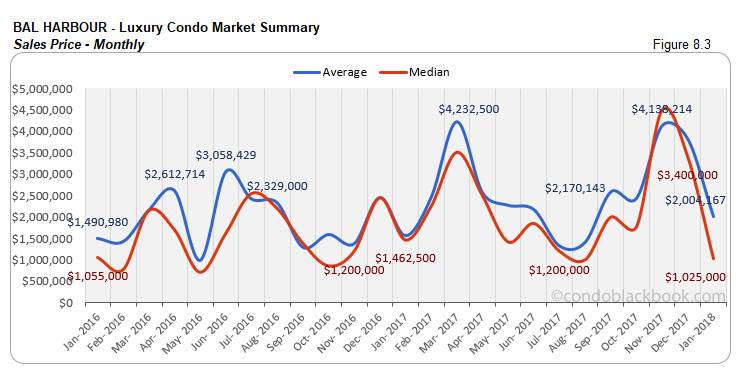
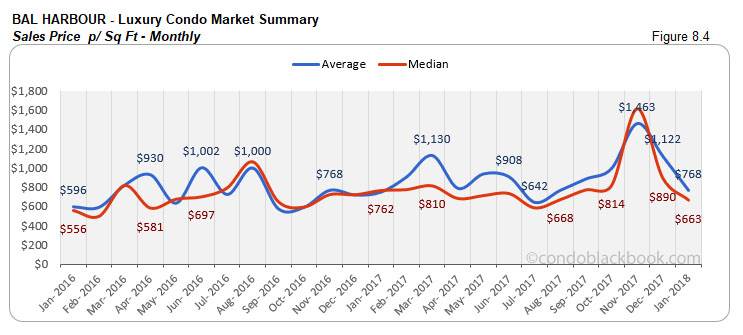
Bal Harbour Luxury Condo Market Summary back to top
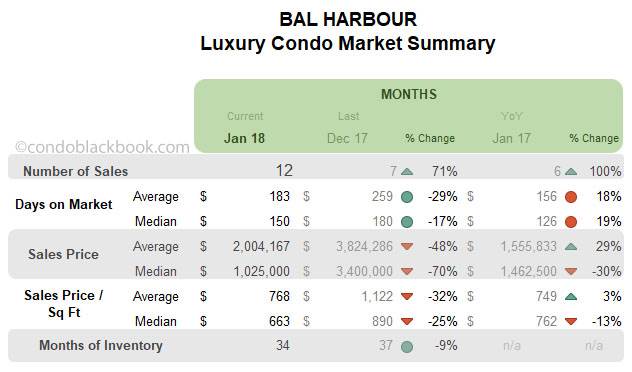
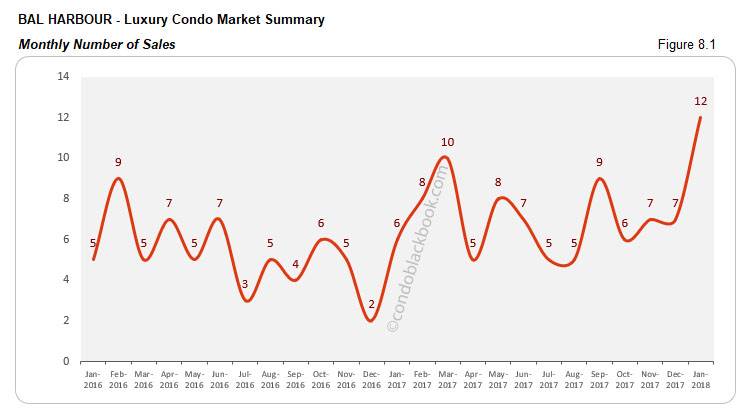
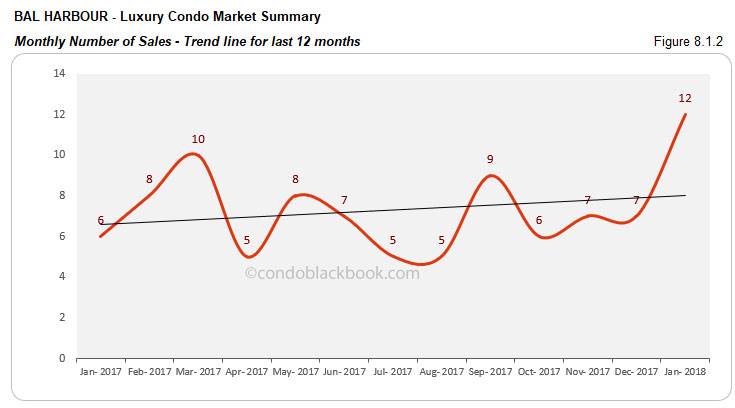
- Sales spike, trend line stays positive. Bal Harbour might be a small market for luxury condos, but it has some pretty impressive numbers to show for January. We see double the sales compared to January 2017, and a 71% hike in monthly numbers (fig. 8.1). This sudden boost makes Bal Harbour one of the few neighborhoods in our study to report a positive trend line for the month (fig. 8.1.2).
- Erratic number of ultra-luxury deals skew price charts. We find a huge dip in the prices in Bal Harbour this month. (See fig. 8.3 and 8.4 below.) With ultra-luxury sales (above $2 million) going strong one month and soft in the next, it’s no surprise that the price charts are easily influenced and unable to find a stable average.
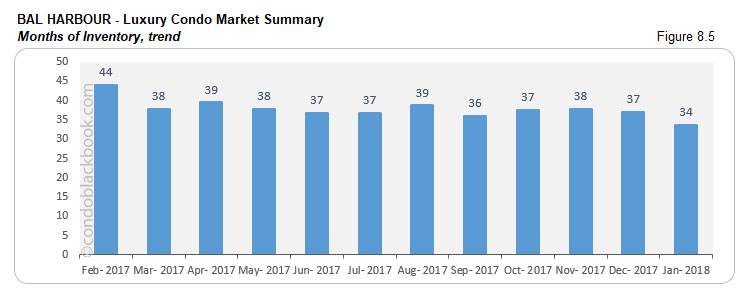
- Inventory declines 9%. In fig. 8.5, we see the months of inventory drop to 34 (236 active listings + 11 pending divided by a 6-month average of 8 deals a month). In spite of a decrease, the trend is way off the 9-12 months of a normal market. This makes it convenient for buyers to browse through deals on Bal Harbour condos for sale here, or begin by checking out this upscale neighborhood here.
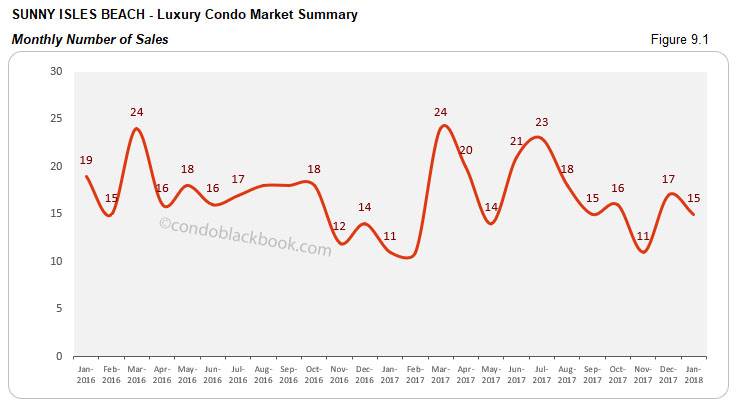
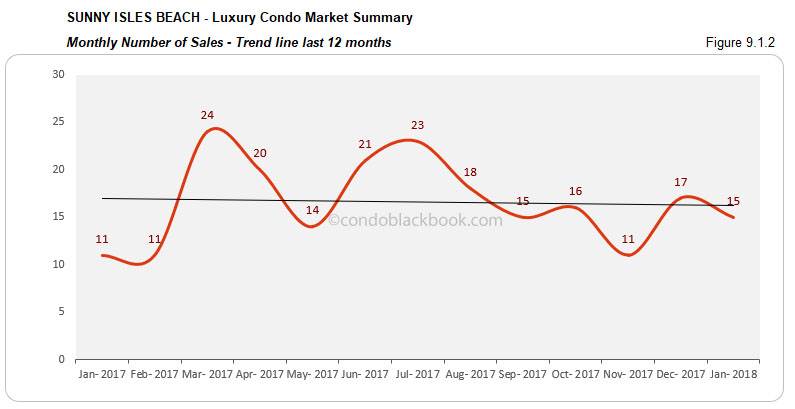
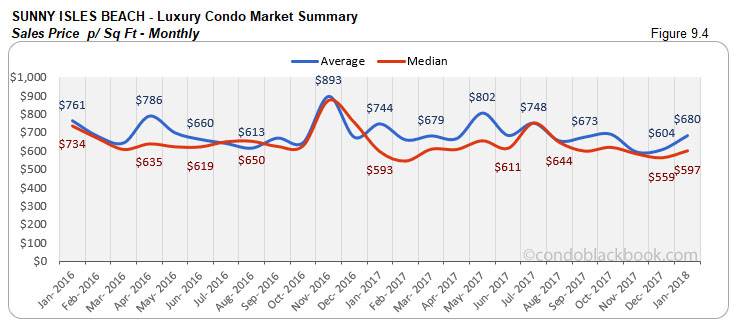
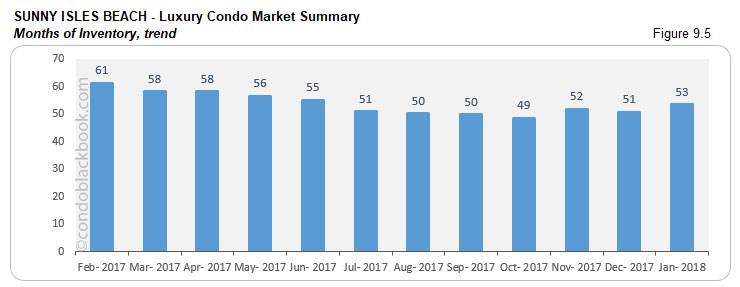
Sunny Isles Beach Luxury Condo Market Summary back to top
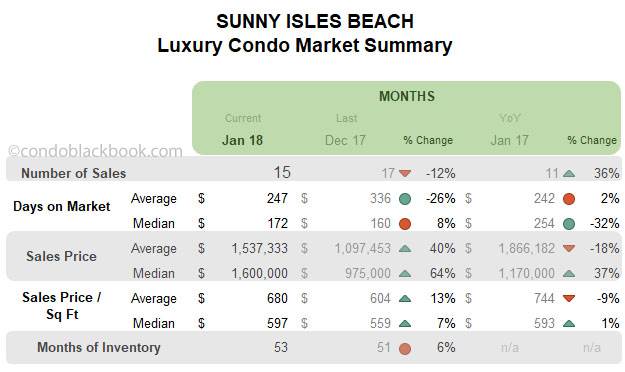
- Year-over-year sales impress, trend line hovers. This January, Sunny Isles Beach posts a 36% increase in sales against same month last year (fig. 9.1). However, a slight slip of 12% against December makes a visible impact on the trend line in fig. 9.1.2, which tries to hover. Hopefully, February and March’s usual pick-me-up will bring the trend back to positive.
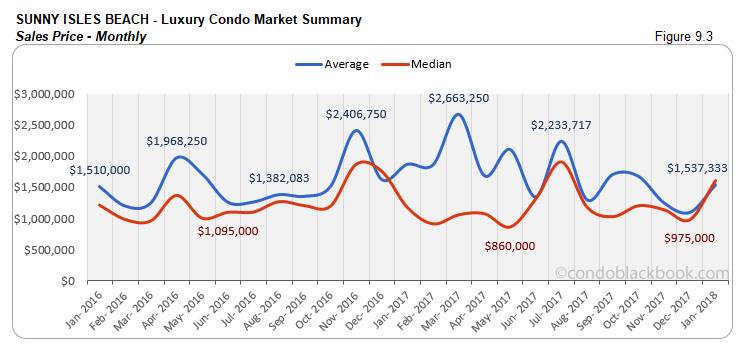
- Ultra-luxury sales bring up prices. We see the median price increase 64% against December and 37% against same month last year (fig. 9.3). Even the price per sq. ft. is 7% higher compared to December (fig. 9.4). This spike is fueled by ultra-luxury deals (above $2 million) taking place in this branded condo corridor.
- Inventory up 6%. Fig. 9.5 reports a higher months of inventory at 53 (863 active listings + 27 pending divided by a 6-month average of 15 deals a month). This is way off the 9-12 months of a normal market. Buyers still retain the edge and can have their pick of the litter by searching Sunny Isles Beach condos for sale here, or can explore the lifestyle of this branded condo corridor here.
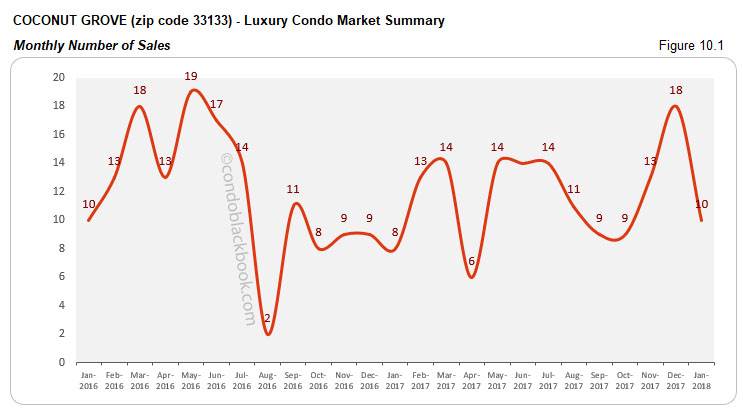
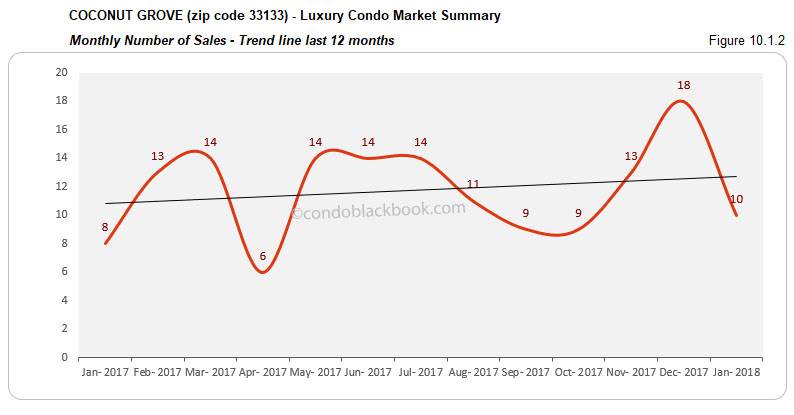
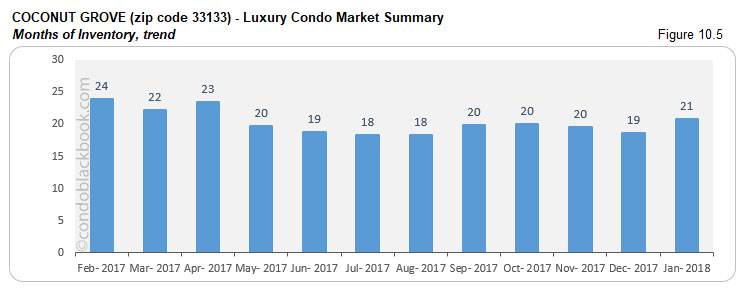
Coconut Grove Luxury Condo Market Summary (33133 zip) back to top
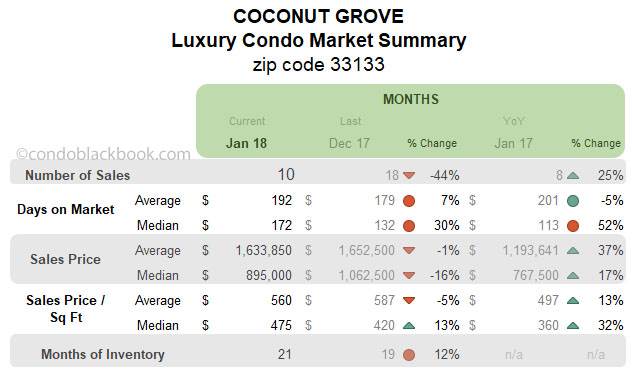
- Year-over-year sales and trend line stay positive. January posts 25% higher sales than same month last year (fig. 10.1). Even though we see a decline of 44% against December, the trend line stays unaffected and continues its positive streak in fig. 10.1.2 below. With the remaining months in the quarter (historically) expected to bring a boost, we hope to see this early bird of recovery soar through the first quarter.
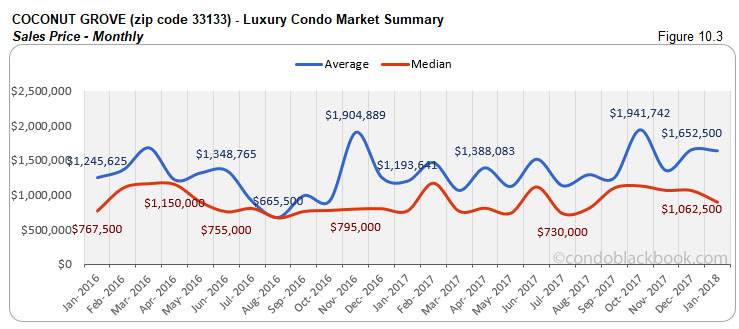
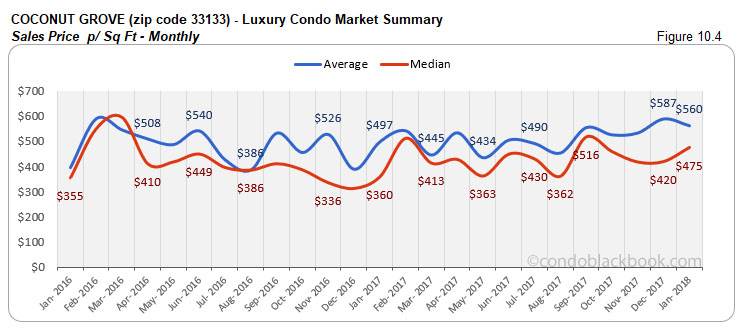
- Price charts show volatility. Since Coconut Grove is a rather modest market for luxury condos in Miami, volatility in prices (fig. 10.3 and 10.4) can be expected.
- Inventory increases 12%. In fig. 10.5, we see the months of inventory rise to 21 (220 active listings + 29 pending divided by a 6-month average of 19 deals a month). Still the closest to reaching the ideal 9-12 months of inventory, buyers should hurry and look at what’s new by searching Coconut Grove condos for sale here, or check out what lifestyle makes this the fastest selling neighborhood in our luxury condo study here.
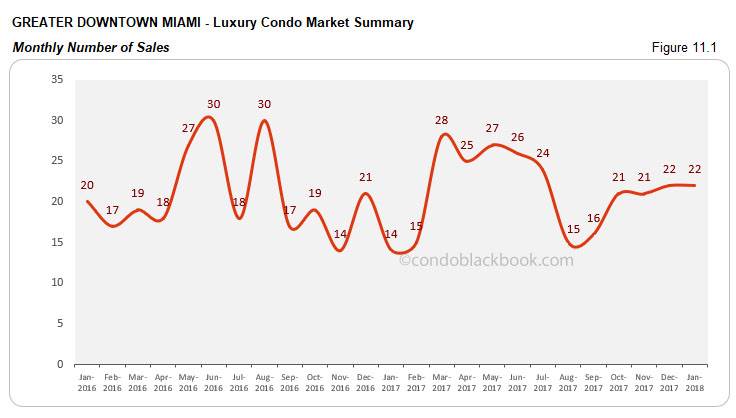
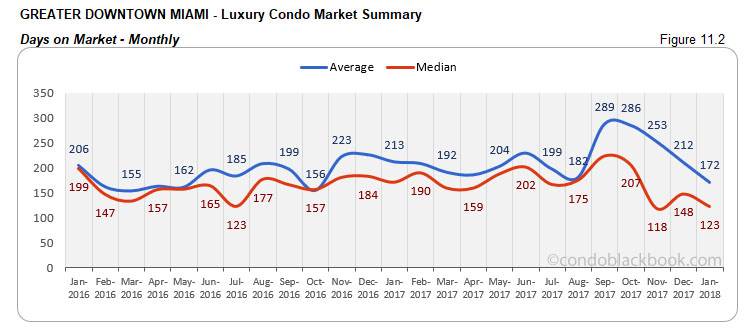
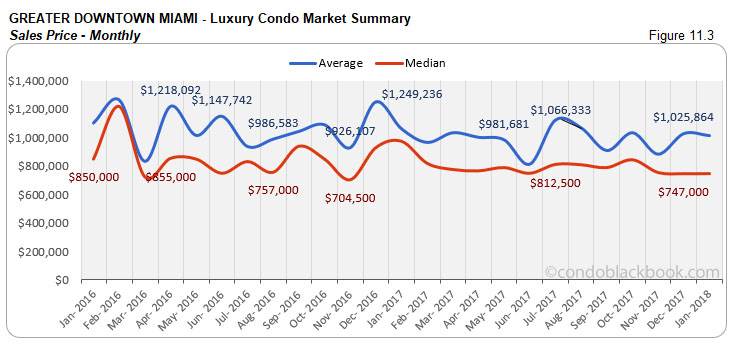
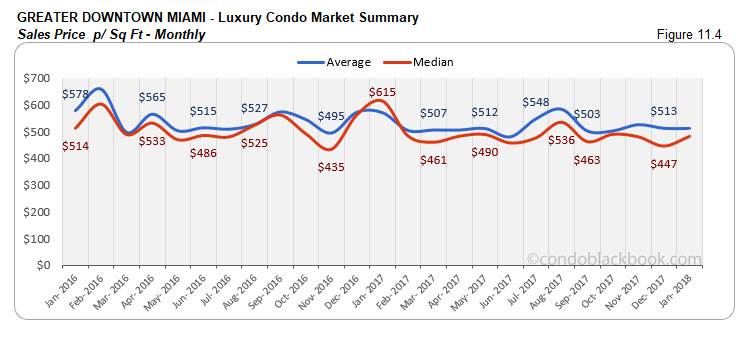
Greater Downtown Miami Luxury Condo Market Summary (33129, 33130, 33131, 33136, 33137 zips) back to top
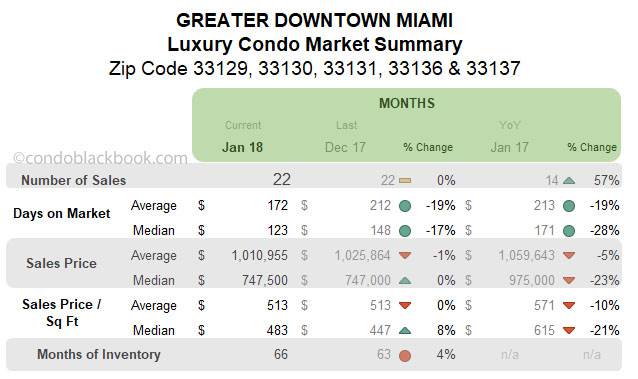
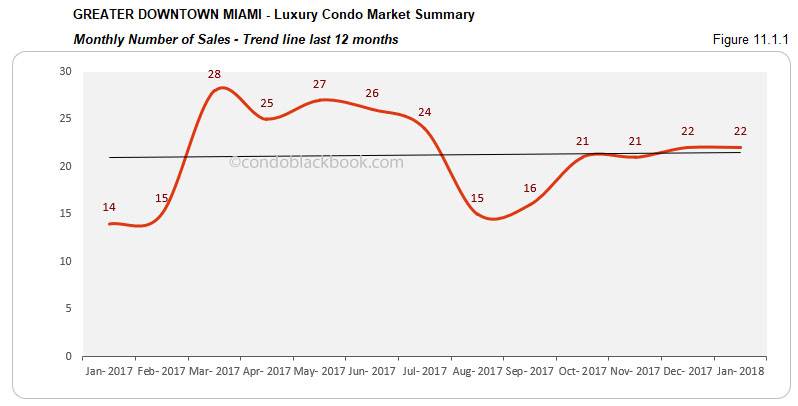
- Sales and trend line post positive streak. Greater Downtown is one of the few neighborhoods in our study to match its sales performance from December. Fig. 11.1 reveals that this dynamic neighborhood reported the same sales as last month and 57% higher sales compared to January 2017. This has helped keep the 12-month trend line positive for the month (fig. 11.1.1).
- Days on market decline. Continuing its positive streak, we see the neighborhood post a 17% decline against December and 28% decline against same month last year in fig. 11.2 below.
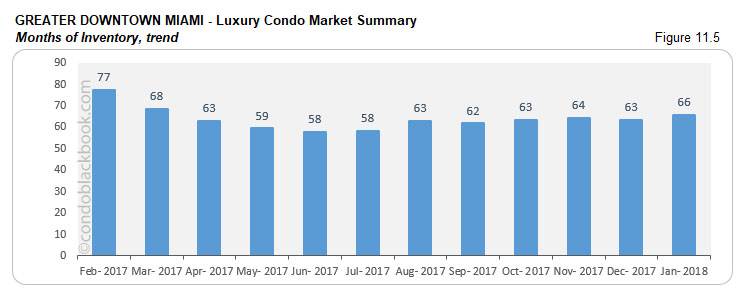
- Months of inventory increase 4%. Fig. 11.5 shows a higher months of inventory at 66 (705 active listings + 28 pending divided by a 6-month average of 19 deals a month). With one of the highest inventories in our study and way off the 9-12 month mark, buyers hold a great advantage and should look for luxury condo deals in the dynamic Greater Downtown Miami area here.
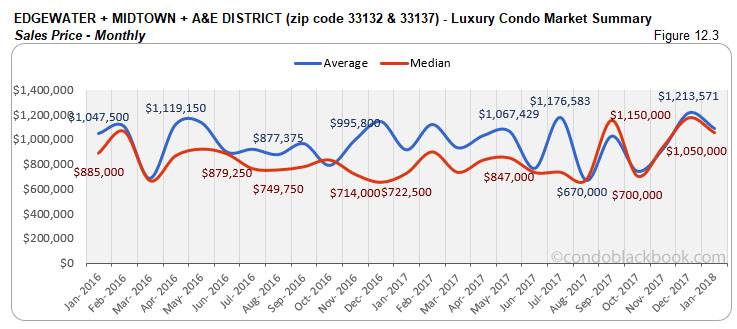
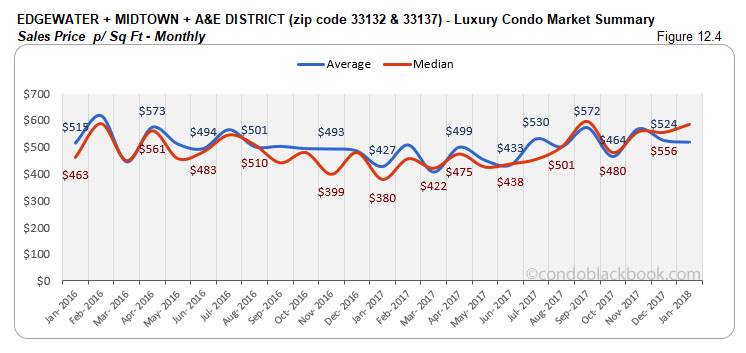
Edgewater + Midtown + A&E District Luxury Condo Market Summary (33132 + 33137 zip) back to top
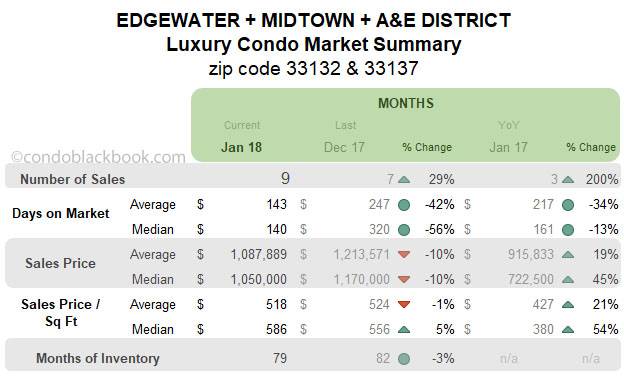
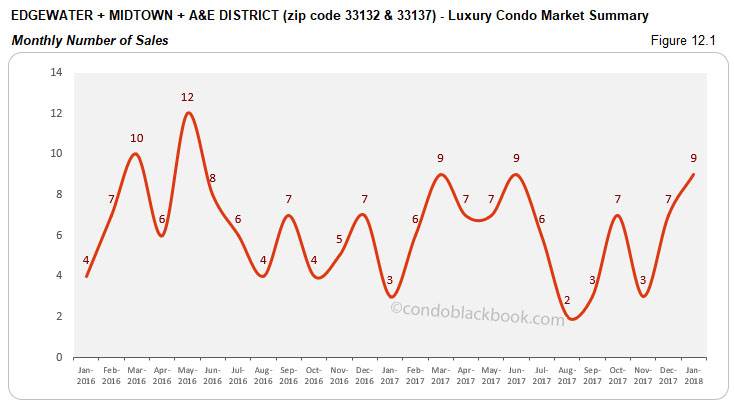
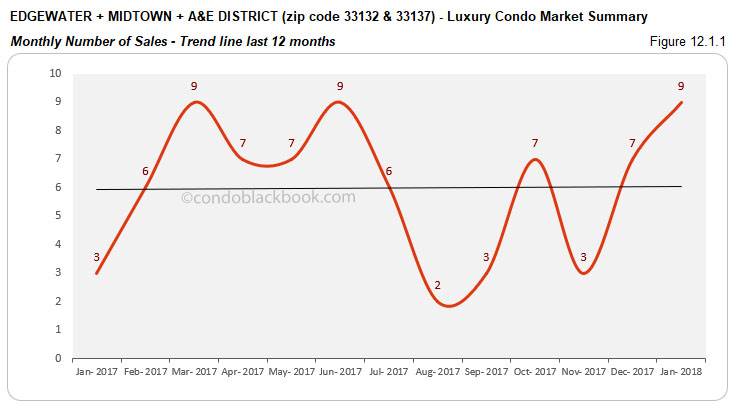
- Impressive sales keep trend line positive. This grouping is one of the few districts in our study to report a positive on both month-on-month and year-over-year analysis (fig. 12.1). Keeping December’s steam, the grouping posts a 29% increase, and triple the sales compared to January 2017. With such great numbers to boast, the 12-month trend line has no trouble staying up (fig. 12.1.1).
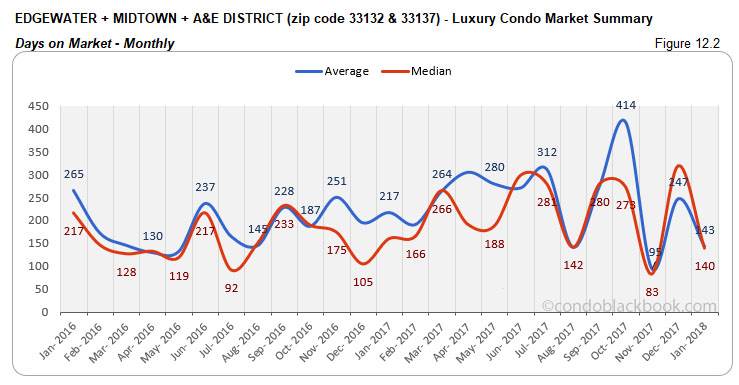
- Days on market dive. With properties moving off the market, we see the effects trickle down into a healthy reduction for the median days on market. There is a 56% reduction to report against December and 13% reduction against same month last year (fig. 12.2). This is definitely a positive marker for this grouping.
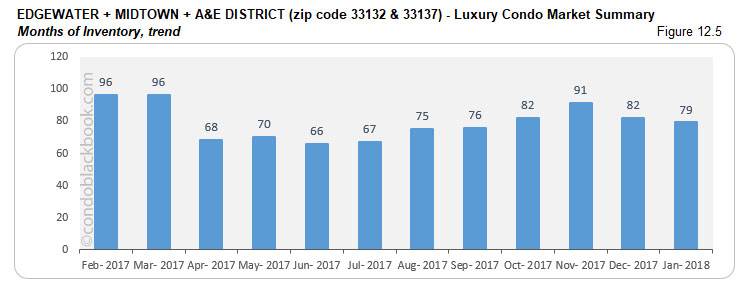
- Inventory decreases 3%. In another positive for this grouping, we see the months of inventory reduce to 79 in fig. 12.5 (451 active listings + 15 pending divided by a 6-month average of 5 deals a month). In spite of a decrease, the trend way off the 9-12 months of a normal market. Previously one of the slowest moving districts in our study, buyers still hold the advantage as they search for Edgewater condos for sale here or see the individual lifestyle and condo options in Edgewater, Midtown and Arts & Entertainment District.
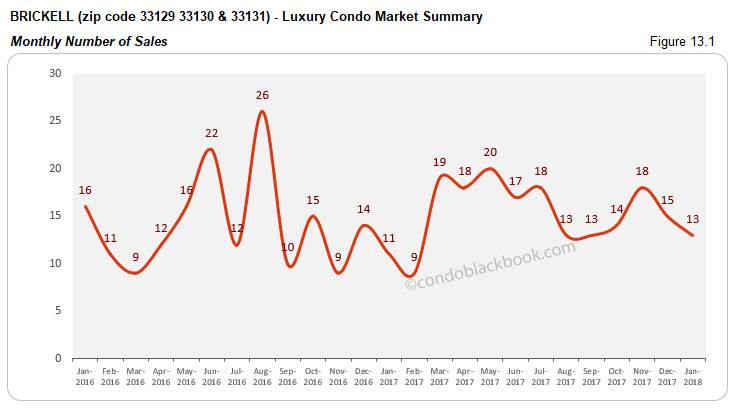
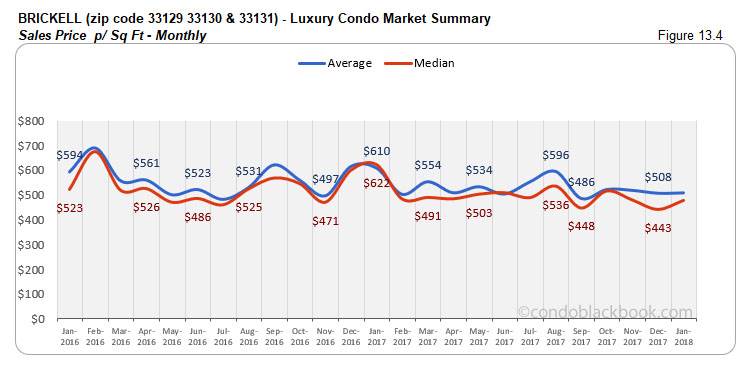
Brickell Luxury Condo Market Summary (33129, 33130, 33131 zip) back to top
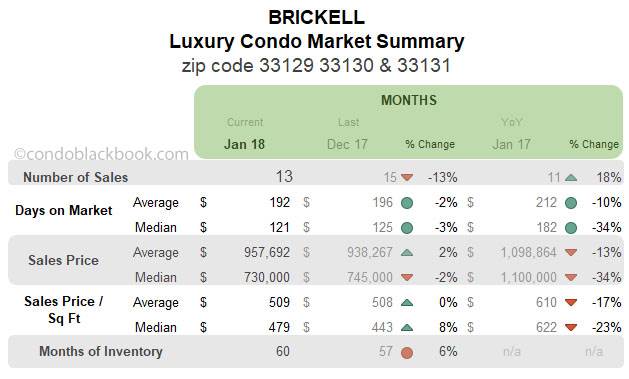
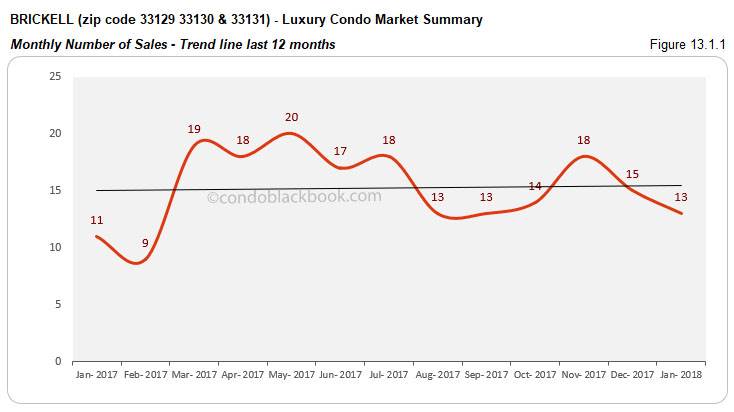
- Year-over-year sales report improvement, trend line stays afloat. Brickell begins the year with 18% more sales compared to January last year (fig. 13.1). Even with a 13% dip in sales compared to December, we see the trend line in fig 13.1.1 stay positive, showing good momentum in this business district.
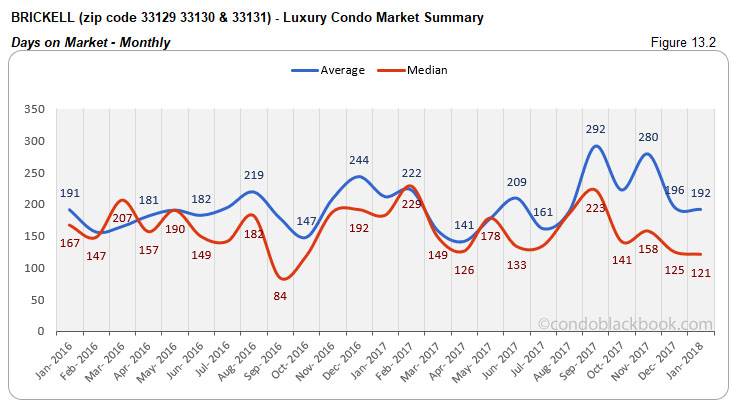
- Days on market continue descent. Another positive for this neighborhood, we see the days on market drop some more in Brickell. We see have the median days on market declining 3% month-on-month and 34% year-over-year this January (fig. 13.2).
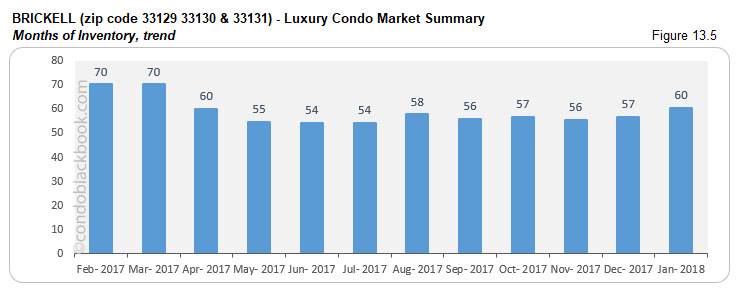
- Inventory 6% higher. Fig. 13.5 puts the months of inventory at 60 (920 active listings + 26 pending listings divided by a 6-month average of 14 deals a month). This is again much higher than the 9-12 months of a normal market. With ample choices available till a balance is reached, buyers should take advantage by hunting for deals by searching Brickell condos for sale here or taking a tour through Brickell here.
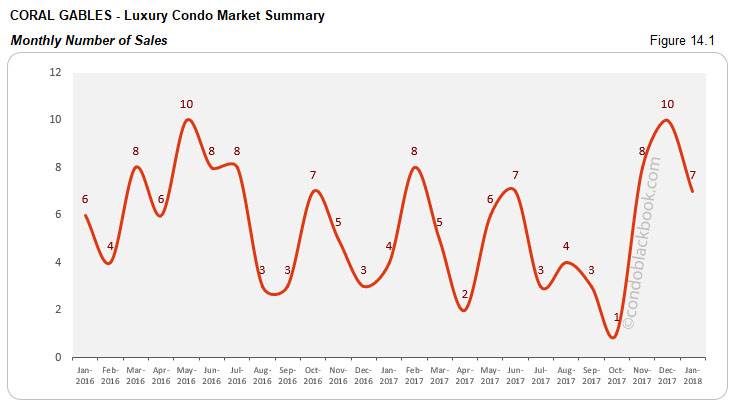
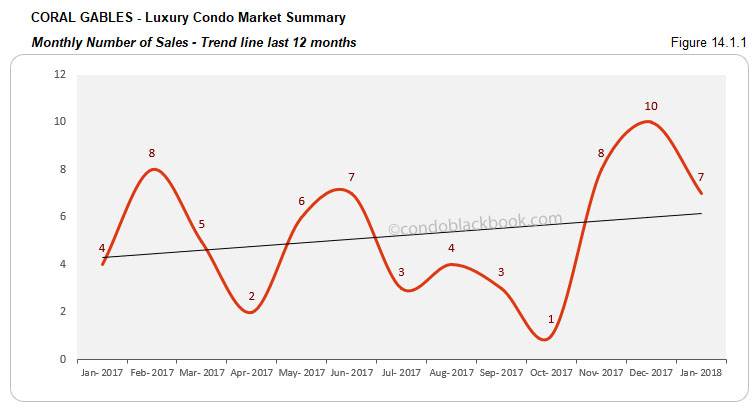
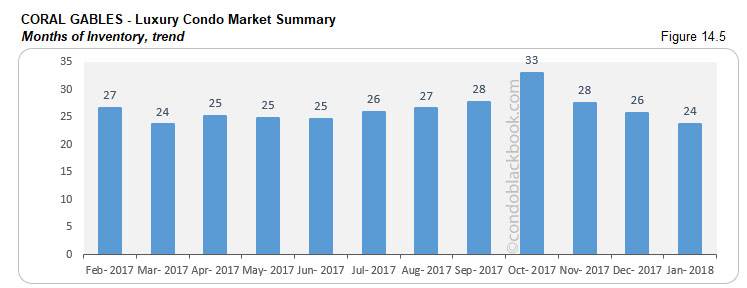
Coral Gables Luxury Condo Market Summary back to top
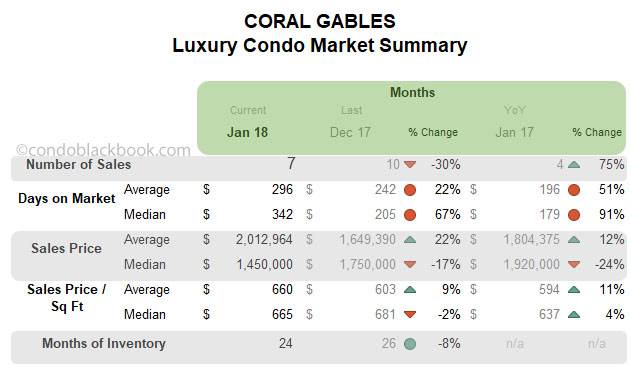
- Year-over-year sales and trend line maintain positivity. In spite of being a modest market for luxury condos, Coral Gables reports a 75% increase in sales compared to January last year (fig. 14.1). Even the 12-month trend line in fig. 14.1 substantiates the momentum gathered.
- 14% decline in inventory. Fig. 14.5 reports 22 months of inventory in Coral Gables (99 active listings + 23 pending, divided by a 6-month average of 6 deals a month). Another one closer to reaching the 9-12 month mark of a balanced market, buyers should be quicker to take advantage by directly searching Coral Gables condos for sale here, or starting by checking out the lifestyle options in Coral Gables.
Conclusion back to topSigns of a stronger 2018 are here, but overall market weakness is a big opportunity for buyers. Even though January couldn’t match December’s stellar sales, it still did well compared to same time last year. The decline in days on market further drives our point home. With a decent start to 2018 and the following months usually delivering a boost, we expect to see inventory get lighter. Our only word of advice to buyers is to be aggressive with their offers and grab their deals while the luxury condo market runs in their favor.
Love what you see? Don’t forget to share our blog and subscribe (see the subscribe link on the top menu) to receive the latest market news in your inbox.
Have any questions? Or see something wrong with the stats? Please contact Sep at sniakan (at) hbroswell.com or call 305-725-0566.
Share your thoughts with us

Your Miami Condo Awaits
Recent Posts


 (305) 697-7667
 (786) 321-7233
  contact@condoblackbook.com

