Luxury Miami Condo Report: Mar 2018

Apr 21, 2018 April 21, 2018
Miami Luxury Condo Report Overall Market Summary
City and Neighborhood Luxury Condo Reports
Miami Beach Luxury Condo Report
South Beach Luxury Condo Report
Bal Harbour Luxury Condo Report
Sunny Isles Beach Luxury Condo Report
Greater Downtown Miami Luxury Condo Report
Edgewater / Midtown / A&E District Luxury Condo Report
Coconut Grove Luxury Condo Report
Coral Gables Luxury Condo Report
Miami Luxury Condo Market Report: Summary back to top
The first quarter has ended, and everyone is looking to see if it sets the tone for the rest of the year. This March, the numbers may not be as bright and shiny as we hoped, but we do see subtle signs of positivity that give the market hope. Read on for what March and the first quarter’s charts hold for the luxury condo market in Miami.
For the purpose of this luxury condo report, we have only considered properties priced $600,000 and above. Also, properties priced $5 million and higher have been referred to as ultra-luxury.
Overall Market Highlights:
- Q1 sales only marginally improve over previous year’s performance
- Overall days on market begin descent, which is good
- Ultra-luxury sales keep price metrics inflated, but luxury segment retains modest pricing
- Most neighborhoods report reduction in year-over-year inventory
- Market continues to favor buyers as momentum remains timid.
Quarterly sales report marginal boost. We see most of the neighborhoods in our study report an increase in sales over Q1 2017. However, a close look into the monthly numbers reveals that the end of the winter did not deliver on the boost we were expecting to see. Nonetheless, sales trends remained positive as the first quarter came to a close.
Overall days on market decline. A drop in the days on market is a positive market indicator, showing that properties are selling faster, as buyers and sellers find common ground.
Prices for the quarter move higher. We see most of the charts in our study report higher prices in Q1. This is mostly due to expensive sales (above $2 million) keeping trends inflated and some recently completed pre- constructions adding to the skew. However, the sentiment of the luxury segment ($600K to $2 million) has remained modest.
Months of inventory decline marginally. With buyer and seller expectations finding middle ground, we see a marginal reduction in inventory. However, there wasn’t enough excitement in the market this first quarter to generate the kind of demand required to make a rapid shift. It will likely take until next winter to see inventory numbers decline significantly, as we chip away at the present pool.
Overall, the market is yet to find its boost to move to a more balanced position. Until then, buyers can play with ample inventory at their disposal.
Where Does the Market Go From Here? back to top
Buyers have been in control of the market for over a year now. However, if the following factors come through, the luxury condo market could regain its footing in Miami:
- Tax cuts push new residents our way. As the impact of the tax cuts such as the SALT tax settles in, we see more inquiries by the affluent to move to Miami. However, there has been only a small uptick in the luxury condo sales numbers. While it doesn’t seem there is a flood of buyers due to the SALT taxes, we believe there will still be a consistent flow of new Miami residents coming our way. Here’s a brief on all the taxes you save as a resident of Florida.
- Fresh inventory infusing new energy. There is a significant amount of pre-construction condos set to be delivered this year. While this will, no doubt, infuse more inventory into the market, it will also bring with it a mixed bag of brand new excitement to keep buyers intrigued.
- Softer U.S. Dollar to bring back foreign buyer interest. We see the Dollar has weakened to December 2014 levels against the Euro, which should give Europeans the confidence to come back. We also anecdotally see more people from France and Italy inquiring. The Canadian Dollar too has had modest gains in recent months. Even the Colombian Peso’s buying power has increased this year. However, we see the Brazilian Real and Argentinian Peso losing some value. So, with a mixed bag from overseas, we mostly see an increase in buying power. Though we don’t expect a drastic change in people’s appetites for buying in Miami, we also don’t see anything to deter them from the dollar stand point.
- Sun, sand and warmer shores. While winter is over, many northerners in the U.S. are still experiencing chilling weather. If this especially difficult and prolonged winter stays in people’s minds, they could plan ahead and scoop up something in Miami to avoid the same next year.
Below is an insight into Miami’s overall and neighborhood-level luxury condo trends for Q1 and the month of March 2018:
Monthly Number of Sales - Miami Luxury Condo Market Overall back to top
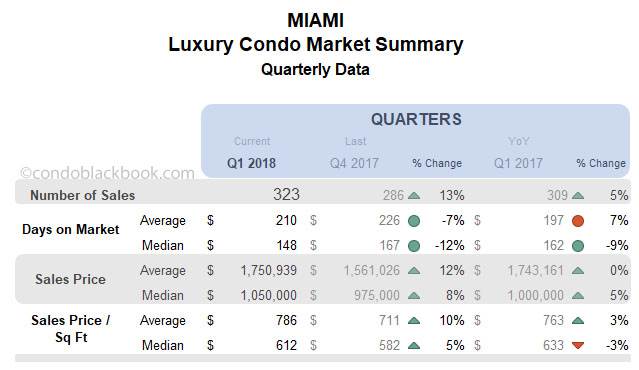
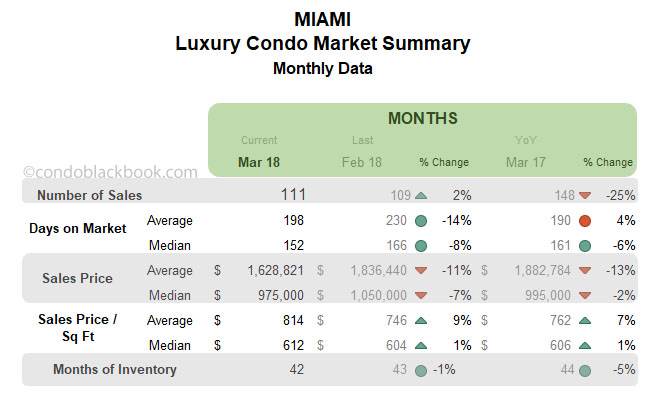
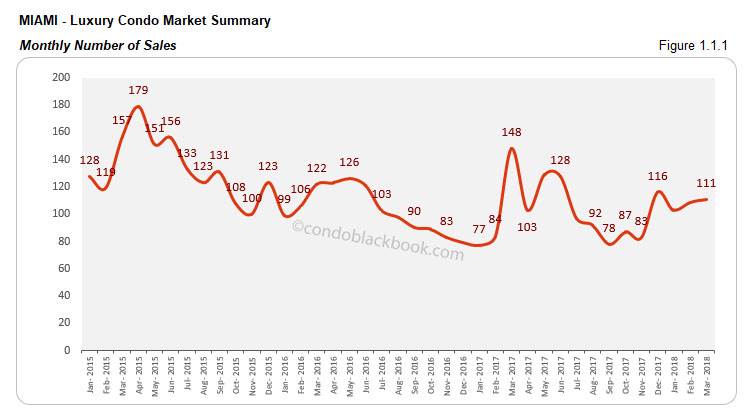
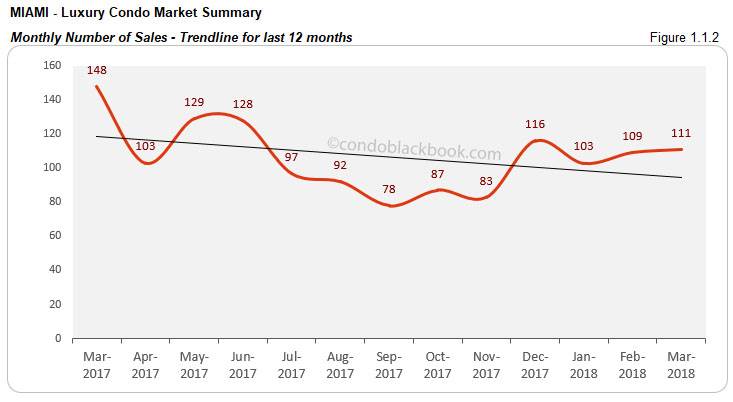
Slight improvement in YOY quarterly numbers and month-to-month sales. Fig. 1.1 below captures quarterly movement. There is only a 5% increase to report compared to Q1 last year, leaving a lot more room for improvement. Looking at the monthly sales in fig. 1.1.1, even though we see a stronger March compared to February, a year-over-year review shows a 25% slip in numbers. So, even though the sales picture remains positive, the market needs a bigger push to gather good momentum.
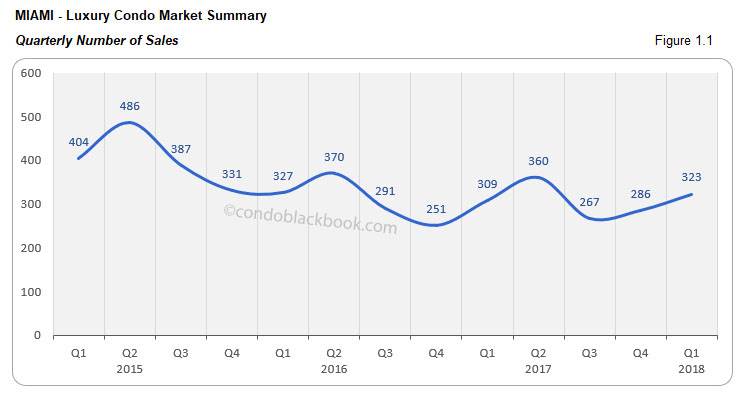
Trend line stays negative throughout first quarter. It’s easy to see in the charts above that even though sales outperformed the previous quarter and last month, they still lack the momentum necessary for a strong condo market. This negative trend is reflected by the 12-month trend line below (fig. 1.1.2) tipping downwards this entire first quarter.
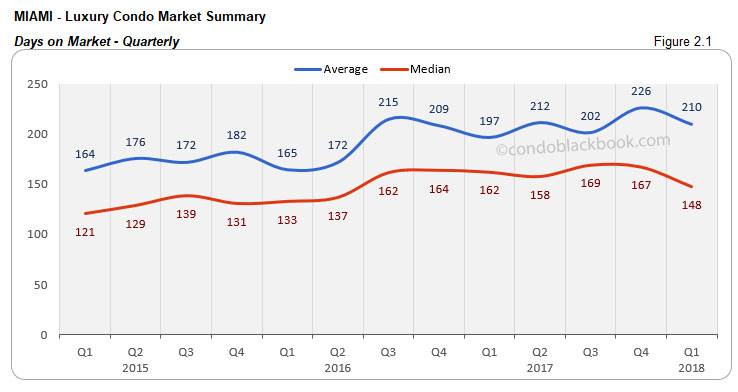
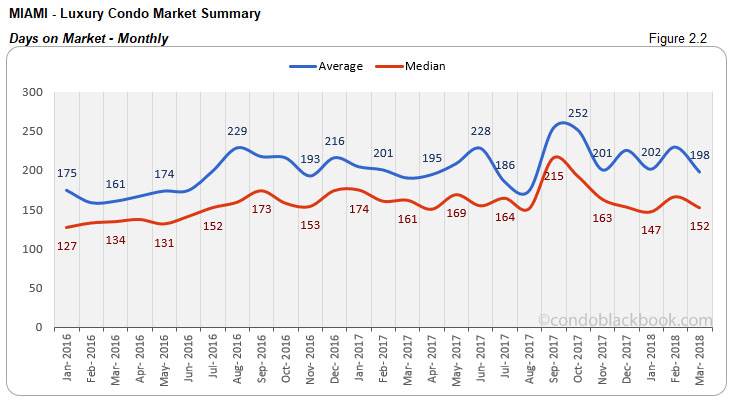
Days on Market - Miami Luxury Condo Market Overall back to top
“Days on market” are the total number of days from when a property is active to the day it goes under contract.
Days on market decline. It seems that buyers and sellers have been coming to a consensus sooner, as we see the overall days on market drop. Fig. 2.1 below shows a 12% drop in the median days on market this first quarter. We also have fig. 2.2 posting an 8% decline in the monthly median days over February.
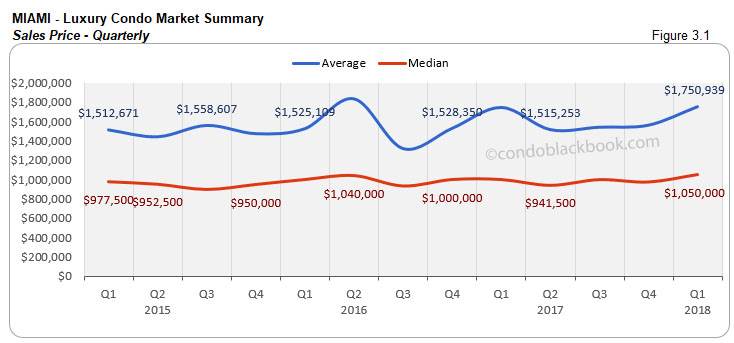
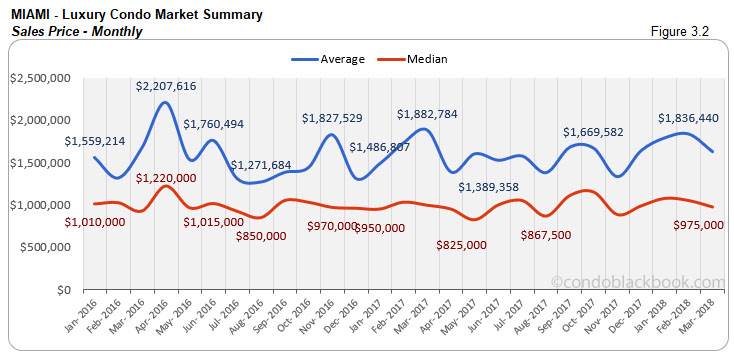
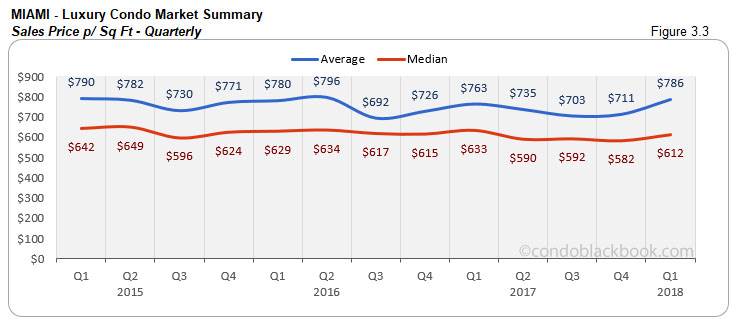
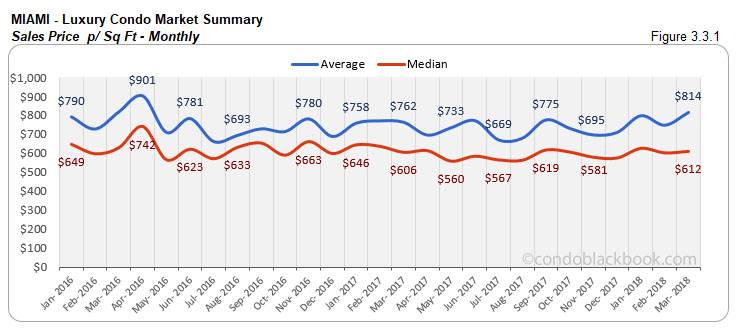
Sales Price Trends - Miami Luxury Condo Market Overall back to top
Q1 ends with ultra-luxury sales pushing up prices. We see the quarterly median sale prices increase 8% with a corresponding 5% increase in the price per sq. ft. (See fig. 3.1 and 3.3 below.) This inflation is majorly fueled by ultra-luxury sales (above $5 million) taking place mostly around Miami Beach.
Inventory Trends - Miami Luxury Condo Market Overall back to top
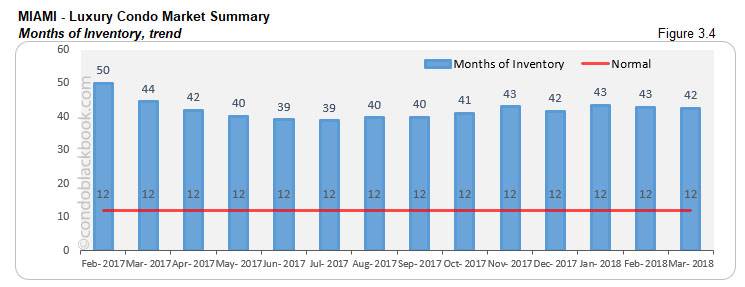
A balanced market will only have 9-12 months of inventory. The months of inventory are calculated as – no. of active listings + no. of pending listings divided by the average number of deals in the last 6 months.
Inventory decreases year-over-year and month-to-month. It is quite encouraging to see the months of inventory drop 5% against March 2017 and 1% compared to last month. However, since 42 months is way off the 9-12 month mark of a balanced market (fig. 3.4), buyers are still in a position to dictate deals and gain.
City and Neighborhood Market Reports back to top
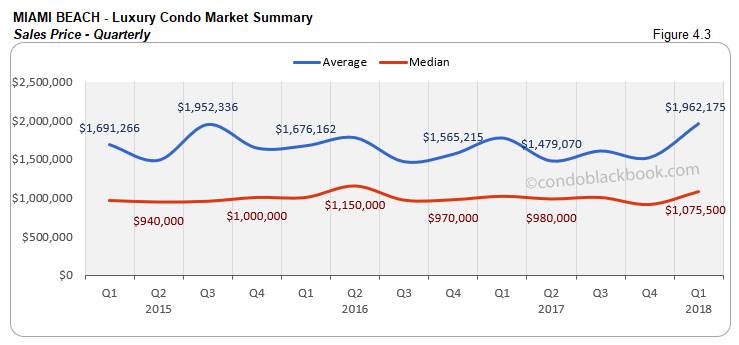
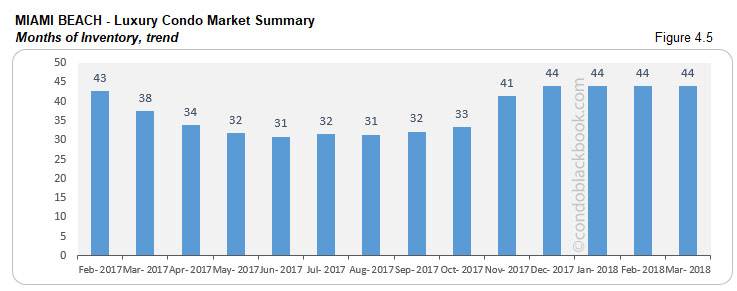
Miami Beach Luxury Condo Market Summary back to top
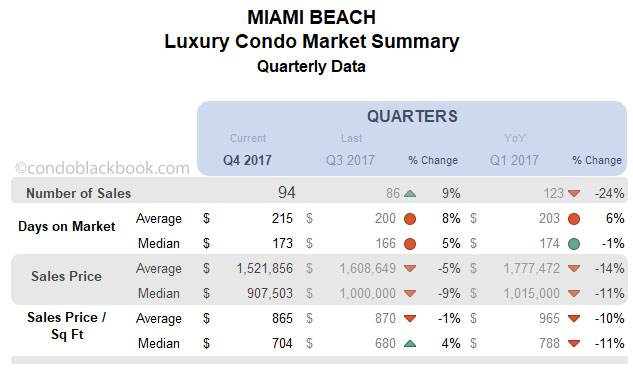
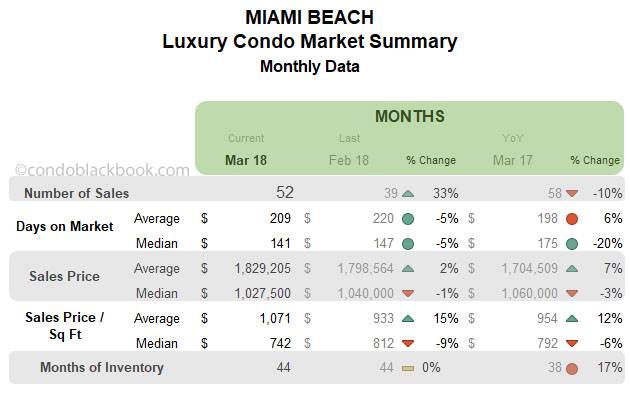
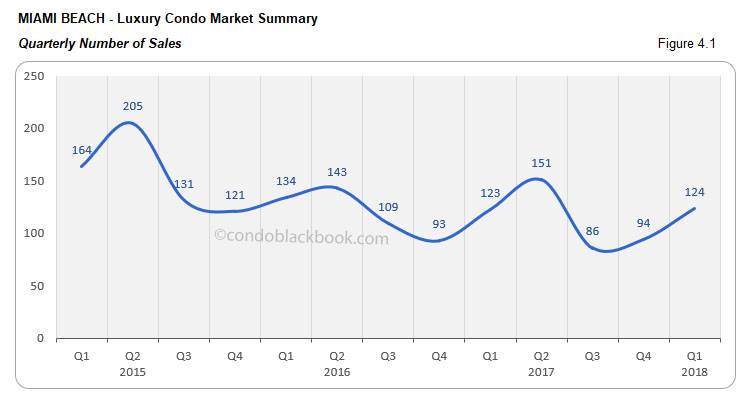
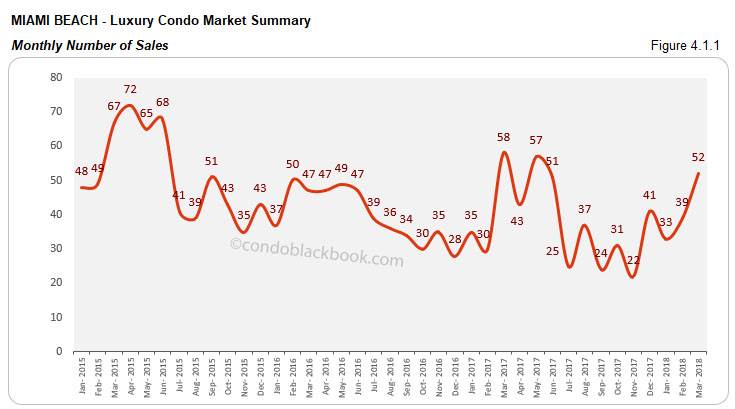
Quarterly sales post uptick, monthly sales fall YOY resulting in a negative trend line. Q1 closes on a positive note in Miami Beach (fig. 4.1). There’s a 32% increase over last quarter, but only a 1% increase to report over Q1 2017. Also, sales in March outdid February by 33%, but fell 10% short of last year (fig. 4.1.1). This slack in momentum is captured by the negative trend line in fig. 4.1.2 below, clearly indicating that the market has not been able to achieve the same level of performance as last year.
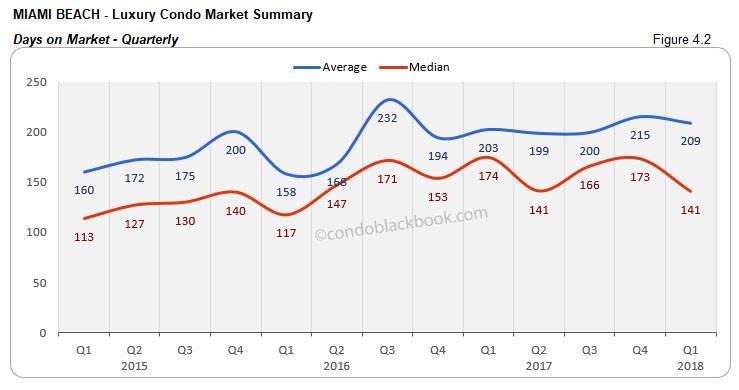
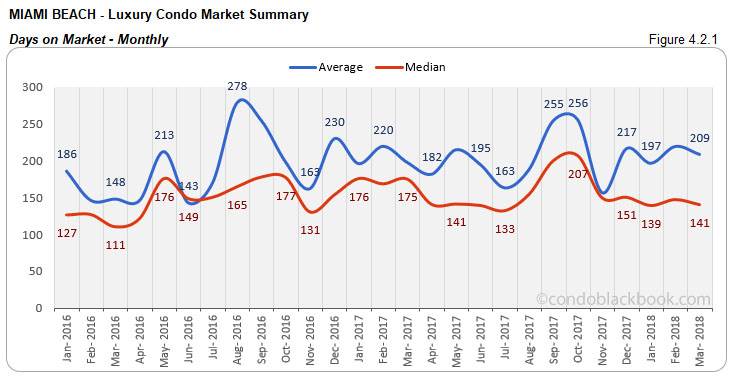
Quarterly and monthly days on market decline. A definite positive for Miami Beach is that luxury condos are getting off the market sooner. We see a decrease in both the quarterly and monthly days on market. Fig. 4.2 shows a 19% decline in the quarterly median days compared to Q4 2017. Also, fig. 4.2.1 posts a 5% decline compared to February.
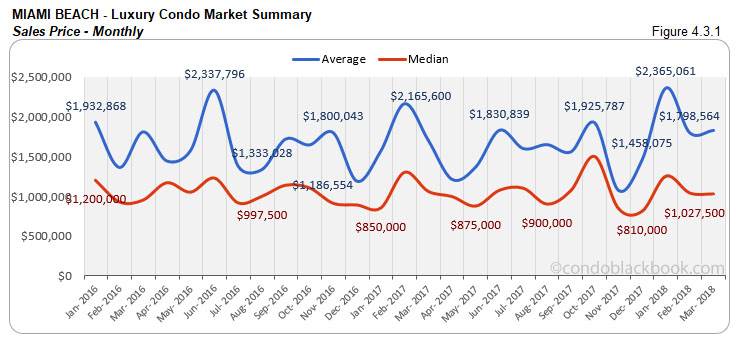
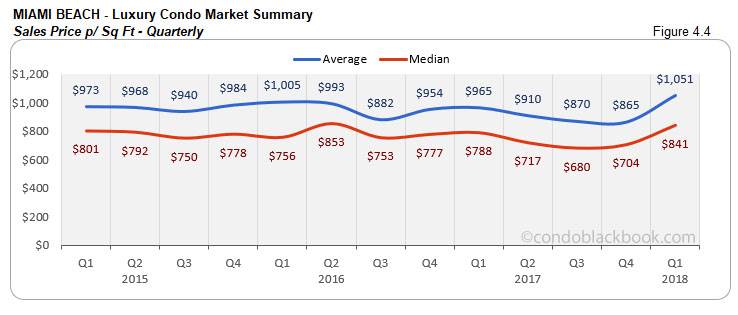
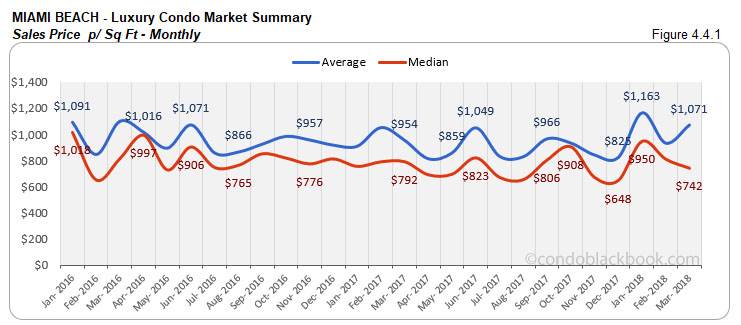
Quarterly prices inflate, though monthly prices decline. Higher priced luxury sales (above $5 million) through January and February ended up closing the quarter with a 19% increase in median prices (fig. 4.3 and 4.4). On the other hand, March posts a slight decrease in month-to-month prices, capturing the luxury segment’s (condos priced $600K to $5 million) modest approach (fig. 4.3.1 and 4.4.1).
Inventory up 17% YOY. Fig. 4.5 below reports 44 months of inventory for the fourth consecutive month. This is way higher than the 9-12 month mark of a normal market, showing that buyers still rule the roost. With the luxury condo market still in their favor, buyers should look for deals by searching Miami Beach condos for sale here.
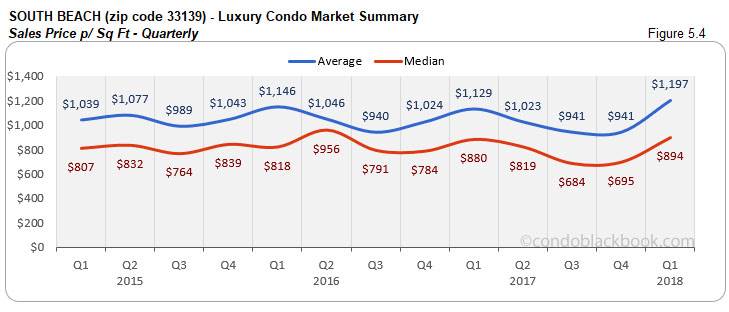
South Beach Luxury Condo Market Summary (33139 zip) back to top
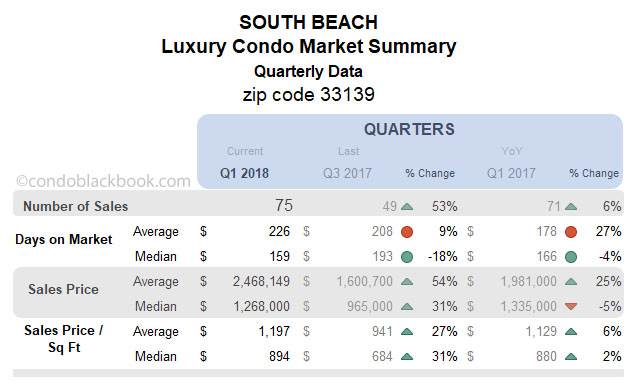
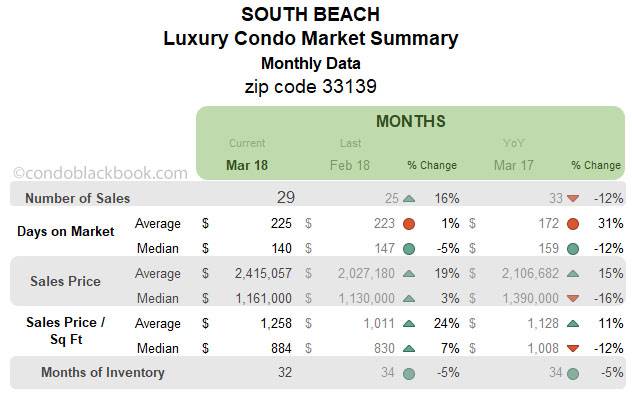
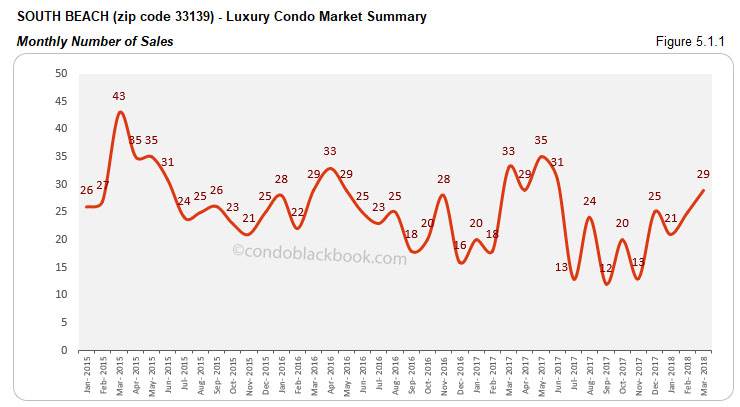
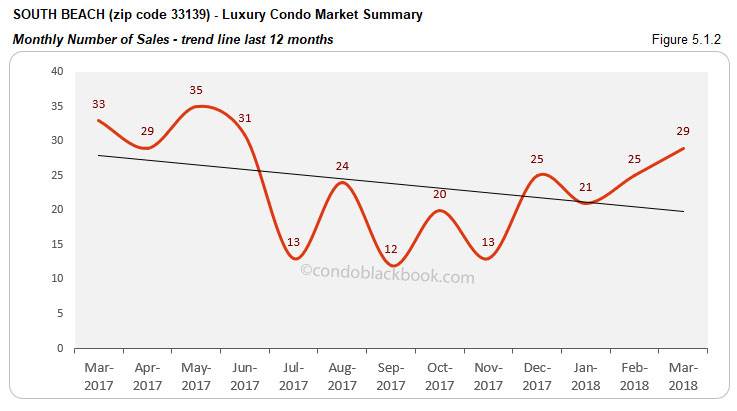
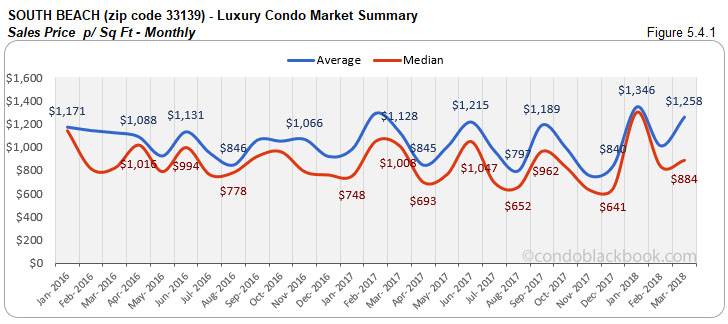
Quarterly sales improve, but monthly sales fall YOY to keep trend line negative. We see Q1 post a good 29% increase over Q4 2017, but only a 6% increase over same quarter 2017 (fig. 5.1). Fig. 5.1.1 further shows that sales in March dropped 12% compared to same month last year. So, even with sales improving over the previous quarter and month, we see a negative trend line in fig. 5.1.2.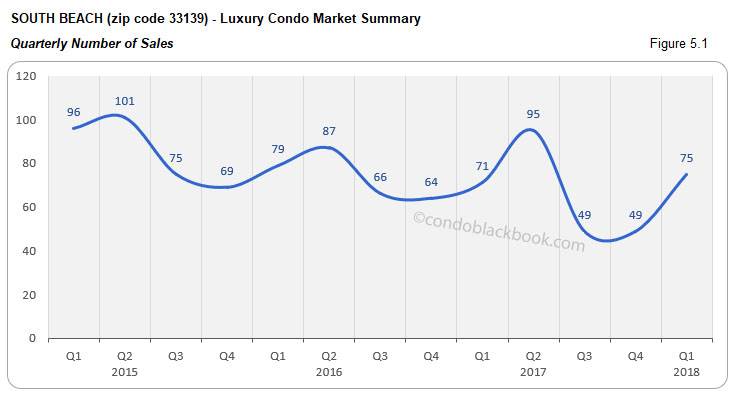
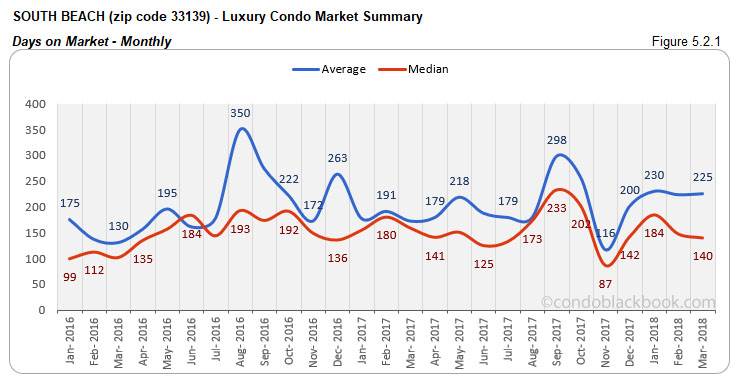
Quarterly days on market keep, though monthly days drop. Continuing its positive trend, we see a reduction in the monthly median days on market by 5% and no increase in the quarterly median in South Beach. (See fig. 5.2 and 5.2.1)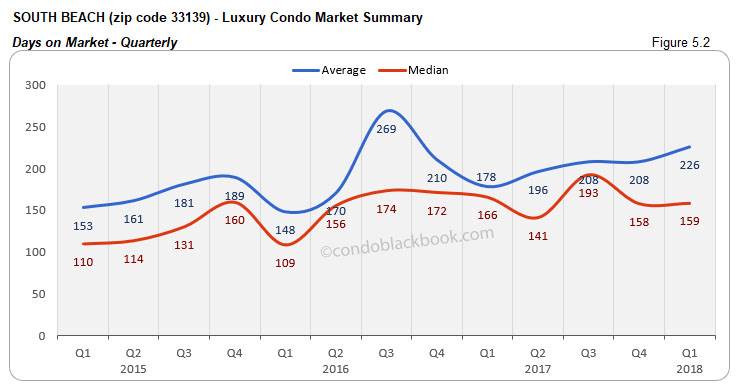
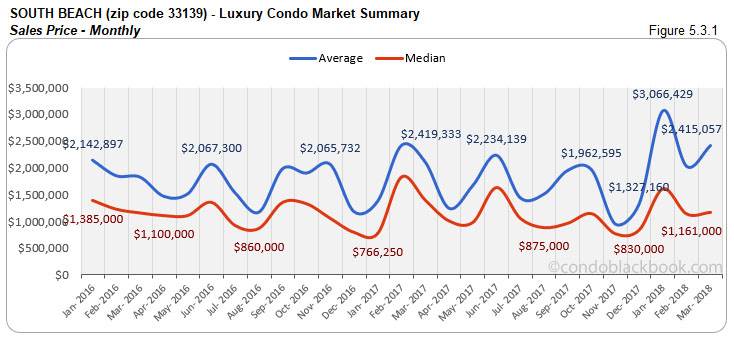
Ultra-luxury pushes up price trends. We see the price trends in both the quarterly and monthly charts move up. (See fig. 5.3, 5.3.1, 5.4 and 5.4.1) There’s a whopping 50% increase in the quarterly median price due to ultra-luxury sales (above $5 million) taking place in both January and February of this first quarter.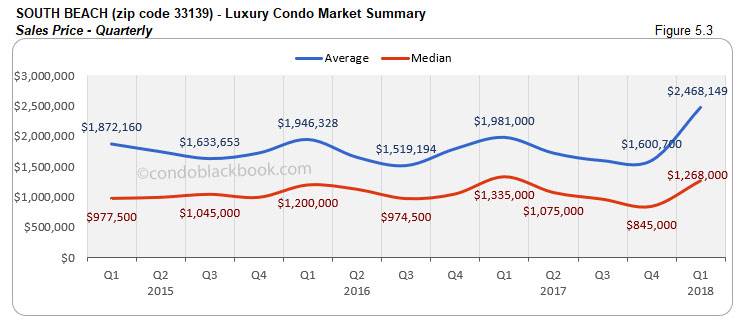
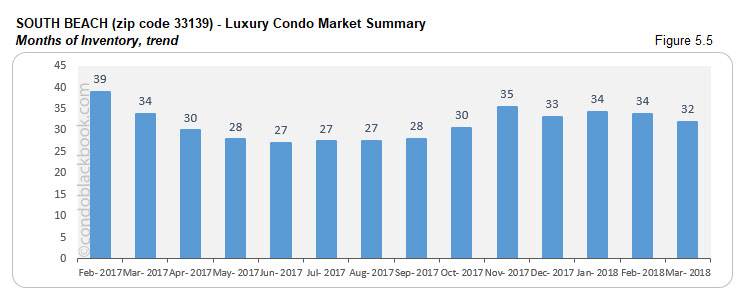
Inventory down 5% YOY and MTM. Fig. 5.5 below shows a reduction in the months of inventory, coming down to 32. Even though there is a 5% decrease in the month-to-month numbers, it is way off the 9-12 month mark of a normal market. This keeps the window open for buyers to pick up top deals on South Beach condos for sale here, or at least begin with a tour of this vacation destination here.
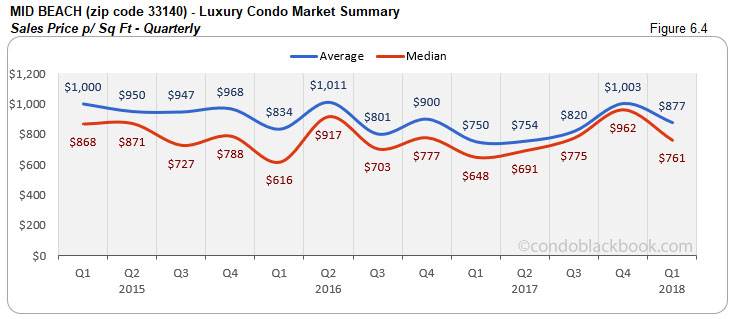
Mid-Beach Luxury Condo Market Summary (33140 zip) back to top
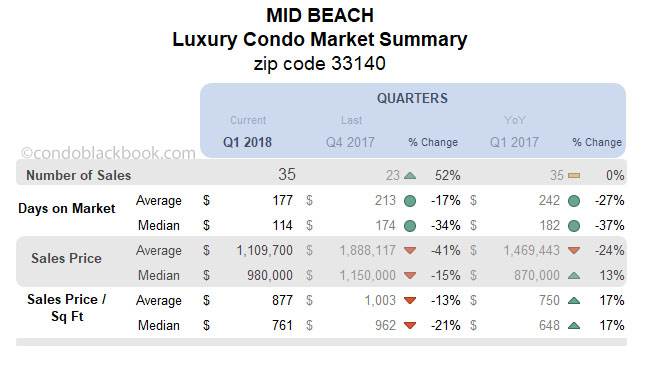
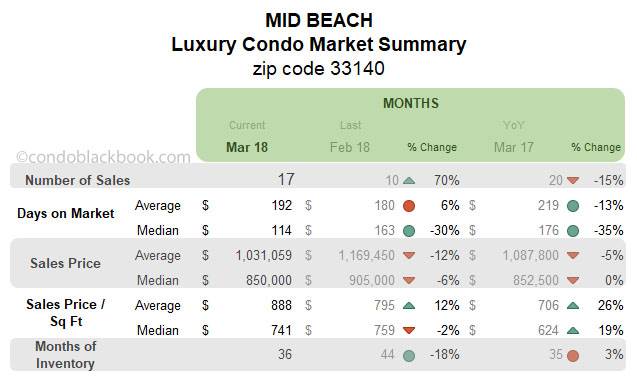
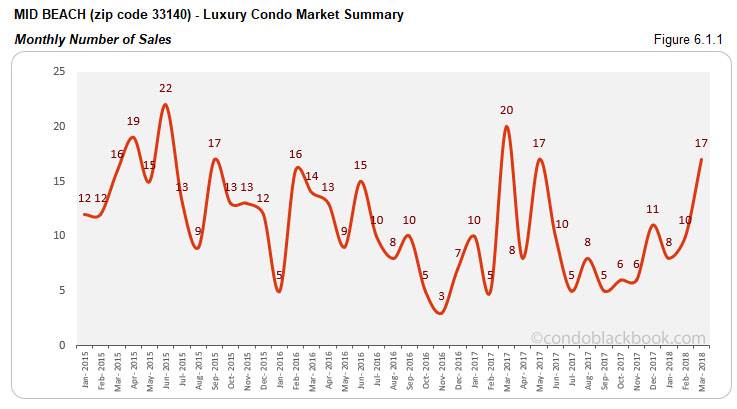
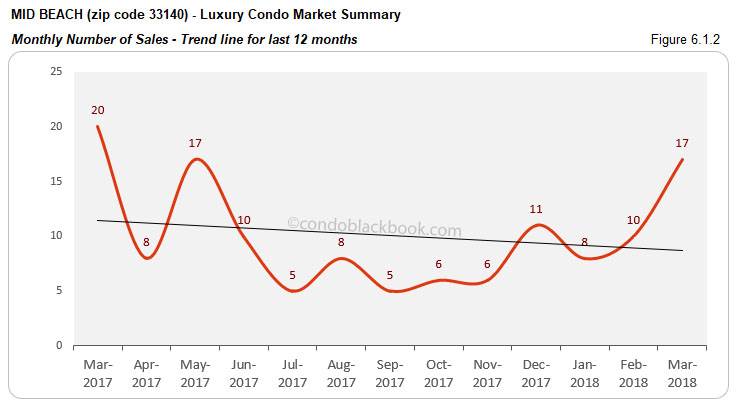
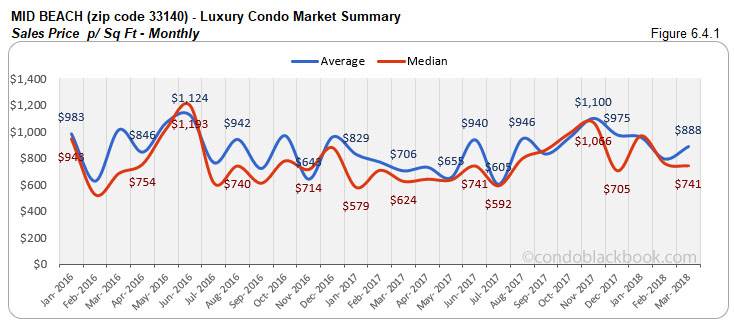
Quarterly sales keep, monthly drop YOY leading to a negative trend line. Q1 2018 has no improvement to report compared to same quarter last year due to a weak January and February (fig. 6.1). Also, the month of March outdid February by 70%, however, sales have dropped 15% year-over-year (fig. 6.1.1). This keeps the trend line (fig. 6.1.2) negative for the upscale neighborhood.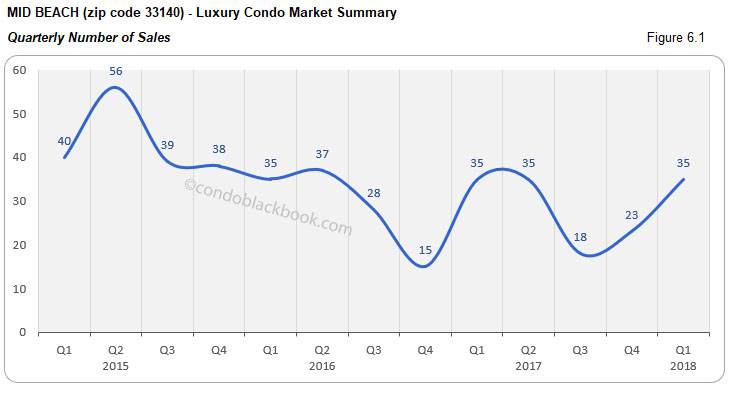
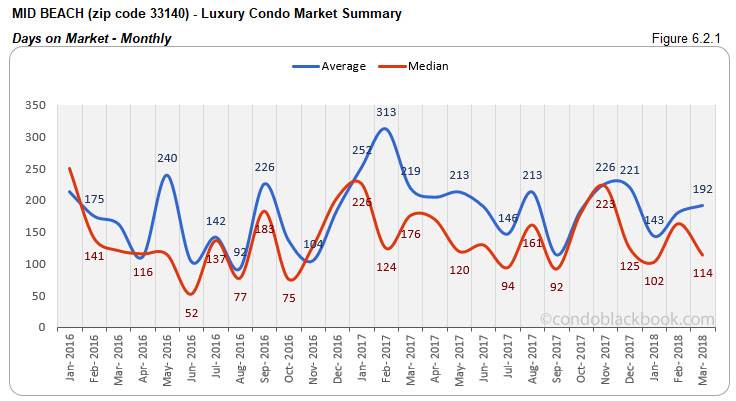
Quarterly and monthly days on market decline. Posting a positive for Mid-Beach, we see the median days on market drop by 34% for the quarter (fig. 6.2). There is also a 30% decline to report in the month-to-month days on market (fig. 6.2.1).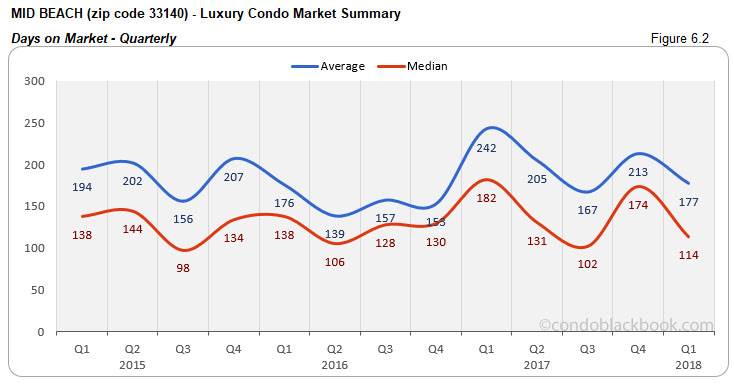
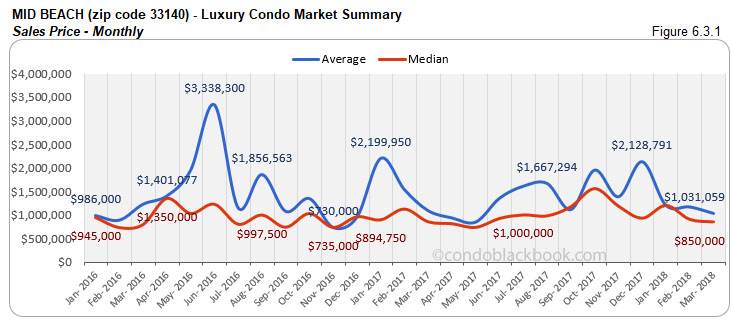
Quarterly and monthly prices deflate. There is a marked decline in the prices in Mid-Beach, which would definitely improve buyer motivation. The quarterly median sales price is down 15%. And, the monthly median price too is down 6%. (See fig. 6.3, 6.3.1, 6.4, and 6.4.1)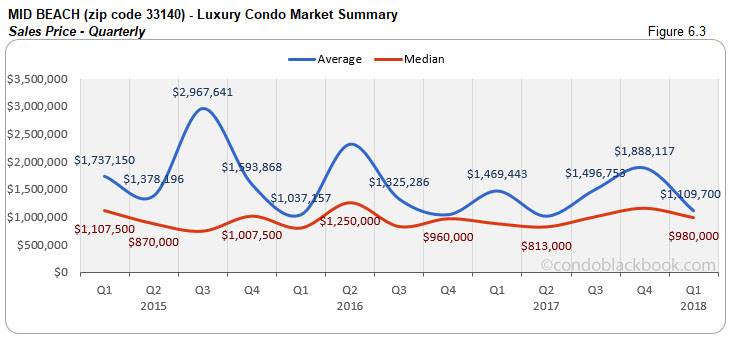
Inventory increases 3% YOY. Even though the current 36 months of inventory is a marked improvement from recent months posting 48 months, there is still a long way to go (fig. 6.5). There is a 3% increase in the year-over-year inventory. This is also way off the 9-12 month mark of a balanced market. With high inventory and lower prices, buyers should scout for deals on Mid-Beach condos for sale here, or begin with a tour of the neighborhood here.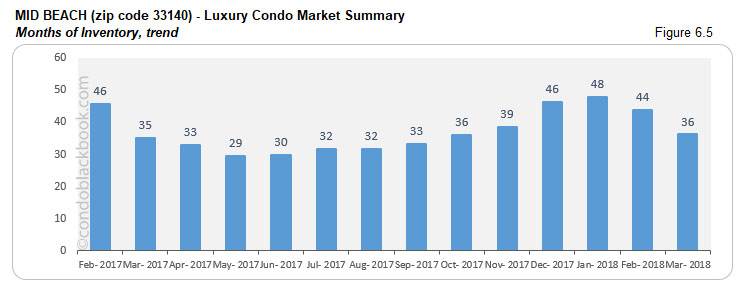
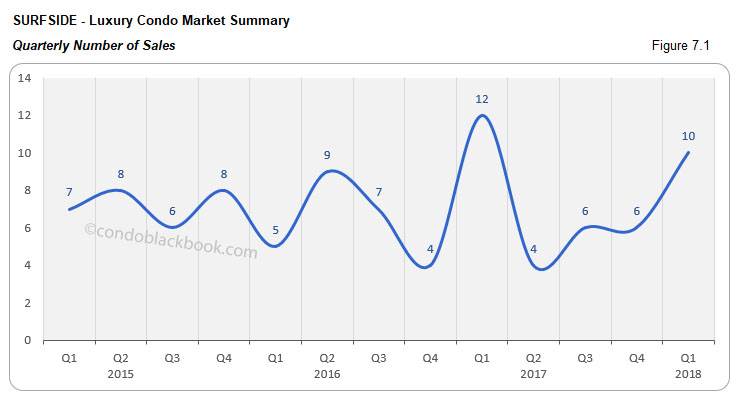
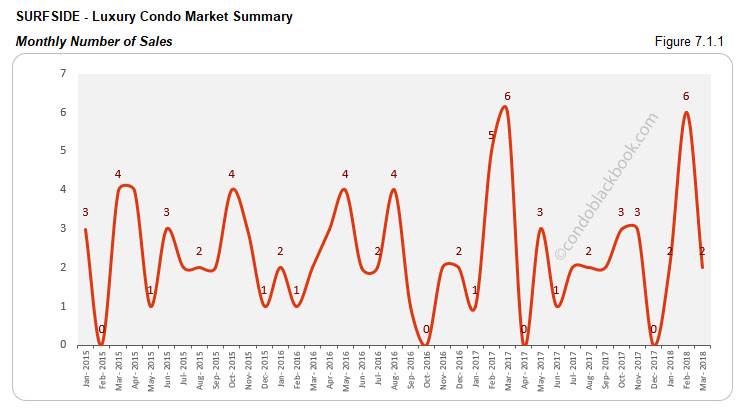
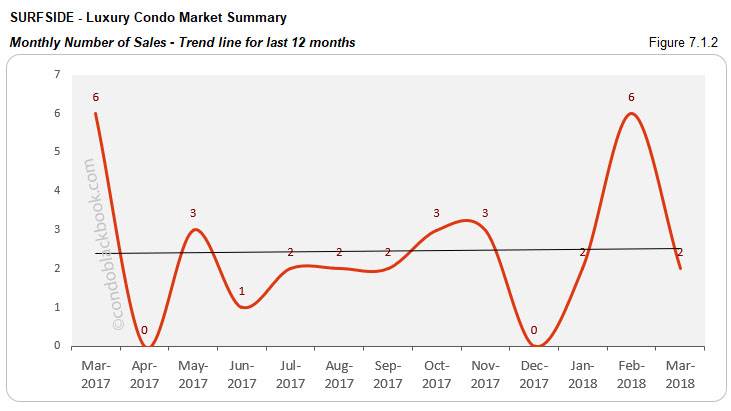
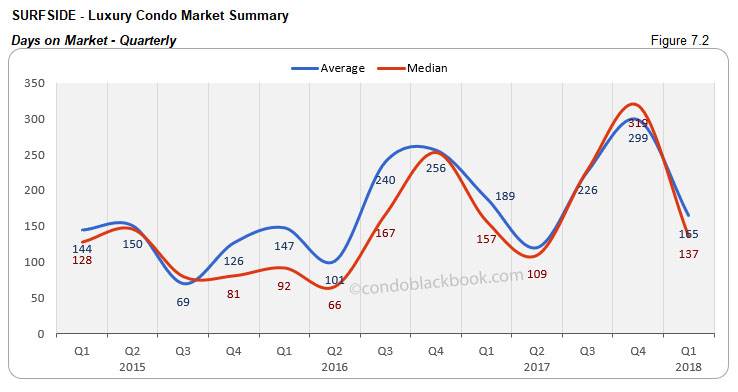
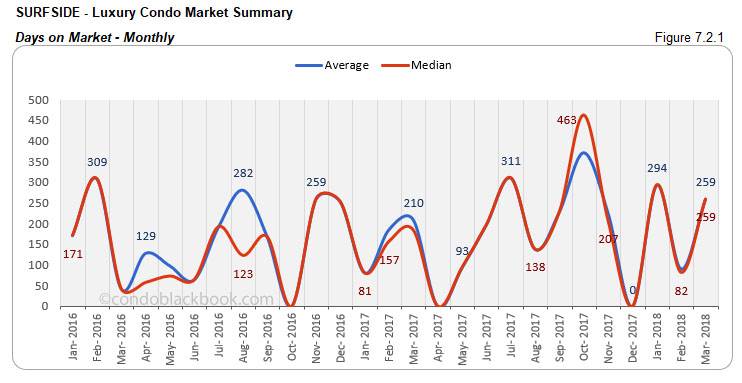
Surfside Luxury Condo Market Summary back to top
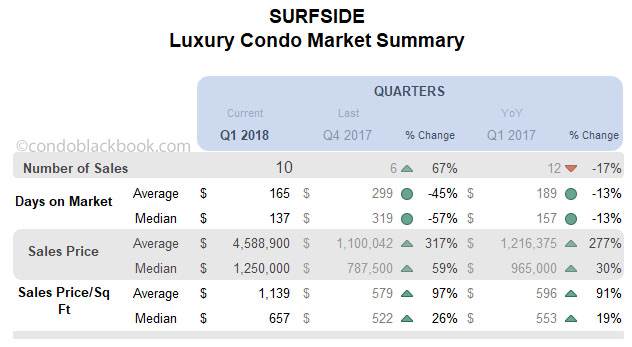
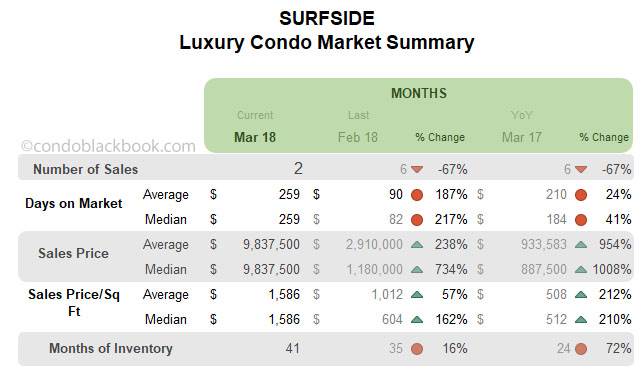
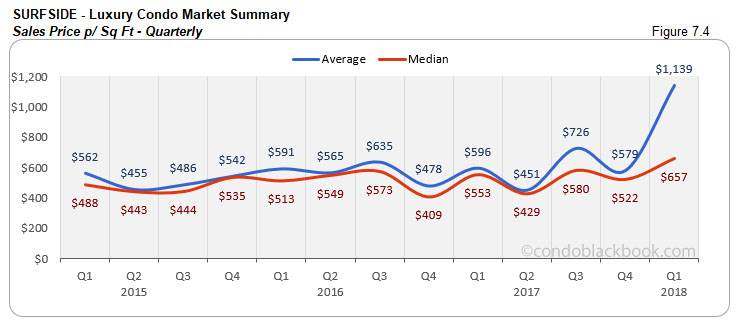
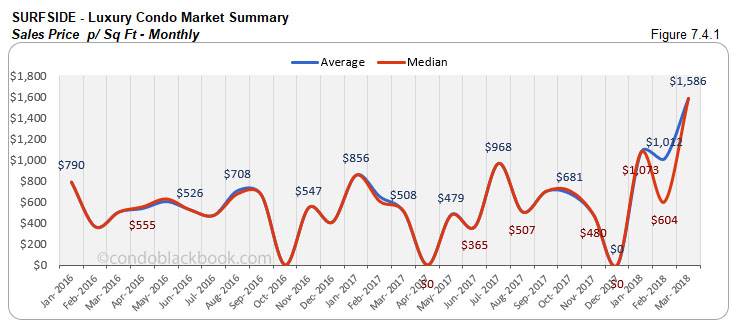
Mediocre quarterly and monthly sales, but trend line stays afloat. We see March unable to deliver its usual spring boost in this seaside community. Though the first quarter fared 67% better than Q4 2017, it lagged by 17% compared to same quarter last year (fig. 7.1). Also, sales in March fell 67% short of both the previous month and previous year (fig. 7.1.1). The only good news is that the 12-month trend line has stayed flat, showing that momentum is not completely lost here (fig. 7.1.2).
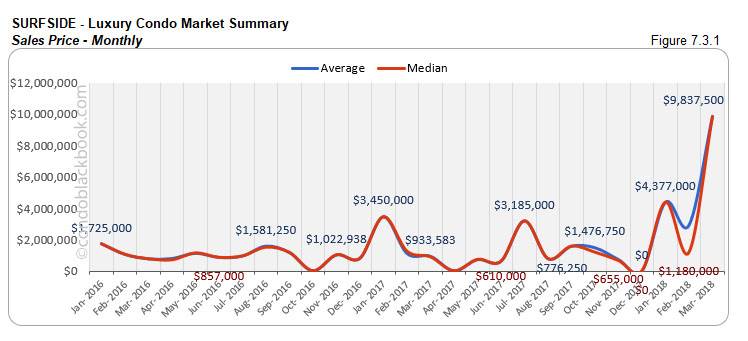
Ultra-luxury sales inflate prices. March closed with an $18.5 million deal for a Fendi Chateau condo. This and another $8 million Fendi Chateau deal in January pushed up prices in our quarterly and monthly trends. (See fig. 7.3, 7.3.1, 7.4 and 7.4.1)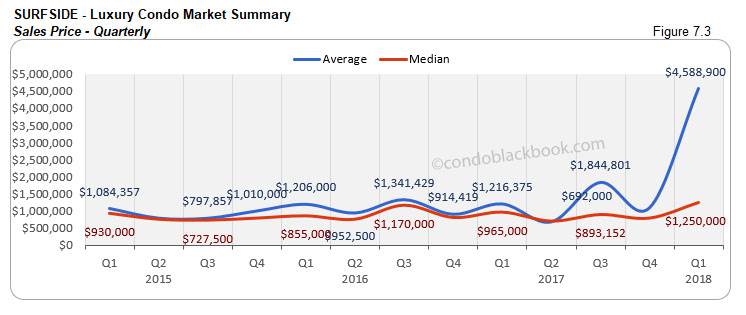
Inventory up 72% YOY. Fig. 7.5 below reports 41 months of inventory, which is 16% above last month and a whopping 72% above same month last year. With inventory being high and way off the 9-12 month mark of a balanced market, buyers should take the opportunity and search for a Surfside condo for sale here, or see what lifestyle makes up Surfside here.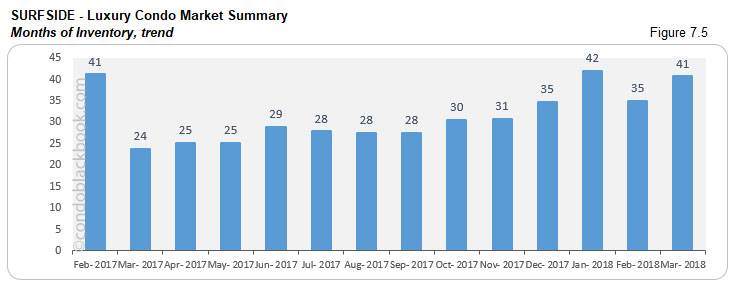
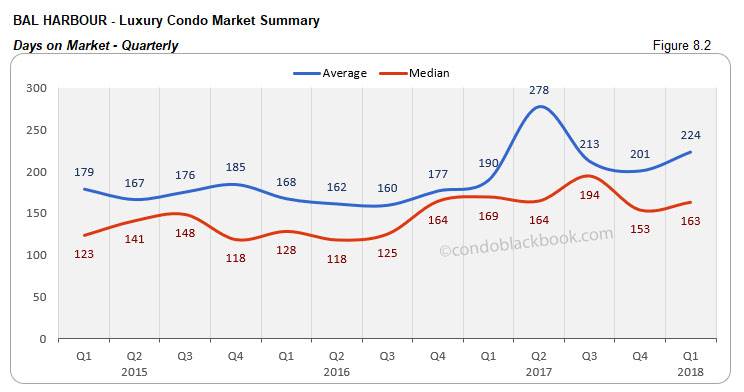
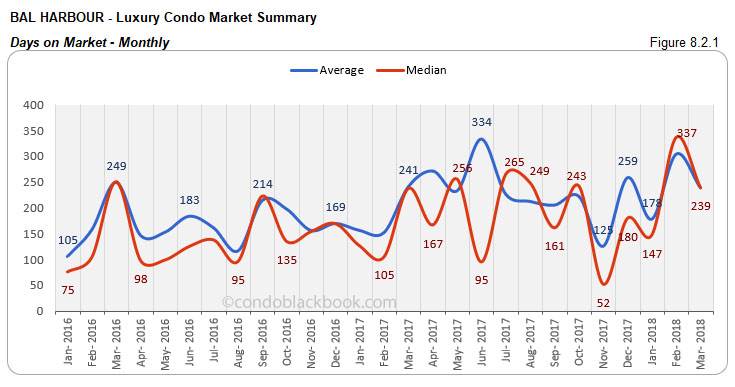
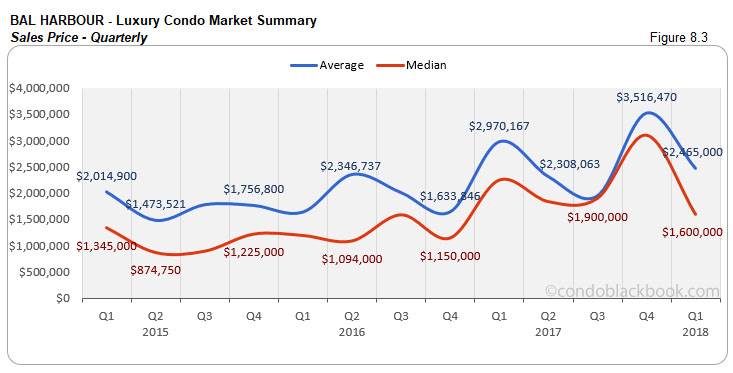
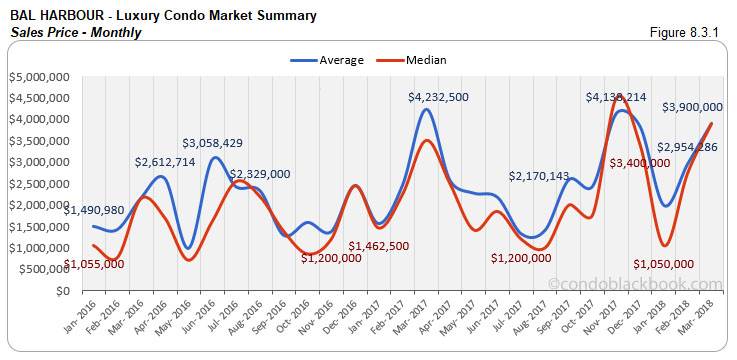
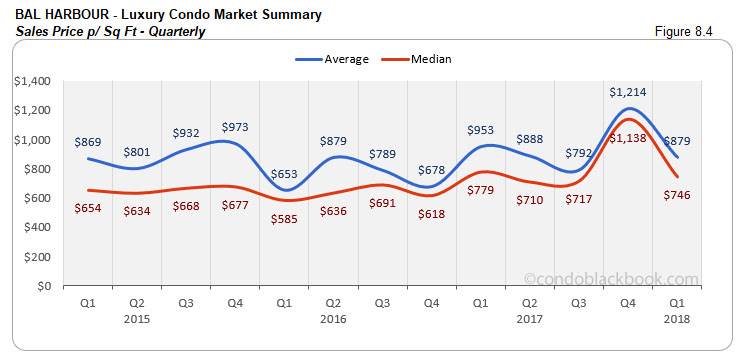
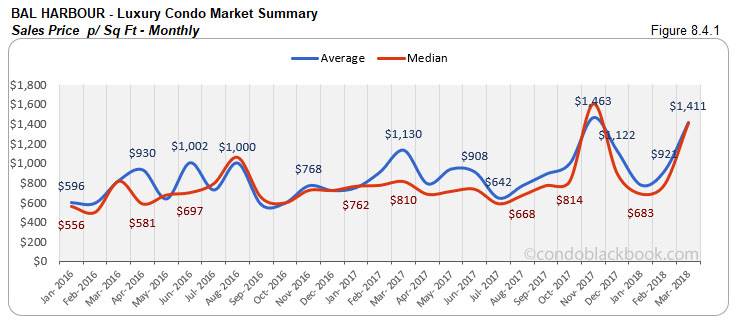
Bal Harbour Luxury Condo Market Summary back to top
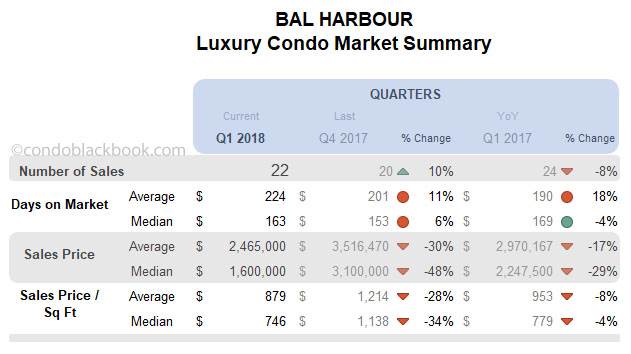
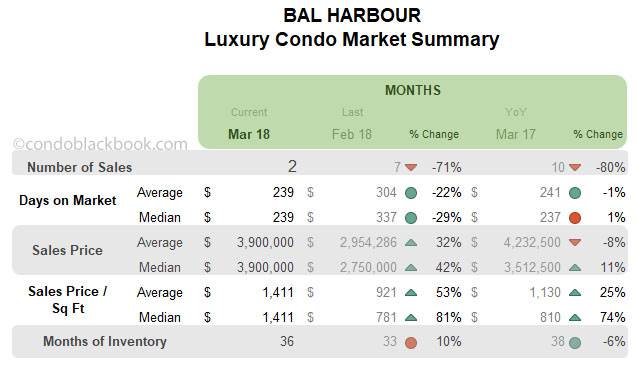
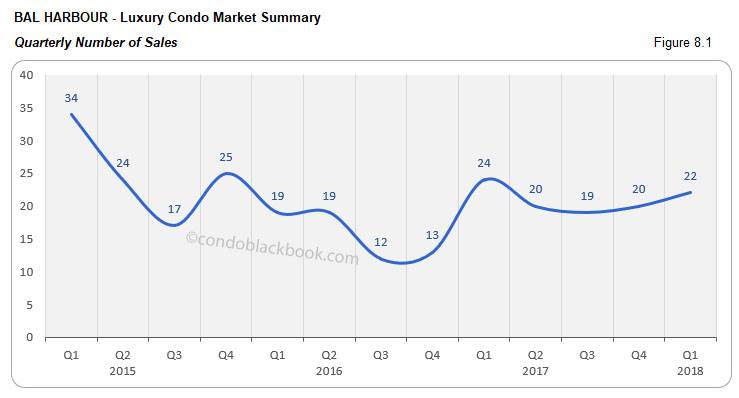
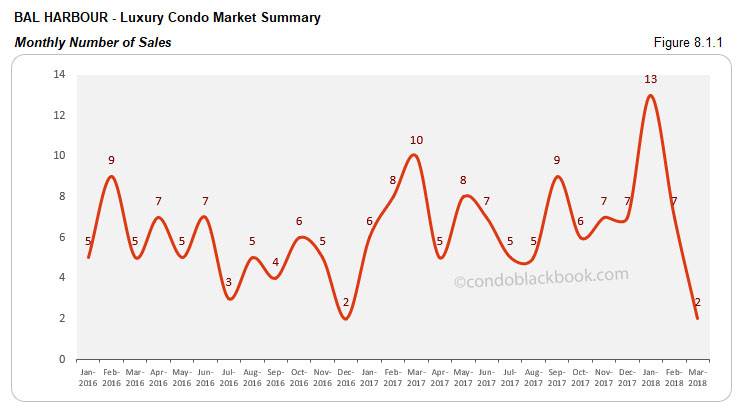
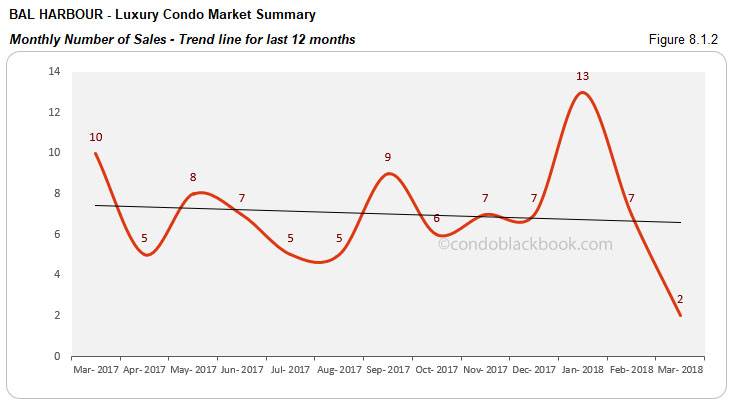
Quarterly and monthly sales slack, posting a negative trend line and volatile metrics. With January being the only good month in the quarter, we see Q1 posting an 8% drop over Q1 2017 (fig. 8.1). March came up with very few sales, slacking 71% compared to February and 80% compared to same month last year (fig. 8.1.1). The impact of this is very visible in the 12-month trend line, which tips downward (fig. 8.1.2). Considering Bal Harbour is a smaller market for luxury condos, we see the volatility created by a sudden dip in sales in the days on market, price and months of inventory charts below.
6% reduction in YOY inventory. Fig. 8.5 shows 36 months of inventory, which is 10% higher than last month, but 6% lower year-over-year. Nonetheless, the figure is far from reaching the 9-12 months of a balanced market. This gives buyers ample opportunity to go shopping for deals by searching for Bal Harbour condos for sale here, or start by checking out the upscale neighborhood here.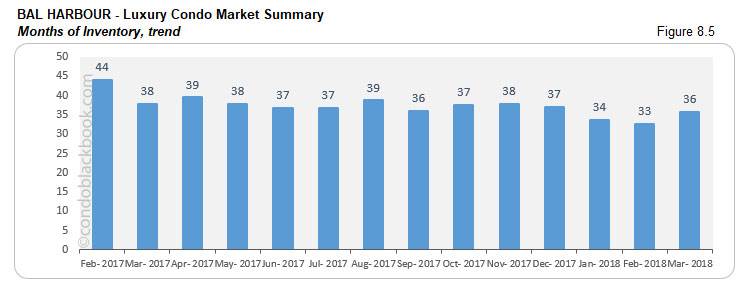
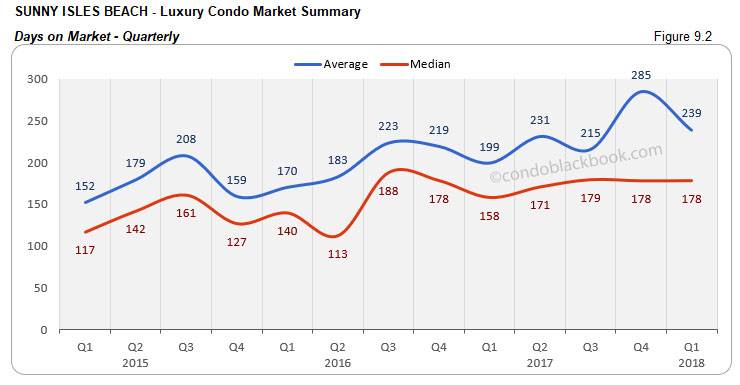
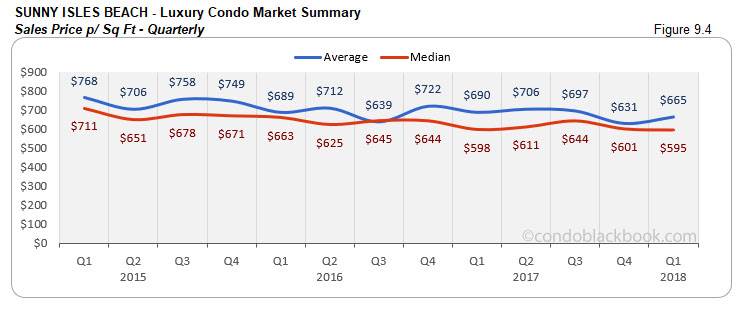
Sunny Isles Beach Luxury Condo Market Summary back to top
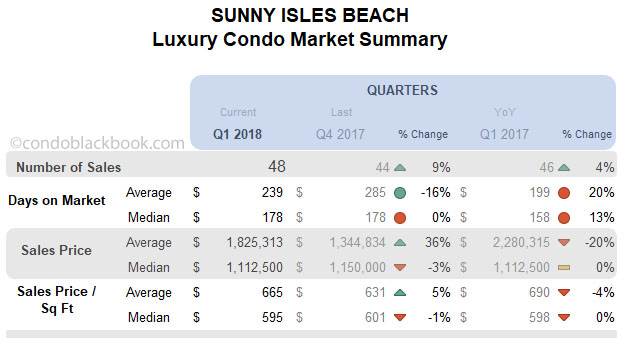
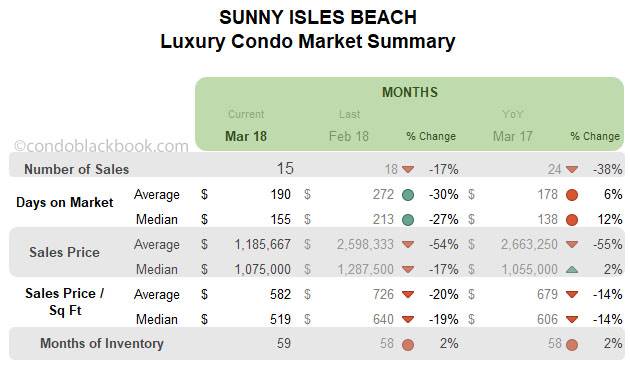
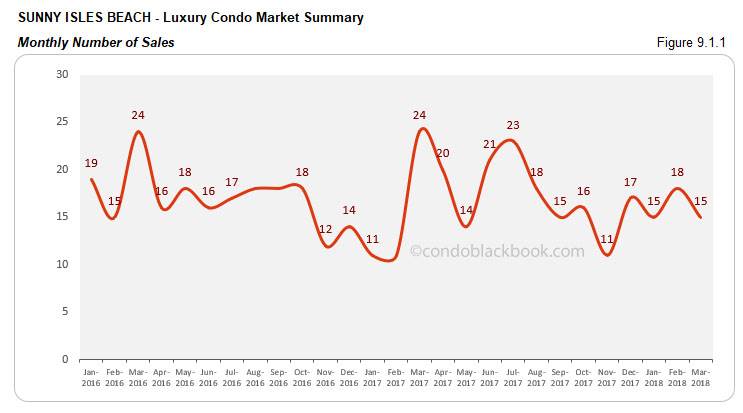
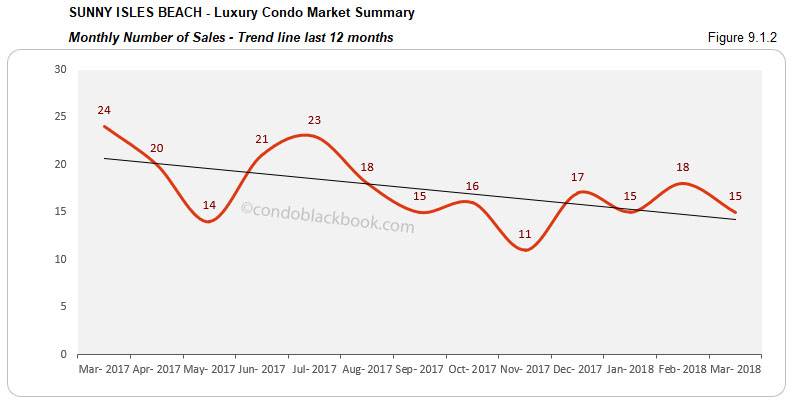
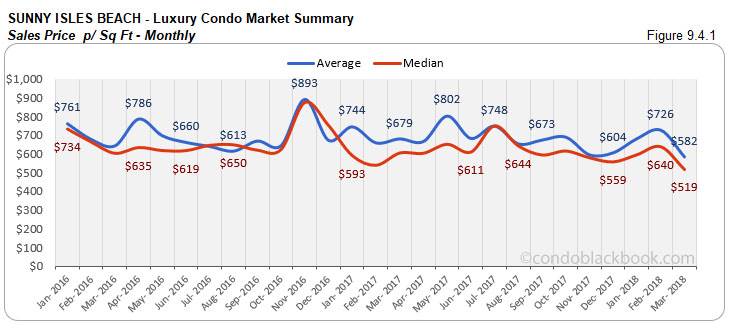
Quarterly sales post improvement, but monthly sales and trend line post negatives. We have Q1 closing 9% higher than last quarter and 4% higher year-over-year (fig. 9.1). But, we also see March sales dip 8% year-over-year (fig. 9.1.1), which makes the trend line follow suit with a downward tilt (fig. 9.1.2).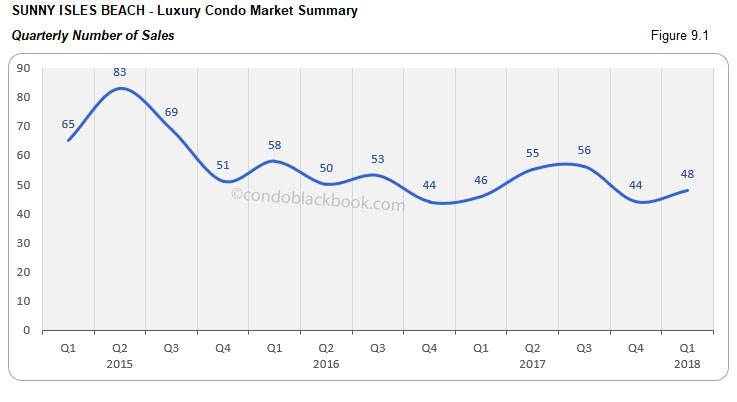
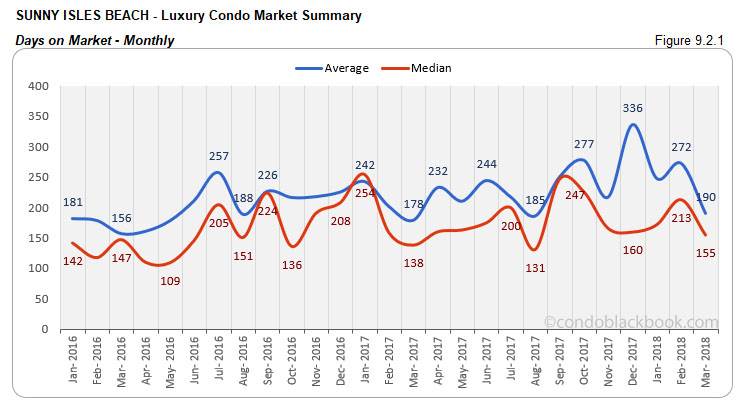
Days on market reduce. On a positive note, we see the median days on market reduce in Sunny Isles Beach. There is a 27% decrease in the monthly median, while the quarter matched last year’s days (fig. 9.2 and 9.2.1).
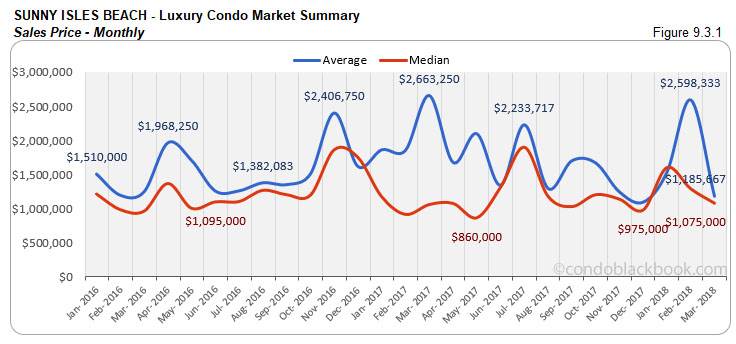
Quarterly and monthly median prices decrease. We see a drop in both the quarterly and monthly median sales price. Q1 closed with 3% lower prices compared to Q4 2017. And, March closed with a 17% drop in month-to-month pricing. Expensive sales had kept prices high in previous months, so a correction this month was but natural. (See fig. 9.3, 9.3.1, 9.4, 9.4.1)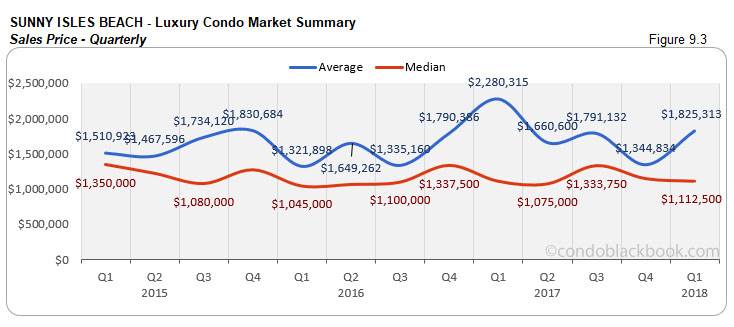
2% increase in inventory. Fig. 9.5 reports 59 months of inventory, which is 2% higher than last month and last year. Since this is also way off the 9-12 month mark of a normal market, buyers should grab the opportunity and find the best deals by searching Sunny Isles Beach condos for sale here, or by exploring lifestyle options here.

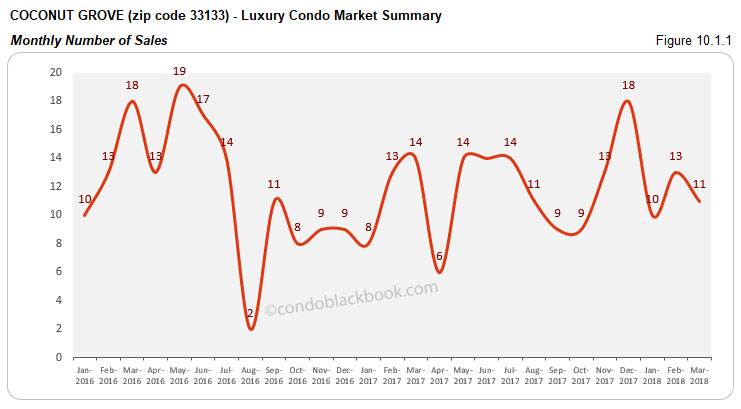
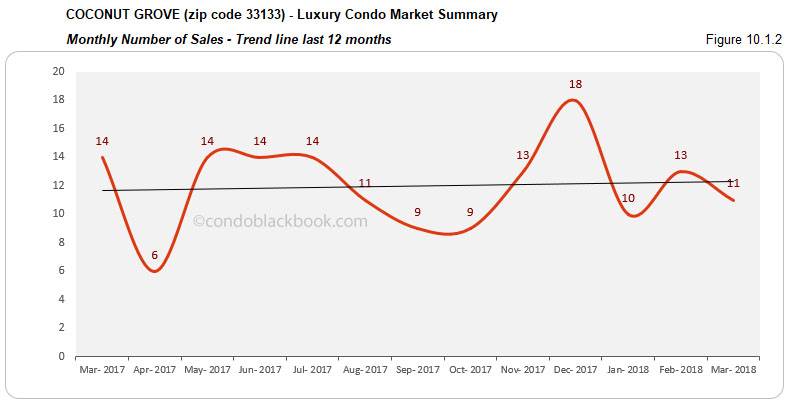
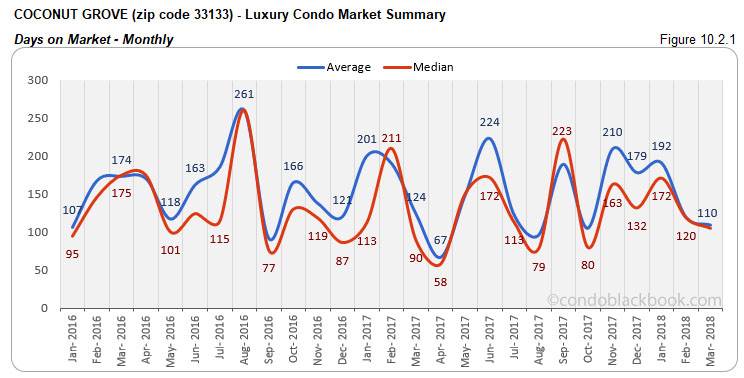
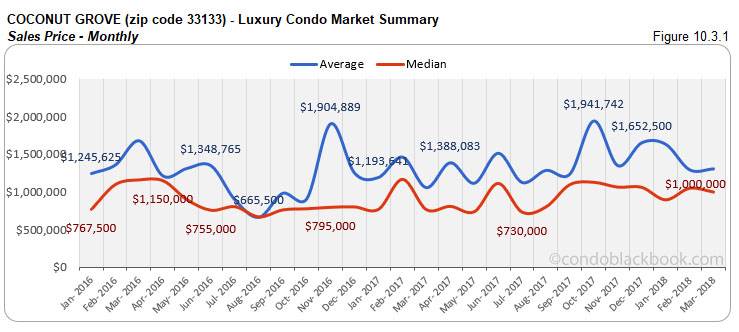
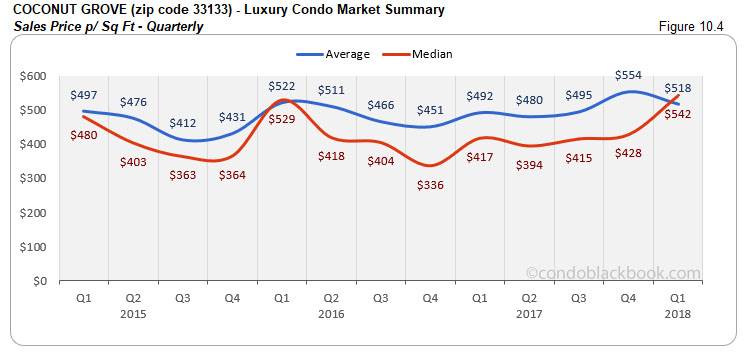
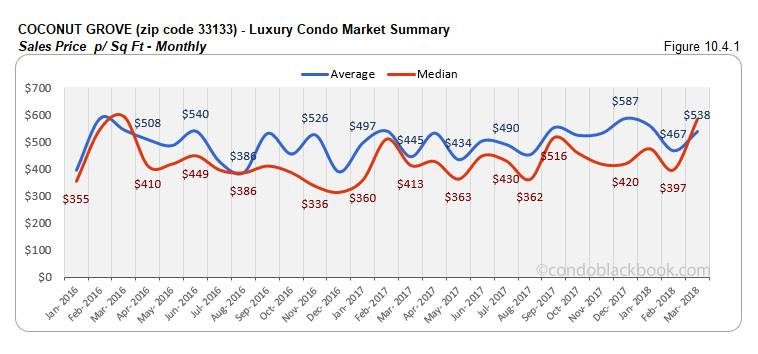
Coconut Grove Luxury Condo Market Summary (33133 zip) back to top
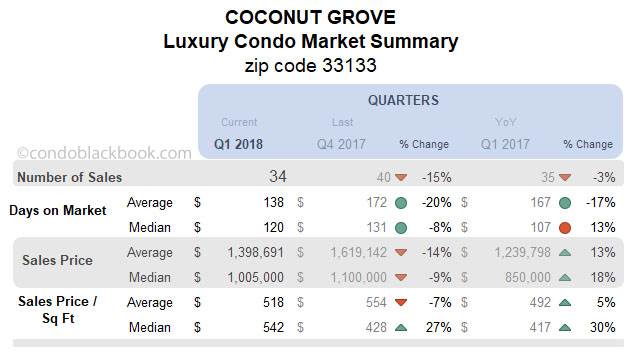
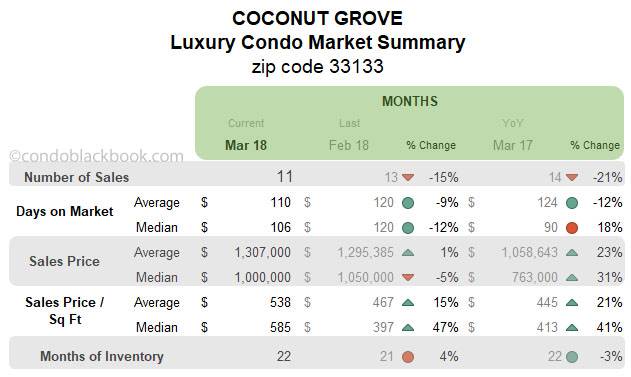
Quarterly and monthly sales simmer down, but trend line stays positive. One of the fastest selling districts in our study, even Coconut Grove lost its sheen this quarter. We see Q1 closing 15% below last quarter and 3% below same quarter last year (fig. 10.1). Also, the monthly trends have dipped 15% month-to-month and 21% year-over-year (fig. 10.1.1). Nonetheless, this vibrant district managed to keep its momentum, posting a positive trend line (fig. 10.1.2).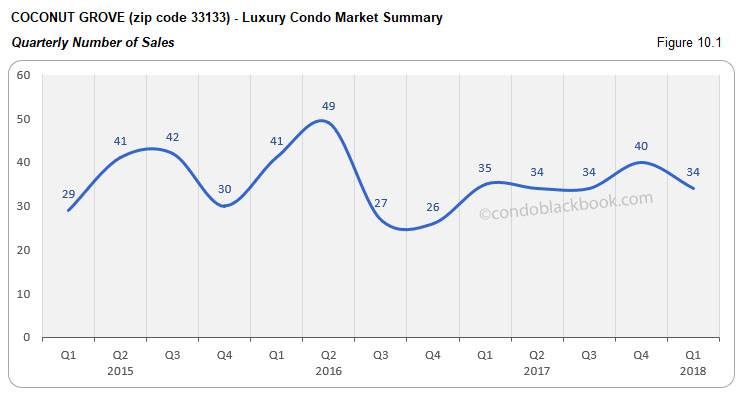
Quarterly and monthly days on market decline. Keeping its positivity, we see the median days on market decline 8% for the quarter (fig.10.2). We also see the days on market reduce 12% month-to-month this March (fig. 10.2.1).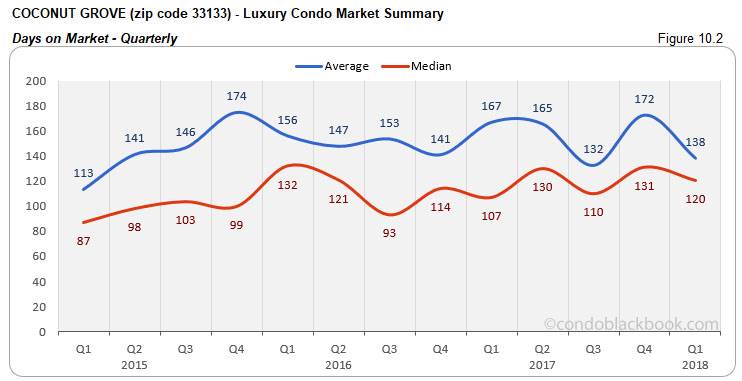
Price charts report volatility. Since Coconut Grove is a modestly sized market for luxury condos, volatility in prices is expected. (See fig. 10.3, 10.3.1, 10.4 and 10.4.1)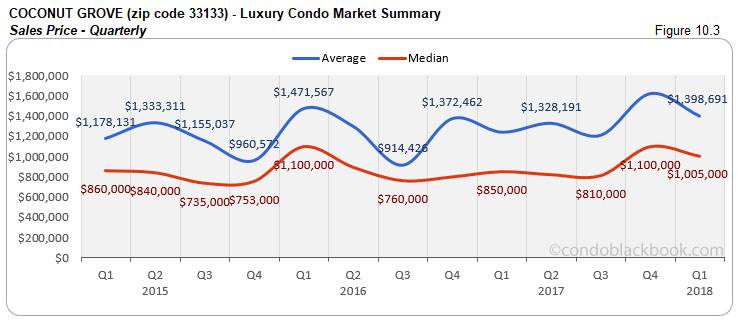
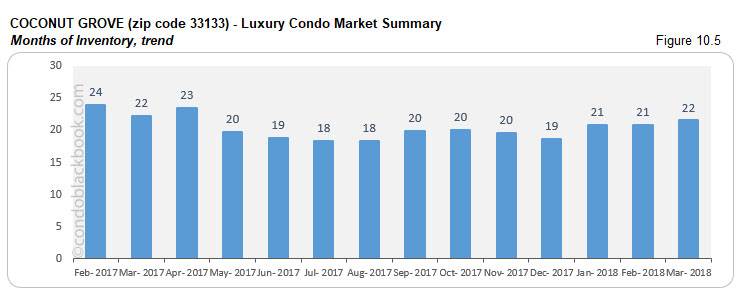
YOY inventory declines 3%. We see the months of inventory 4% higher than last month, but 3% lower compared to same time last year (fig. 10.5). At 22 months, inventory is still off from the ideal 9-12 months. This gives buyers the perfect time to hunt for great deals by searching Coconut Grove condos for sale here, or check out what lifestyle makes this the fastest selling neighborhood in our luxury condo study here.
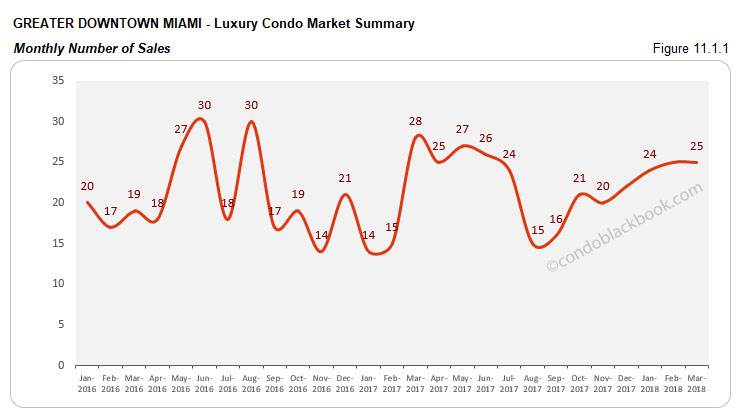
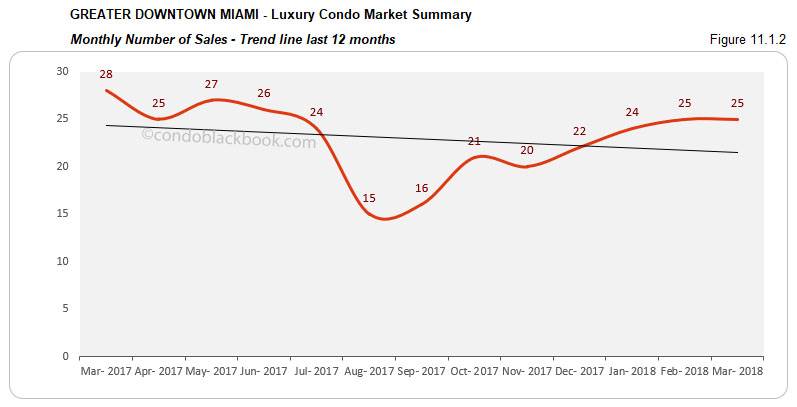
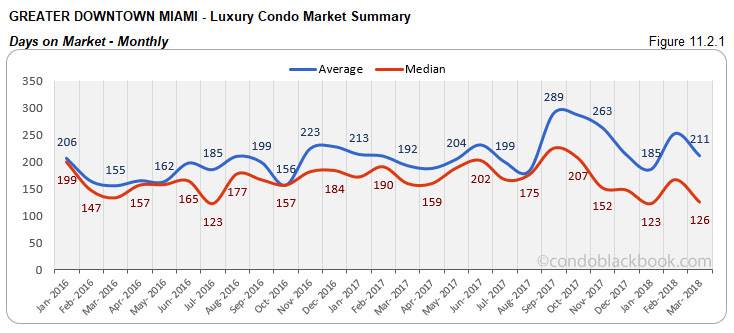
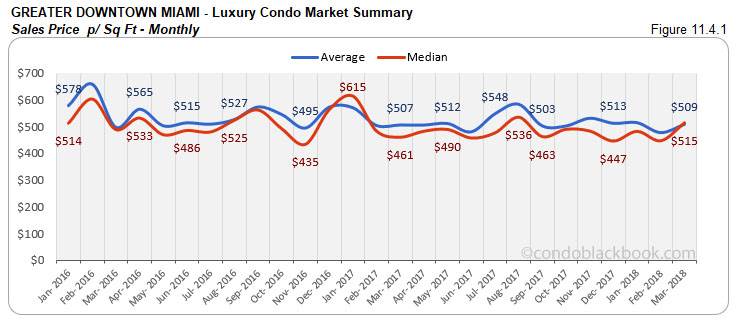
Greater Downtown Miami Luxury Condo Market Summary (33129, 33130, 33131, 33136, 33137 zips) back to top
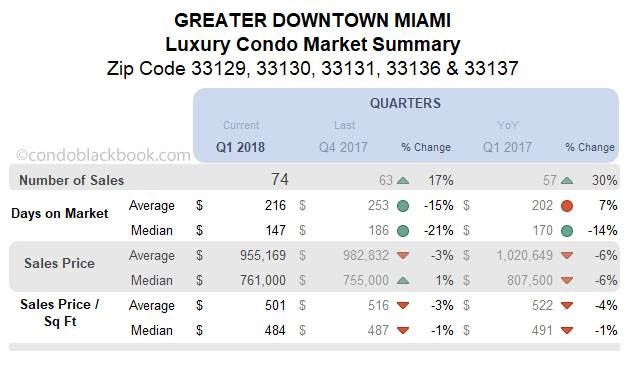
Notable quarterly performance, but trend line still negative. This is one of the few districts in our luxury condo report an increase in quarterly sales over previous quarter and last year. There is a 17 quarter-over-quarter increase and 30% year-over-year increase.(fig. 11.1). March also matched February's sales performance (fig. 11.1.1). However, the district needs a greater push to flip up its negative trend line (fig. 11.1.2)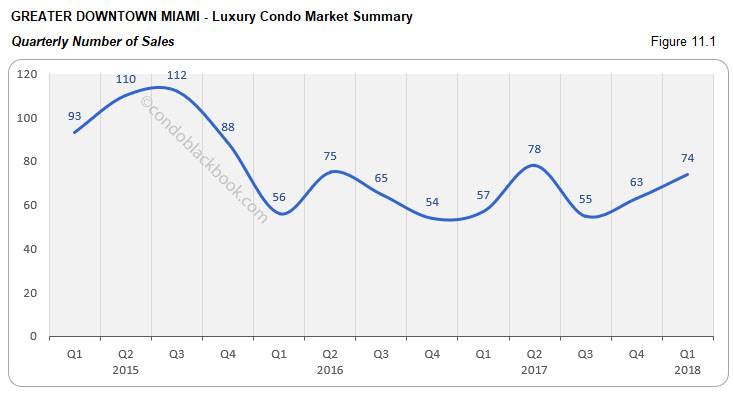
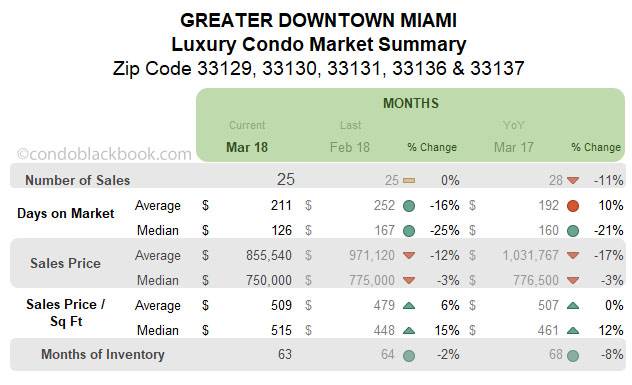
Quarterly and monthly days on market take a dive. In another positive for the district, we see a reduction in the days on market for Q1 and March. The quarterly median days on market reduced 21%, while the month-to-month median reduced 25%. (See fig. 11.2 and 11.2.1)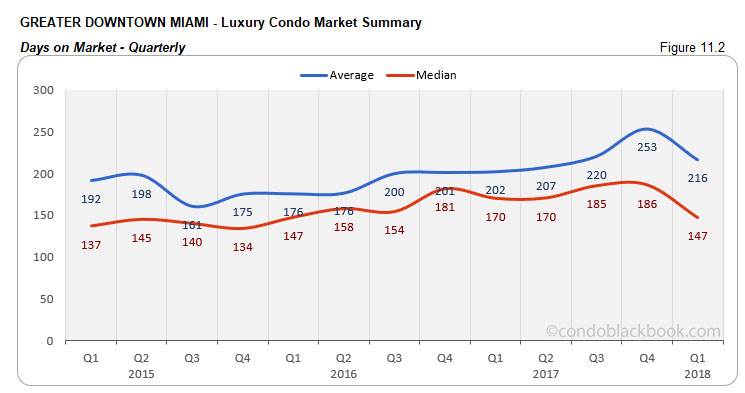
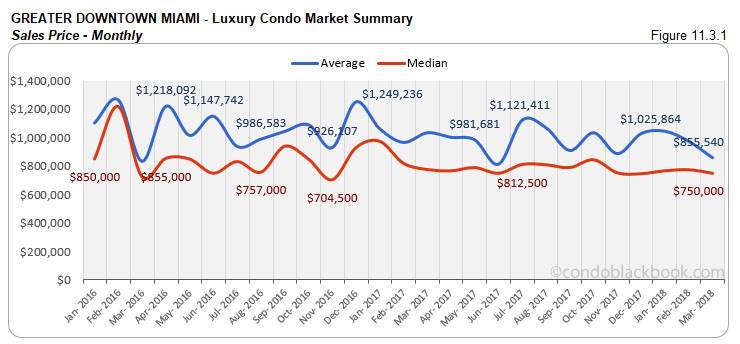
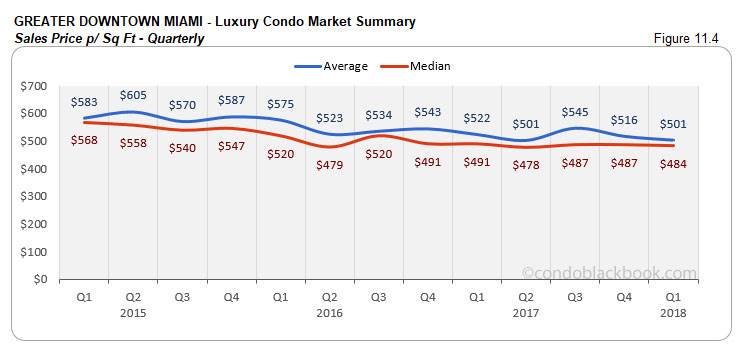
Prices report slight variations. In both the quarterly and monthly charts, we see a variation of only +/- 3% in terms of pricing, suggesting a negligible change for the district. (See fig. 11.3, 11.3.1, 11.4 and 11.4.1)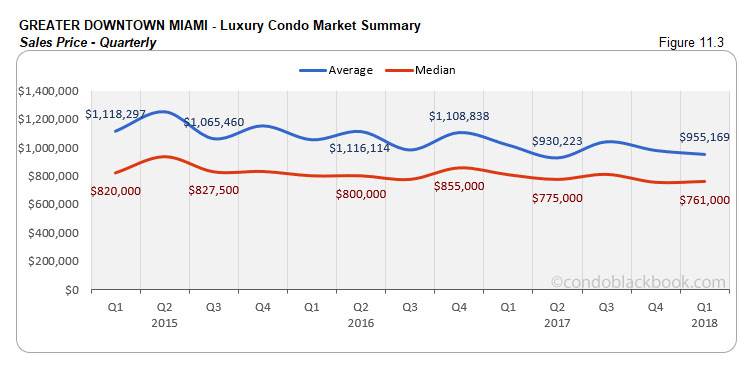
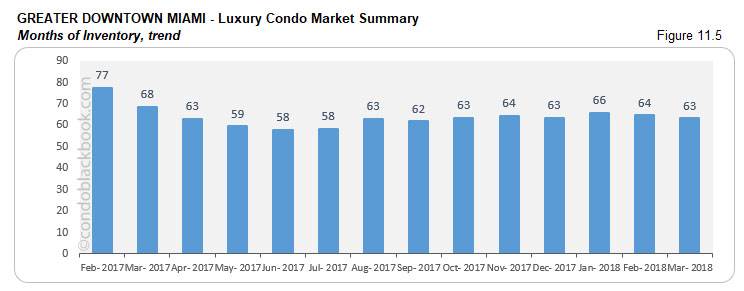
Months of inventory posts reduction. We see the months of inventory decline 2% against last month and 8% compared to same month last year. Though this is a positive, there is still 63 months of inventory left, which is much higher than the 9-12 months of a normal market. With prices hovering and inventory high, buyers hold the advantage and should look for deals in the Greater Downtown Miami area here.
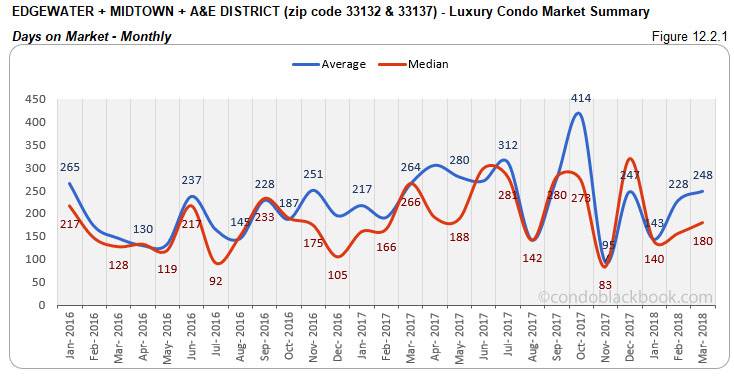
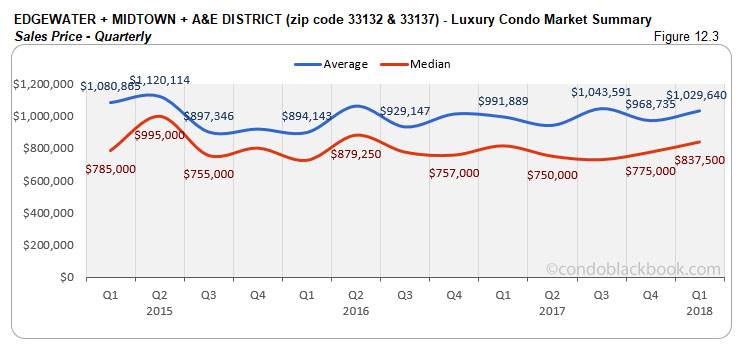
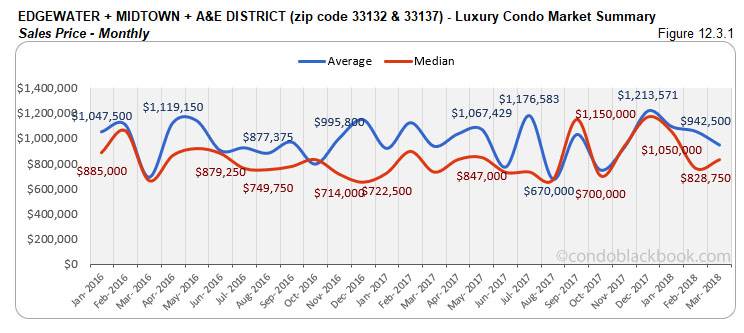
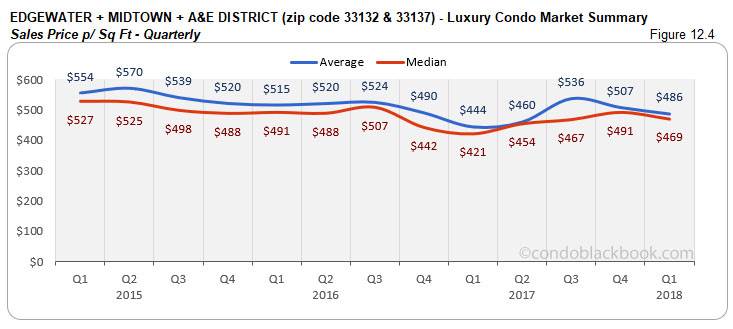
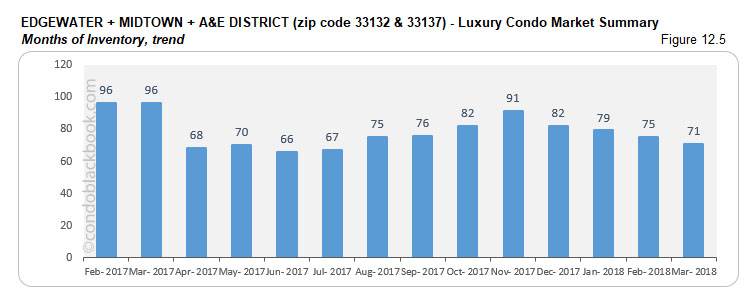
Edgewater + Midtown + A&E District Luxury Condo Market Summary (33132 + 33137 zip) back to top
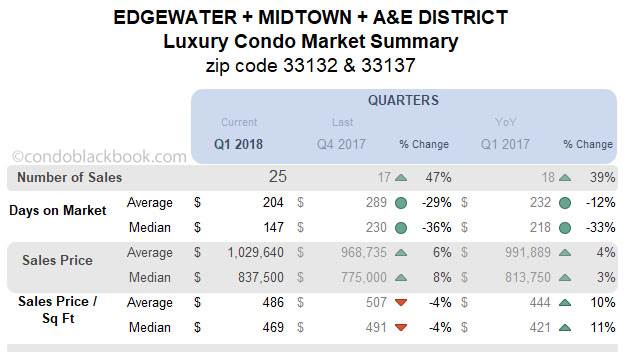
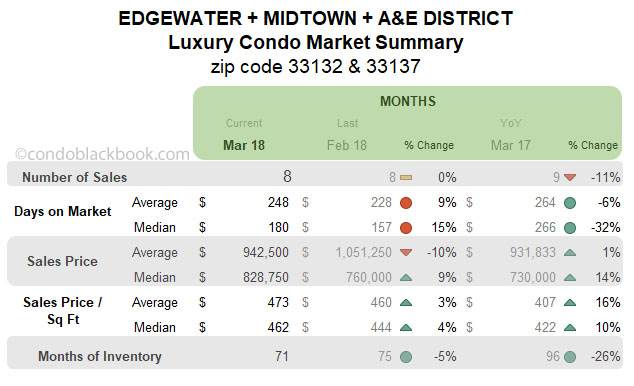
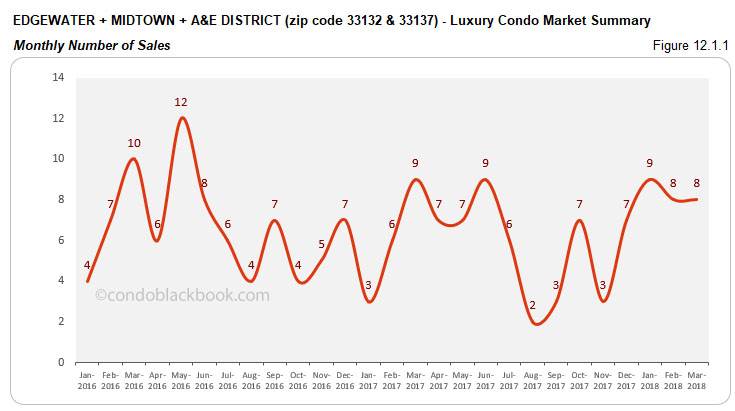
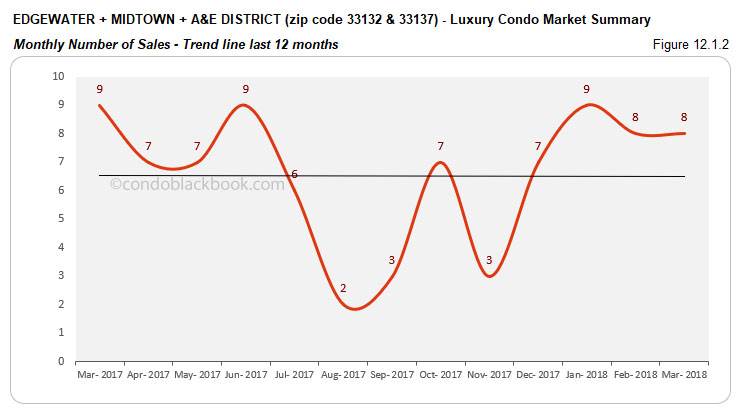
Sales improve QOQ, trend line stays afloat. It is interesting to see this grouping post an increase in its quarterly results (fig. 12.1). We see a 47% increase over last quarter and a 39% improvement over same quarter last year. Also, March matched February’s sales (fig. 12.1.1), making this one of the few neighborhoods with a positive trend line (fig. 12.1.2).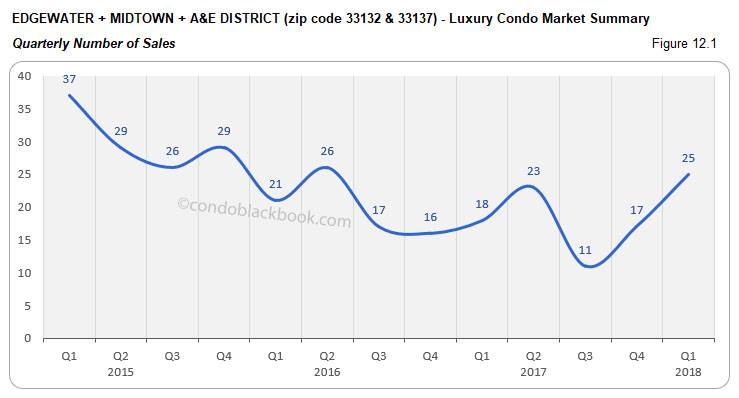
Quarterly days on market decline. In another positive, Q1 posts a decrease in its median days on market. There is a 36% quarter-over-quarter decline and a 33% year-over-year decrease (fig. 12.2) to report.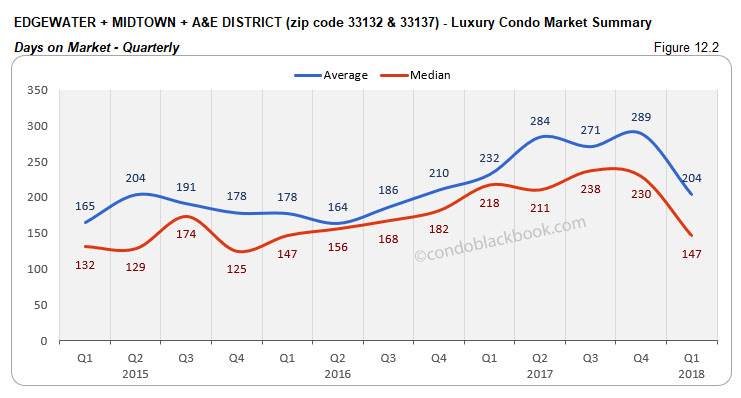
Prices mostly hover. Both the quarterly and monthly price charts hover with only a +/- 10% variation to report. (See fig. 12.3, 12.3.1, 12.4 and 12.4.1)
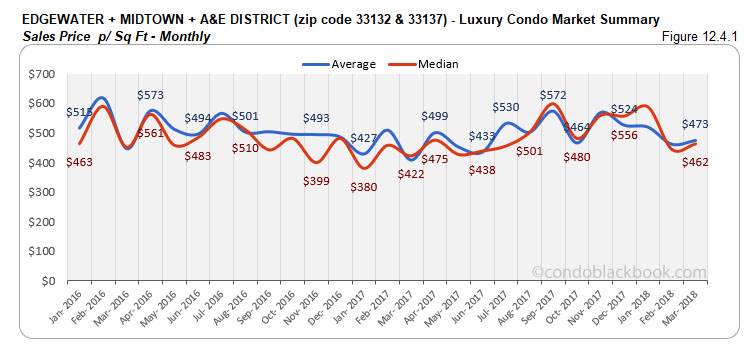
Inventory deflates MTM and YOY. Another sign of progress for this grouping is the reduction in its months of inventory. There is a 5% month-to-month drop and 26% reduction year-over-year. But, 71 months of inventory are way off the ideal 9-12 months of a balanced market, giving buyers the edge as they browse through Edgewater condos for sale here or begin by exploring the individual lifestyle and condo options in Edgewater, Midtown and Arts & Entertainment District.
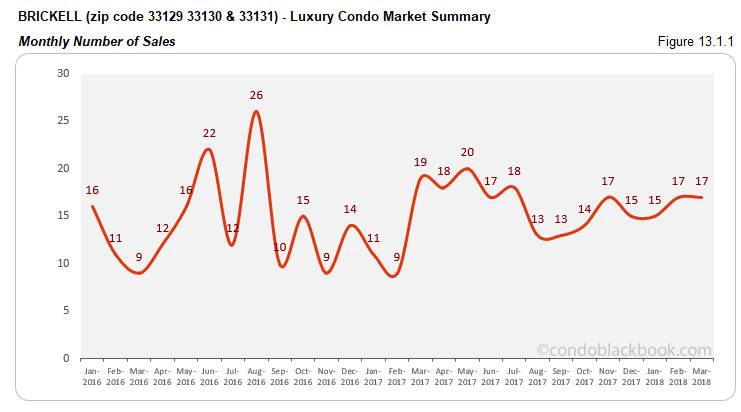
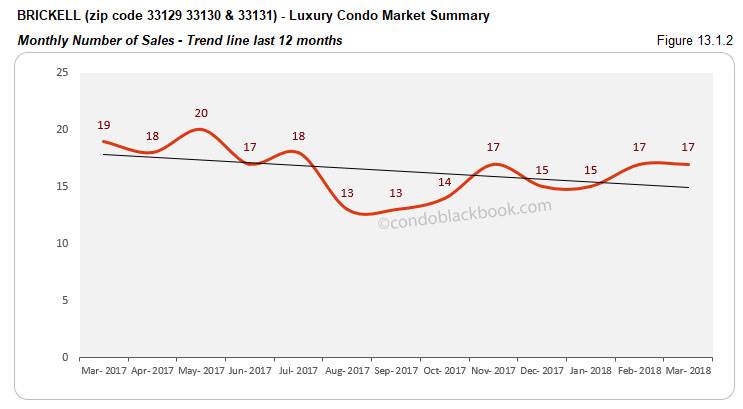
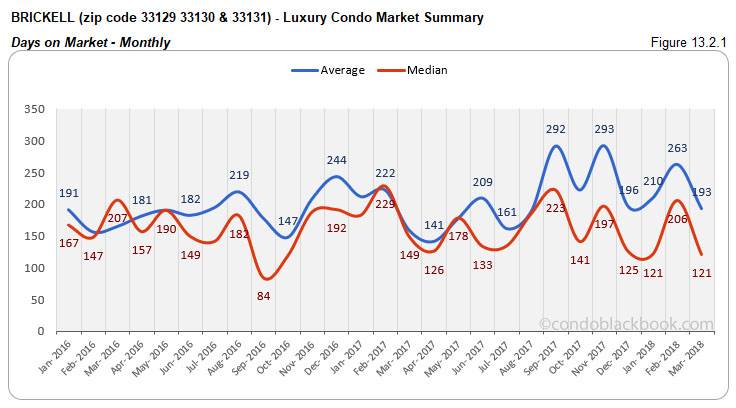
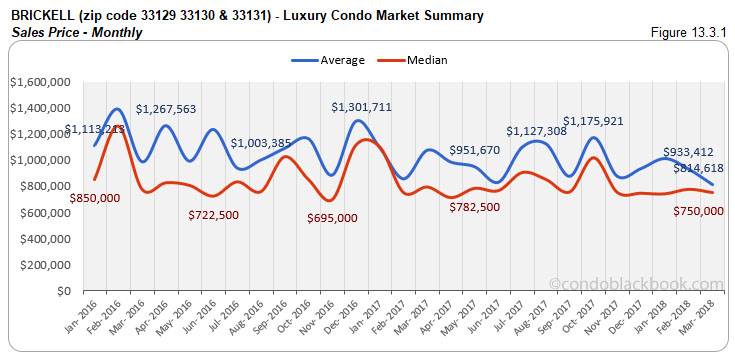
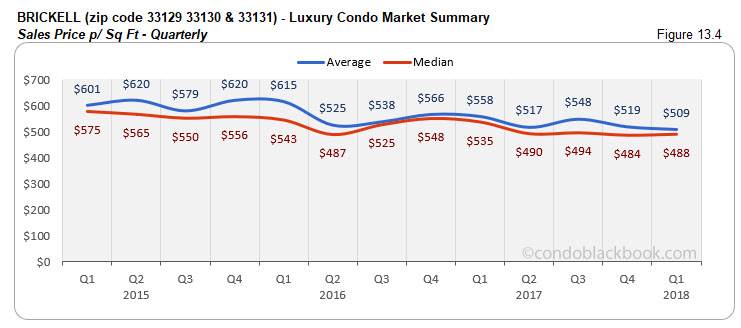
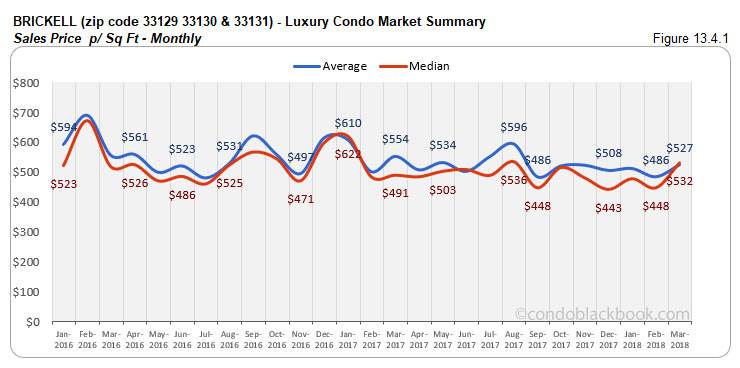
Brickell Luxury Condo Market Summary (33129, 33130, 33131 zip) back to top
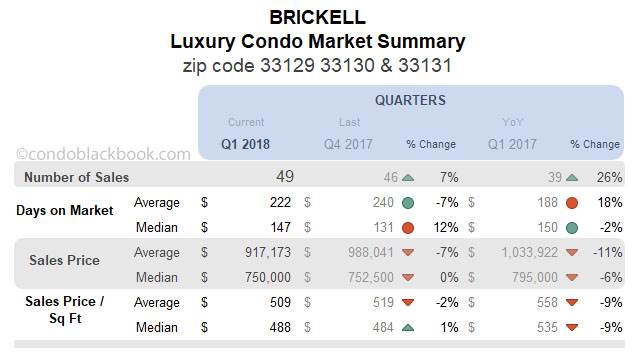
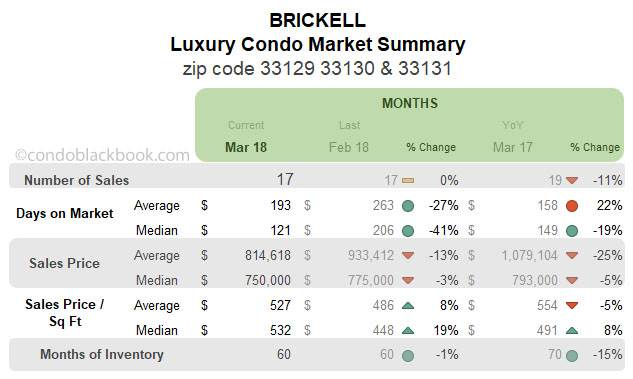
Quarterly sales improve, but trend line still tips. We see a marked improvement in the numbers for the first quarter in Brickell. There is a 7% increase since last quarter and a 26% improvement compared to Q1 2017. Even though sales in March matched February, we see the trend line go negative as the numbers fall 11% compared to same month last year.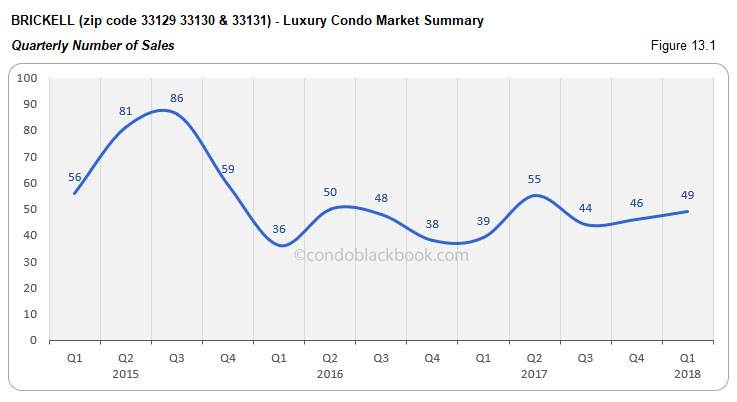
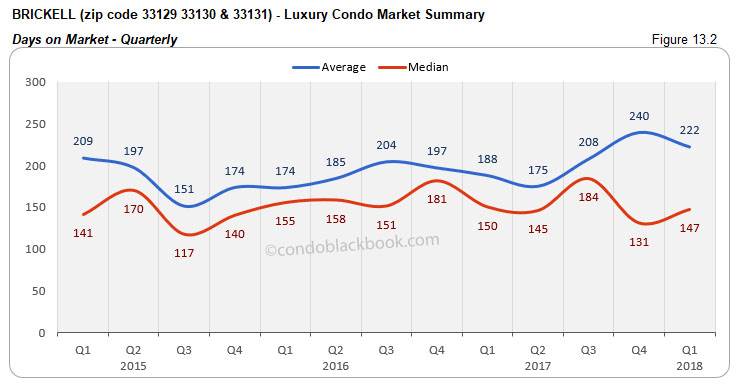
Quarterly prices tip slightly lower. We see a marginal reduction in the median prices in Brickell, both for the quarter as well as March. (See fig. 13.3, 13.3.1, 13.4 and 13.4.1)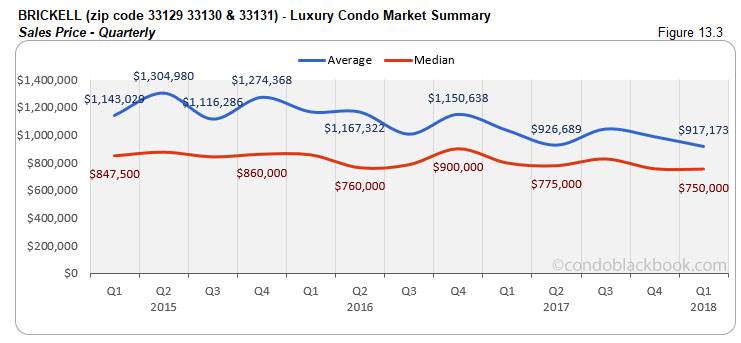
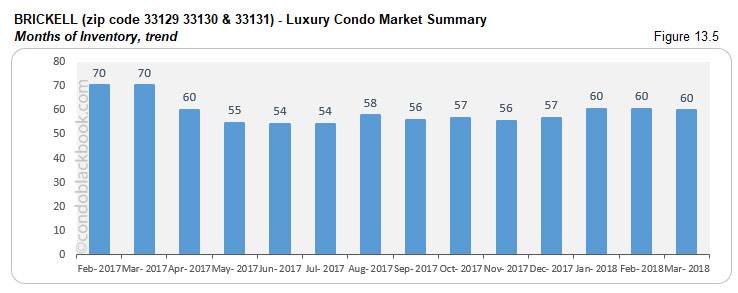
15% drop in YOY inventory. Fig. 13.5 reports 60 months of inventory. While this is still higher than the ideal 9-12 months, it is 1% lower than last month and 15% less compared to same month last year. With ample choice on hand, buyers should grab the opportunity by searching Brickell condos for sale here or by first taking a tour through Brickell here.
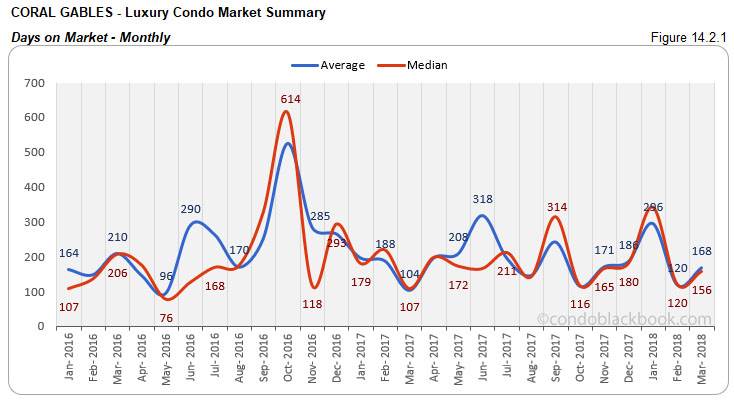
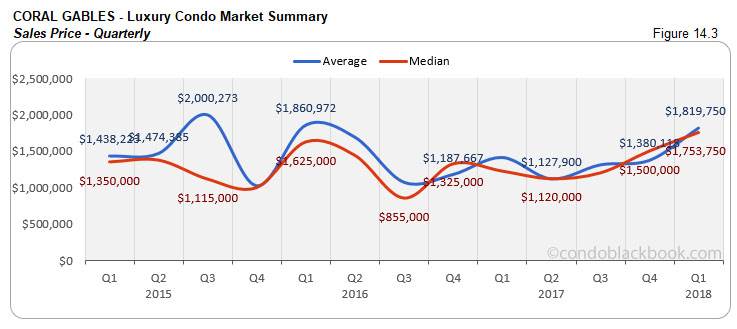
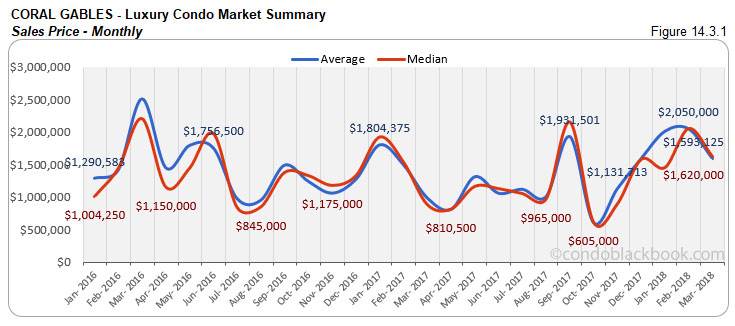
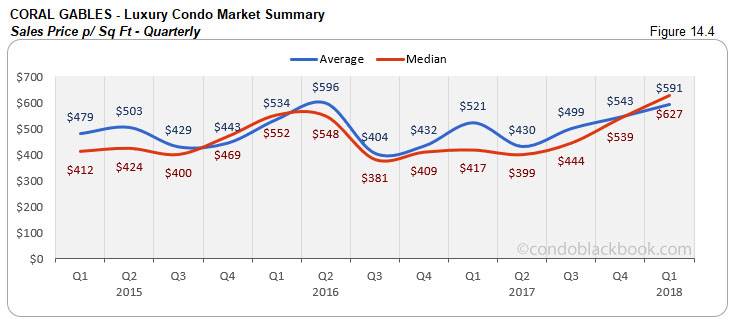
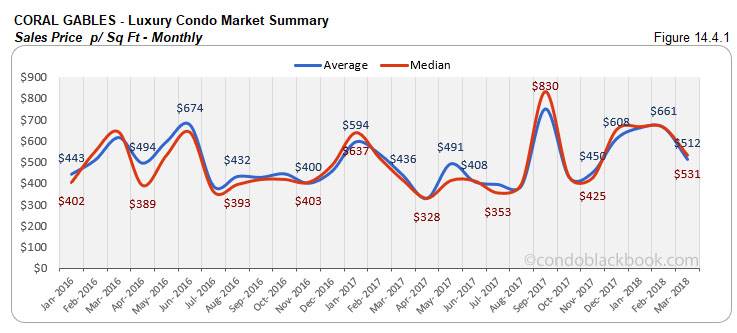
Coral Gables Luxury Condo Market Summary back to top
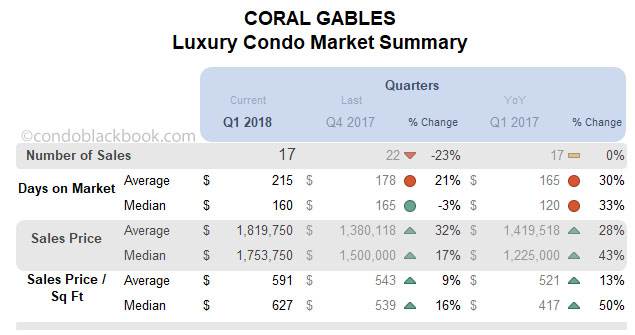
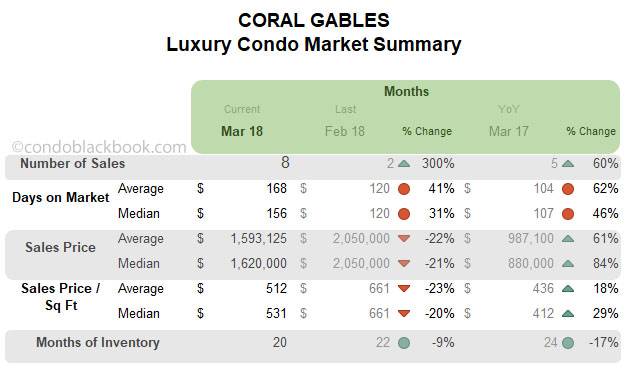
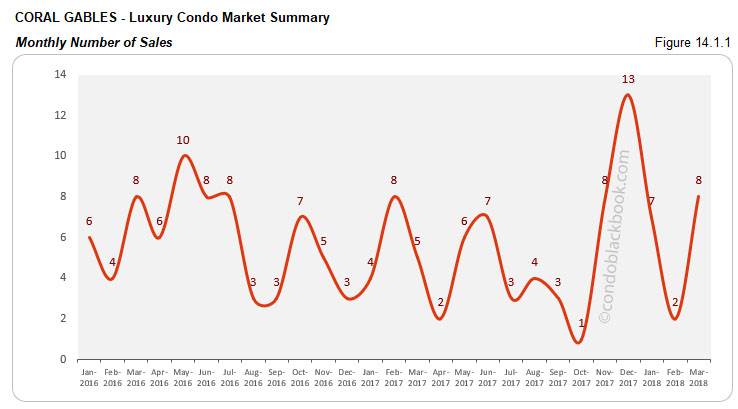
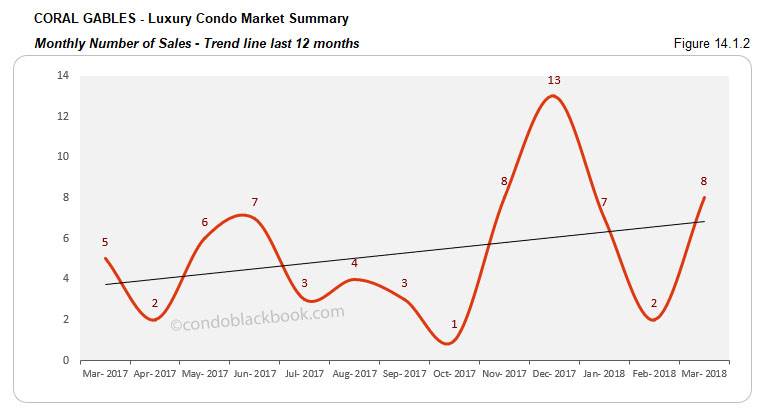
Quarter at par with last year, monthly sales post uptick, trend line stays positive. After a good Q4, we see Q1 closing 23% lower. However, this first quarter has matched last year’s performance (fig. 14.1). Also, the month-to-month sales in March report an improvement of 300% and 60% year-over-year (fig. 14.1.1). This positivity makes its impact is visible in the ascending trend line below (fig. 14.1.2).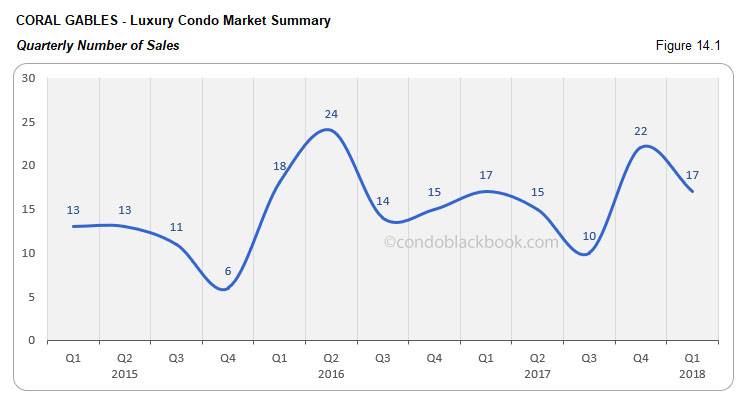
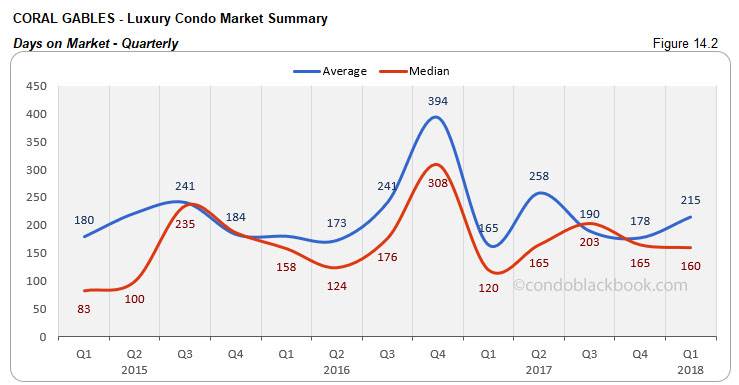
Highly volatile days on market and prices. Since Coral Gables is a small market for luxury condos, it is normal for even a small shift in numbers to cause volatility in the charts. However, it is important to note here that the prices in Coral Gables have mostly reported an upward trend over the past 6 months.
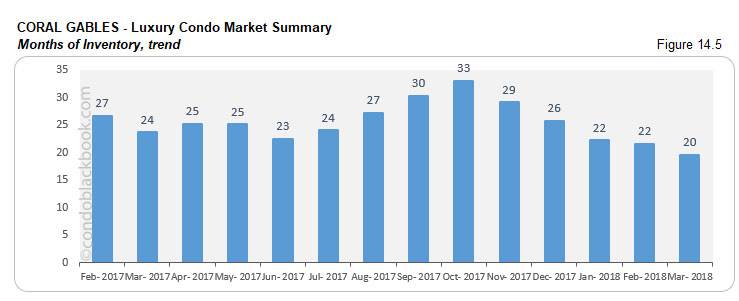
17% decline in YOY inventory. Fig. 14.5 shows 20 months of inventory, making Coral Gables the most balanced neighborhood in our luxury condo report. There is a 9% reduction to report in the month-to-month and 17% reduction in the year-over-year trend. With levels inching towards the ideal 9-12 months, buyers should make haste and search Coral Gables condos for sale here, or check out the lifestyle options in Coral Gables here.
Conclusion back to top
Winter sales unable to deliver expected boost, buyers retain vantage position. Though the sales picture remained positive as Q1 came to a close (with most neighborhoods reporting an improvement over last year) we did not see the expected spring hike. On the other hand, lower days on market and hovering prices indicate that the luxury condo market is attempting to regain its balance. With inventory still high, buyers have more time on their hands to take full advantage of the favorable market conditions and land some great deals while it lasts.
Love what you see? Don’t forget to share our blog and subscribe (see the subscribe link on the top menu) to receive the latest market news in your inbox.
Have any questions? Or see something wrong with the stats? Please contact Sep at sniakan (at) hbroswell.com or call 305-725-0566.
Share your thoughts with us

Your Miami Condo Awaits
Recent Posts


 (305) 697-7667
 (786) 321-7233
  contact@condoblackbook.com

