Luxury Miami Condo Report : May 2017
Jun 18, 2017 June 18, 2017
Miami Luxury Condo Report Overall Market Summary
City and Neighborhood Luxury Condo Reports
Miami Beach Luxury Condo Report
South Beach Luxury Condo Report
Bal Harbour Luxury Condo Report
Sunny Isles Beach Luxury Condo Report
Coconut Grove Luxury Condo Report
Greater Downtown Miami Luxury Condo Report
Edgewater / Midtown / A&E District Luxury Condo Report
Coral Gables Luxury Condo Report
Miami Luxury Condo Market Report: Summary back to top
We’re back with the latest in the luxury condo segment in Miami. Our in-depth, neighborhood-wise report features trends for condos priced over $600,000. Take a look at what May’s numbers had to say.
Overall Market Highlights:
- Overall monthly sales up 21%, signs of recovery creep in
- Prices are down, with the overall median sales price and price/sq. ft. decreasing month-on-month and year-over-year
- ‘Days on market’ climb up, but realistic prices could help push these down
- Months of inventory again reduces 5%, showing steady progress
- Buyers’ market continues with prices coming down to accommodate buyer demands
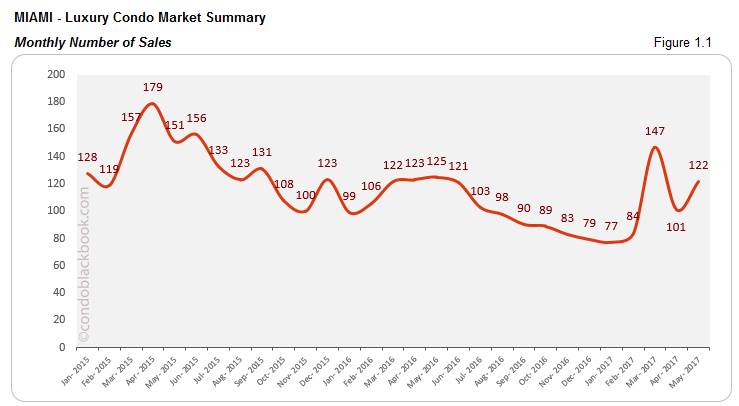
Sales volume springs back up, big cheer. May is the second month of the year to post such a positive uptick in sales, with most neighborhoods reporting an increase. The month gained 21% more sales over April, but lagged 2% behind May 2016. However, if we were to take a look at the six months before March (fig. 1.1), the numbers were nowhere close to touching the sales trend of 2015. So, now that the luxury condo market is back on the road to progress, we’ll be keeping a close watch to let you know when the scales are about to tip over.
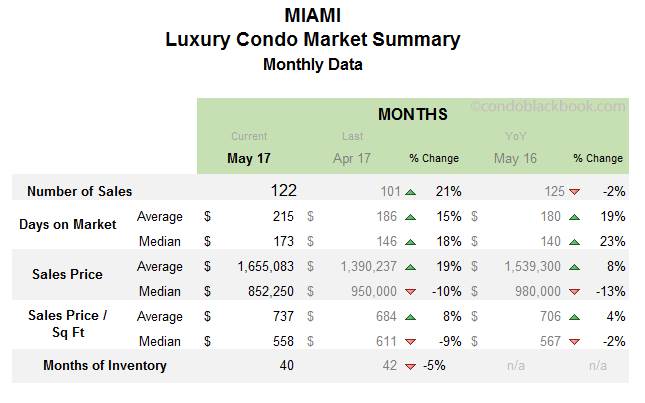
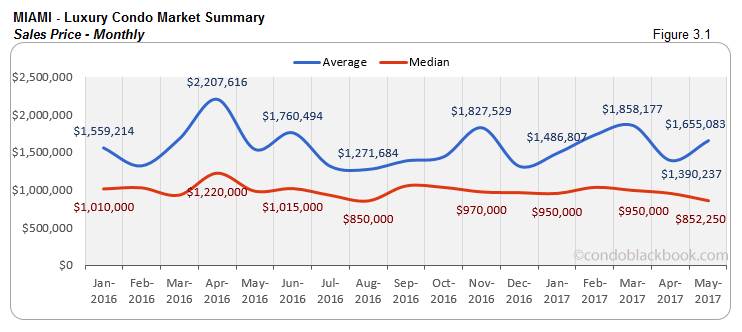
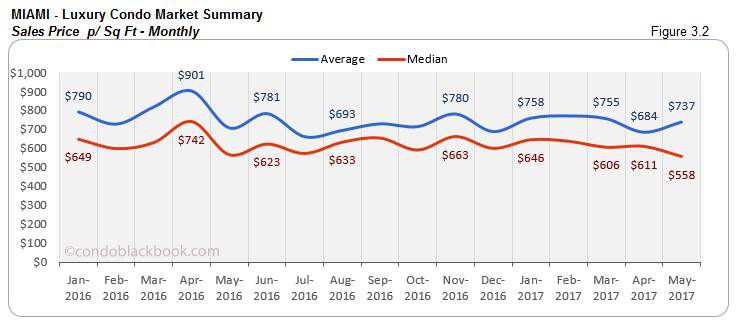
Lower prices fuel sales. Looking at the overall market summary chart below, it’s clear how a buyer’s market has been pushing down median prices, even if slightly. This in turn fueled sales. The median price per square foot in Miami is down to $558, which is 9% lower than last month’s $611 and 2% lower than last year’s $567. Fig. 3.1 and 3.2 also reveal that the average prices are headed in the opposite direction. The reason why we can’t take those trends seriously is because averages can easily be influenced by a handful of ultra-luxury sales.
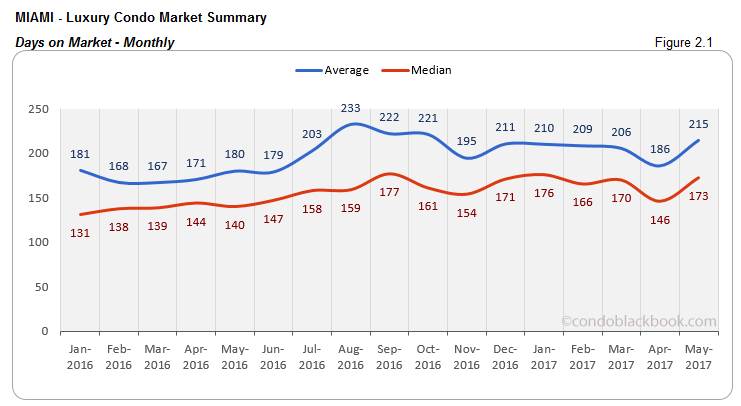
Days on Market treks upward, but inventory lower. With all the rumble in the sales section, we were hoping for a big dip in the ‘Days on Market’ (fig. 2.1). But that didn’t happen. It seems that sellers who have had their properties on the market for long are now waking up to reality and finally being flexible enough to get their properties sold. If this theory holds true, we expect to see the days on market drop in coming months.
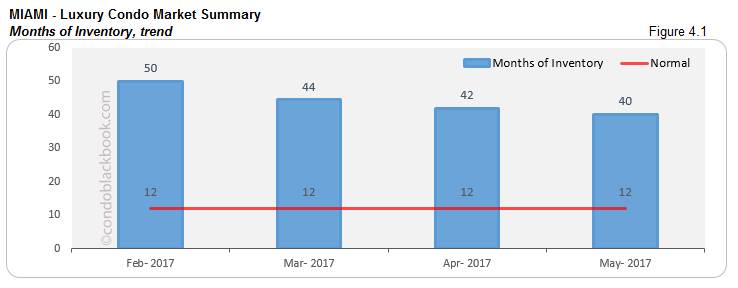
On the other hand, inventory has steadily been decreasing, which is definitely a positive for the luxury condo market. But, 40 is still a long way off from the 12 months of a balanced market.
Overall, I’d say the luxury condo market in Miami is showing signs of an improvement. There are lots of positives to report. However, we’ll have to wait and watch for these trends to continue before we can finally conclude that the market is up for a recovery. Till then, prospective buyers can enjoy the luxuries (read negotiation power) a buyer’s market brings along.
How Did We Land Into Pent Up Inventory And A Buyer-Driven Market, and Where Do We Go From Here? back to top
Looking at the glut of inventory, it’s easy for most to blame pre-construction condos for the rut the luxury condo market has been stuck in. However, we’ve already discussed in-depth in previous reports how a strengthening U.S. dollar, strong stock market, Zika, shaky start to the presidency and a desire for tax breaks by the wealthy are actually to blame for the sales slowdown.
Of all these factors, Zika’s effects may be wearing off, but we still have a lot of other obstacles to work through before the market can find its footing and absorb this surplus inventory. Until that happens, buyers will remain in control of the market, as is visible from recent price drops, and sellers will need to remain flexible.
Below is an insight into Miami’s overall and neighborhood-level luxury condo trends for May 2017:
Monthly Number of Sales - Miami Luxury Condo Market Overall back to top
- Optimistic streak continues as overall sales pick up pace. After an excellent month of March, April came up a little short. However, in last month’s report we mentioned how holding on to optimism will pay off, and it actually did. May’s overall luxury condo sales (fig. 1.1) have jumped 21% over April’s, making quite the recovery.
- Could this be a comeback? After a quiet start to the year, we saw a big spike in March sales. However, April’s numbers couldn’t match up, but they still did better as compared to the last 6 months (see fig. 1.1). Now, with May posting another growth spurt, the trend is definitely moving towards a positive. If this enthusiasm continues over the next couple of months, we could finally find ourselves on the way to a balanced market.
Days on Market - Miami Luxury Condo Market Overall back to top
“Days on market” are the total number of days from when a property is active to the day it closes.
- Days on Market increase month-on-month and year-over-year. After posting a drop last month (see fig. 2.1), it is a bit surprising for the days on market to show an increase, even with better sales numbers. This could simply mean that sellers have had their units on the market for long, and are finally giving in now by being more negotiable. With the prices adjusting in upcoming months and sales picking up, we will see this trend drop as opposed to rise.
Sales Price Trends - Miami Luxury Condo Market Overall back to top
- Buyer’s market drives down overall median prices. It seems buyers are in the know, as they’ve used the luxury condo market situation to steadily push down both sales price and price/sq. ft. The overall median sales price in Miami is down 10% month-on-month and 13% year-over-year. Same goes for sales price per square foot, where we have a 9% decrease from April and 2% year-over-year reduction (refer overall market summary chart).
- Why average prices are still up? Both Fig. 3.1 and 3.2 report a reduction in the median prices, but an increase in the averages. The simple reason behind this mismatch in trends is that average prices are quite volatile; a few ultra-luxury sales can easily influence them up. And, this is exactly what we see in the charts below.
Inventory Trends - Miami Luxury Condo Market Overall back to top
A balanced market will only have 9-12 months of inventory.
- 40 months of inventory. In May, there were 3.77k active luxury condos listings on the market, plus another 188 pending. With inventory moving at an average (last 6 months) of 99 deals a month, there is still 40 months of inventory on the market.
- 5% decrease repeated. Slowly, but steadily we see an improvement in the months of inventory (fig. 4.1). There has been a constant reduction. This shows that the market is picking up pace and with sellers bringing down prices to a realistic level, buyers are getting their motivation back. However, it is still a long wait before we get back to the normal of 9-12 months.
City and Neighborhood Market Reports
Miami Beach Luxury Condo Market Summary back to top
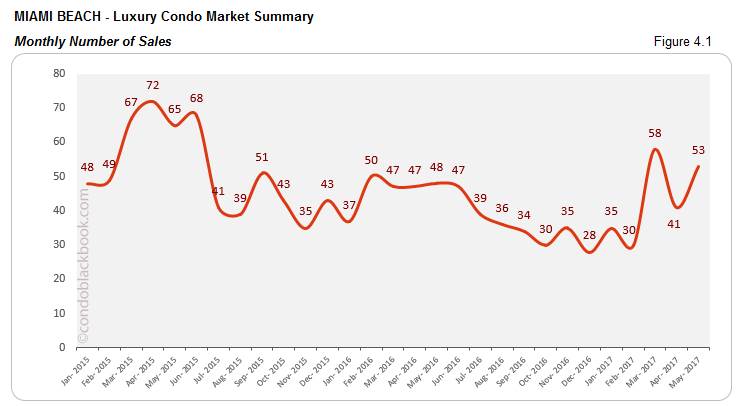
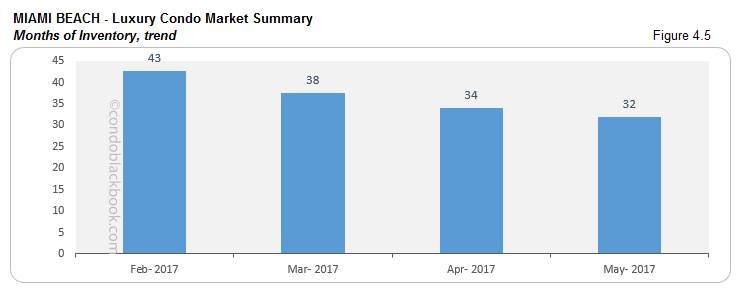
- Mimicking overall market trends. We see the same overall trends for luxury condos repeated in Miami Beach, with better sales and lower prices getting inventory off the market.
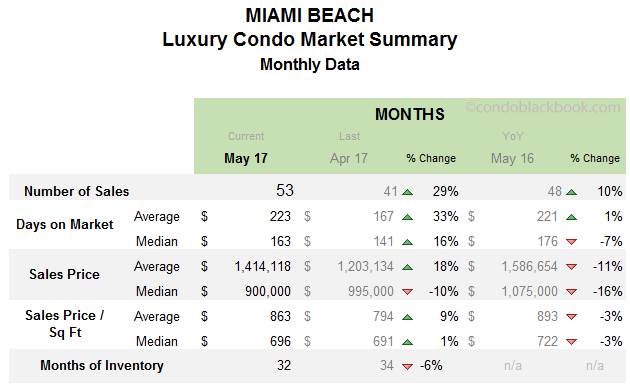
- Sales volume bounces up 29%. The market is up again after April’s regrouping and it shows (fig. 4.1). Not only did the monthly sales post an uptick, May’s sales even performed 10% better than last year (Miami Beach market summary chart).
- Better sales = 6% lower inventory. For May, Miami Beach had 1206 active luxury condo listings plus 72 pending. Considering inventory had been moving at an average (last 6 months) of 40 deals a month, the barrier island has 32 months worth of inventory on hand, which is 6% lower than April. Although there is steady improvement in the months of inventory (fig. 4.5), we are still way off from the 9-12 months of a balanced market.
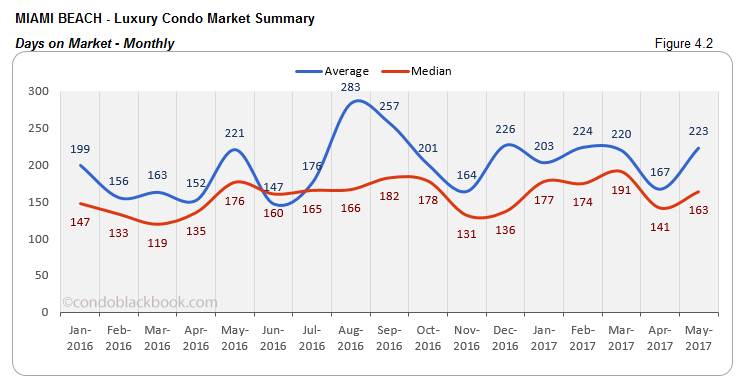
- Days on market up 16%, but historically lower. The Miami Beach market summary chart below reveals that luxury condos are taking longer to get off the market, with the median days up by 16%. However, this is still 7% lower than last year’s median. You can see the complete trend in fig. 4.2 below. A shift towards realistic prices and continued better sales can help drive the trend down.
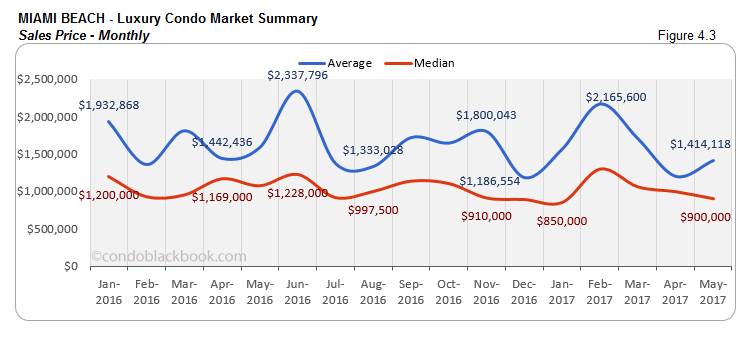
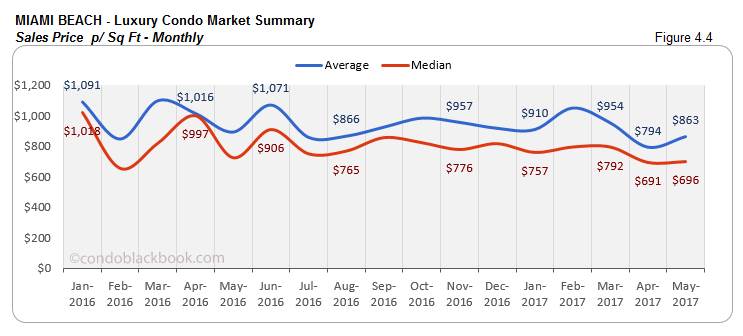
- Buyer’s market prevails, pushes down prices. Buyers have started using their market leverage with negotiations to drive down prices. The Median sales price (fig. 4.3) has dropped 10% since April and 16% year-over-year. The median price per sq. ft. (fig. 4.4) has only come up 1%, but is down 3% year-over-year. With a buyer-friendly market and the incentive of lower prices, it’s the perfect time to explore your options and look at Miami Beach condos for sale here.
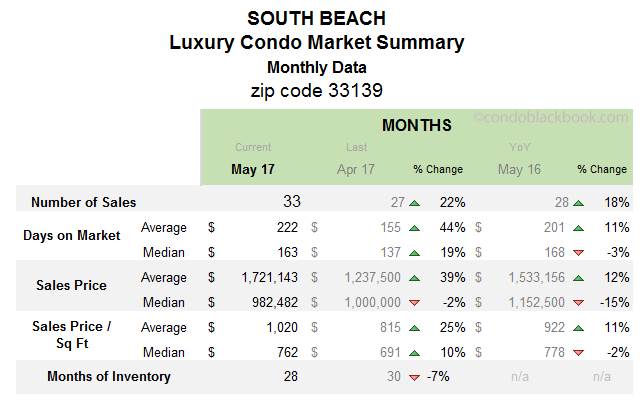
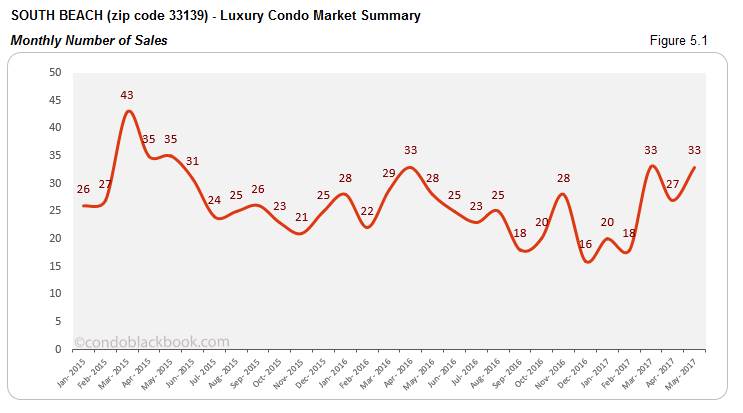
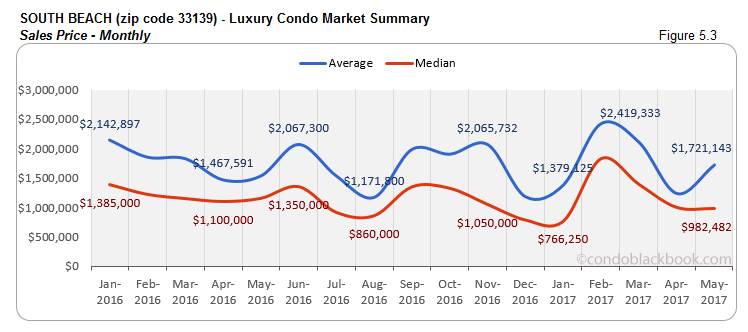
South Beach Luxury Condo Market Summary (33139 zip) back to top
- Luxury condo trends in sync with overall, except price per sq. ft.
- Sales up 22%. The growth trend continues in South Beach as May sales match March’s upswing (fig. 5.1). This month sales registered a 22% increase over April and 18% increase year-over-year.
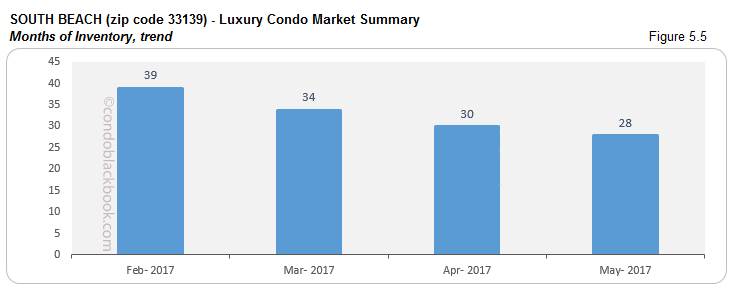
- Higher sales push inventory down 7%. This upswing in sales isn’t just a positive sign for the market, but also one with positive effects. May saw 660 active luxury condo listings plus 35 pending on the market. Taking an average (last 6 months) of 25 deals a month, South Beach is now sitting on 28 months of inventory. Fig. 5.5 shows how inventory is gradually descending to reach the ideal 9-12 months of a balanced market.
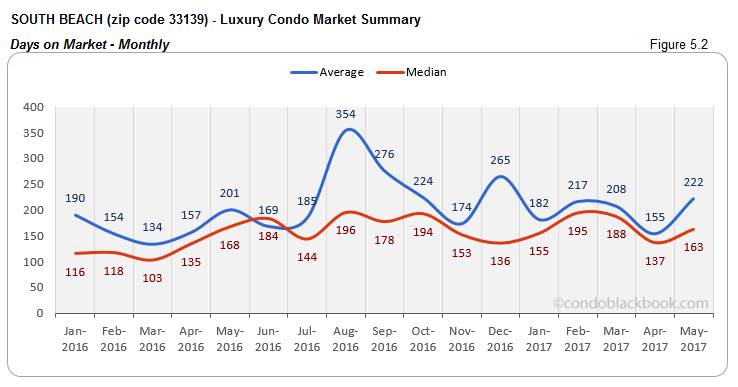
- Median days on market up by 19%. May went ahead to post an increase in days on market, which should have descended as well with an uptick in sales. However, the median went up 19%, meaning sellers still need to adjust pricing and be more flexible if they want their property to get off the market. Surprisingly though, the median days on market were 3% lower than last year (South Beach market summary chart).
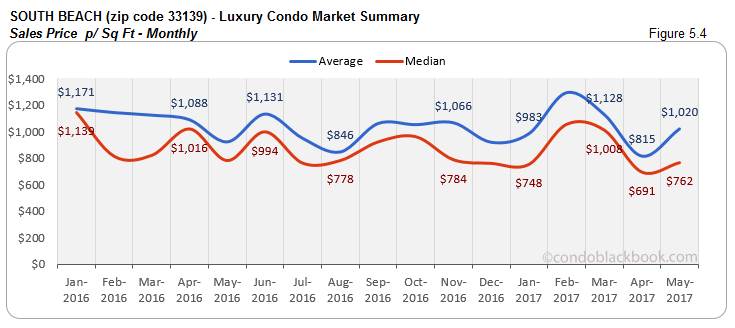
- Prices down, buyers still rule. The effects of the current buyer’s market can be felt as the median sales price goes down 2% (fig. 5.4). But I guess South Beach is South Beach, so median price per sq. ft. went 10% higher touching $762 (fig. 5.4), but still 2% lower than last year’s $778. Make the most of this buyer’s market by searching South Beach condos for sale here or look up this destination neighborhood’s lifestyle and amenities here.
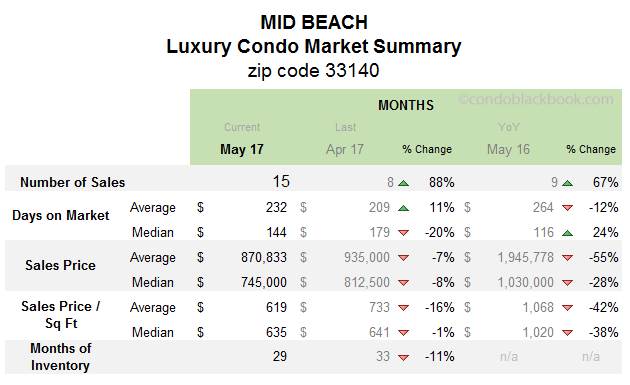
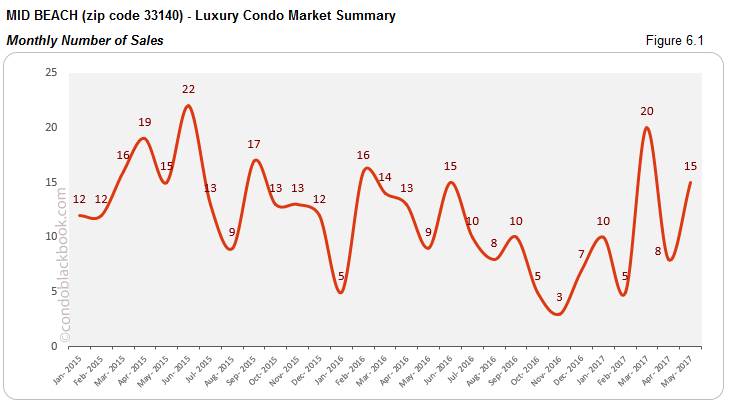
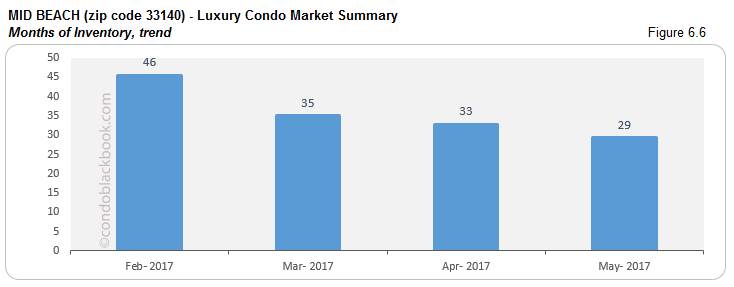
Mid-Beach Luxury Condo Market Summary (33140 zip) back to top
- Huge 88% jump in sales. Mid-Beach has one of the strongest comebacks to report since April, with an 88% increase in sales volume. May’s sales were also 67% higher than last year. That’s quite the leap for this chic neighborhood (fig. 6.1).
- Great sales drive inventory down 11%. In May, Mid-Beach had 267 active luxury condo listings to report, plus another 18 pending. With its (last 6 months) average of 10 deals a month, there’s still 29 months of inventory on the market. Though this is significantly higher than the 9-12 months of a balanced market, it’s easy to see the gradual decline in fig. 6.6.
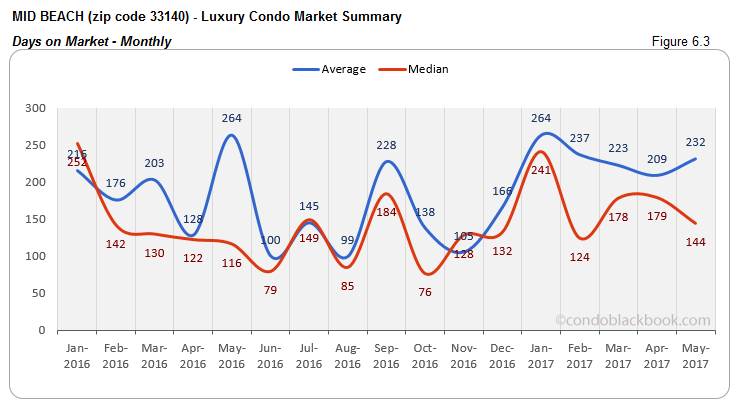
- Days on Market down 20%. Moving positively against the overall luxury condo market trend in Miami, Mid-Beach’s median days on market have actually reduced (fig. 6.3) following its big jump in sales.
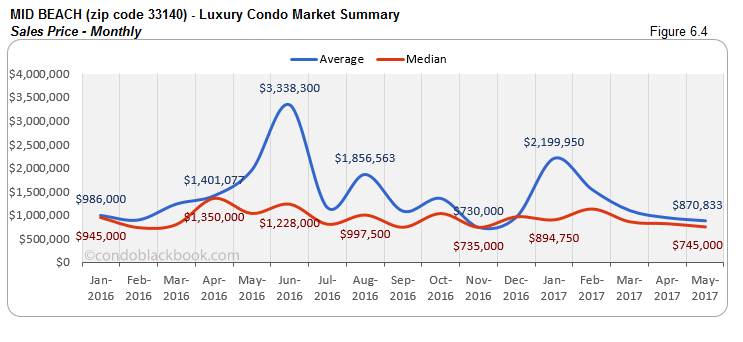
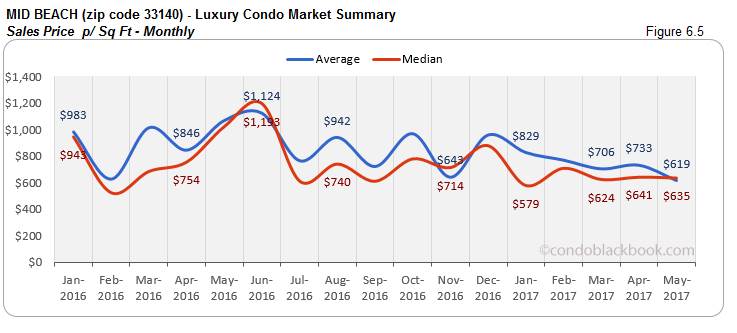
- Prices fall, buyers have the advantage. One of the most noticeable effects of a buyer’s market is the lowering of prices, which is now visible in fig. 6.4 and 6.5. The median sales price has dipped 8% over April and a whopping 28% year-over-year. The sales price per sq. ft. is also down 1% since April and a massive 38% since last year. With the market and prices favoring buyers, it’s worth searching Mid-Beach condos for sale here or take a tour around Mid-Beach to see what has buyers so interested.
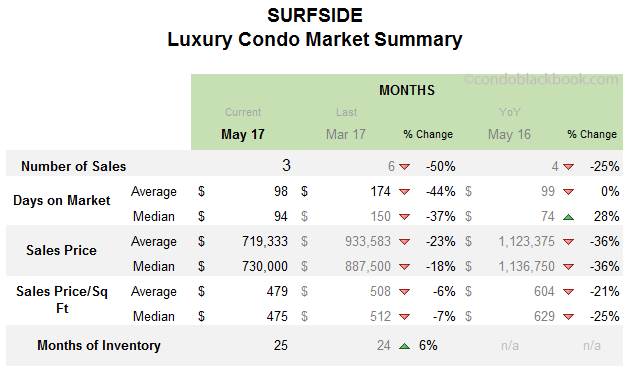
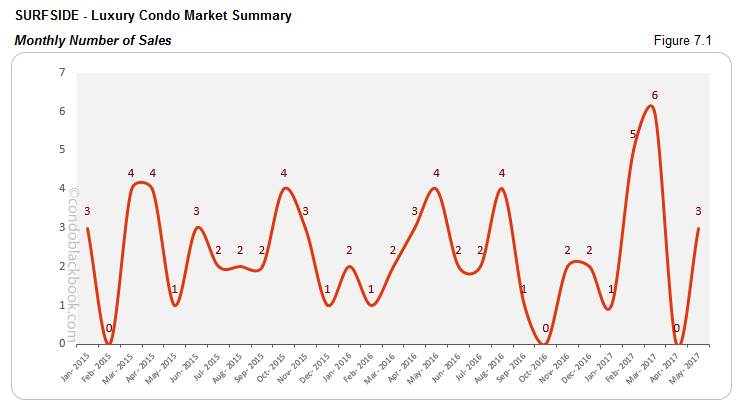
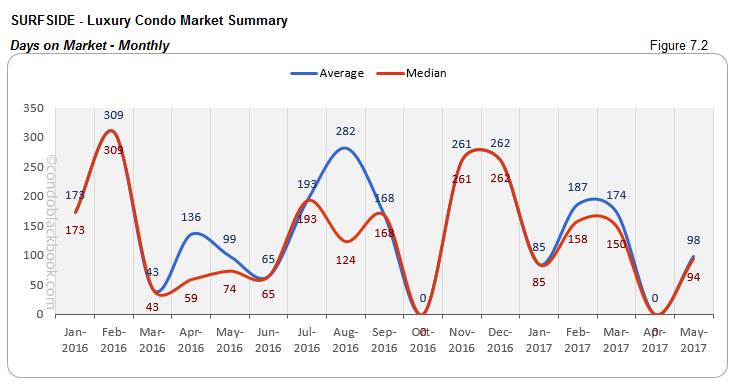
Surfside Luxury Condo Market Summary back to top
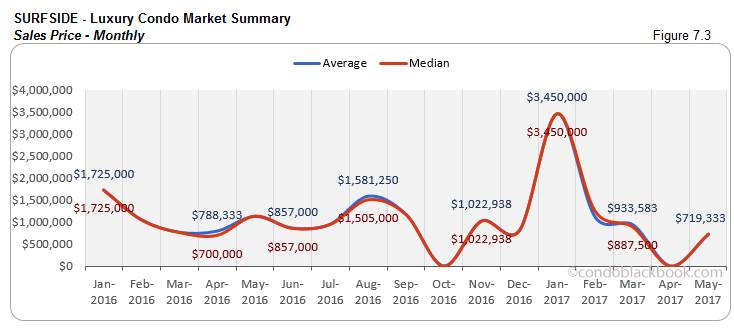
- Trends not reflective of overall market, except prices. Since April had no sales to report, we’ve made comparisons with March for the market summary below. So, while any sale would have been better than April’s zero, fact is, it doesn’t match up to March’s spike. But, as mentioned in earlier reports, Surfside is a small beach community with historically fewer luxury condo sales to report. So, it usually neither reflects, nor influences overall trends.
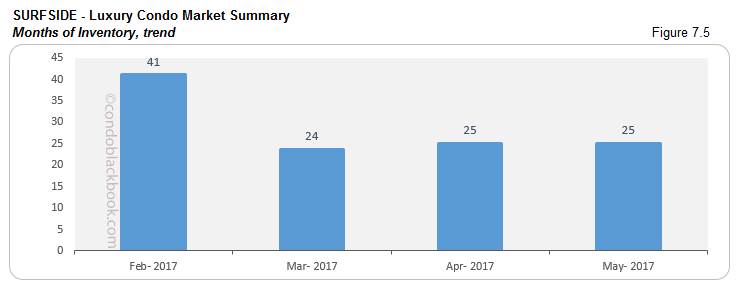
- 25 months of inventory. Surfside reported 66 active luxury condo listings plus 2 pending in the month of May. With inventory moving at an average (last 6 months) of 3 deals a month, the pocket-sized neighborhood has 25 months of inventory left on the market. That’s much higher than the 9-12 month normal (fig. 7.5).
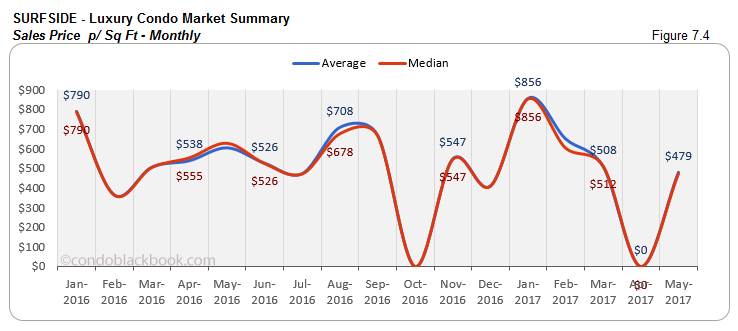
- Prices significantly lower. Fig. 7.3 and 7.4 show how prices have gone down since March, which is perhaps why sales took place in May after a no-show April. Both, the median sales price and price per sq. ft. are lower month-on-month as well as year-over-year. With such discounted prices, it’s a great time to search a Surfside condo for sale here, or see what lifestyle makes up the chic Surfside community.
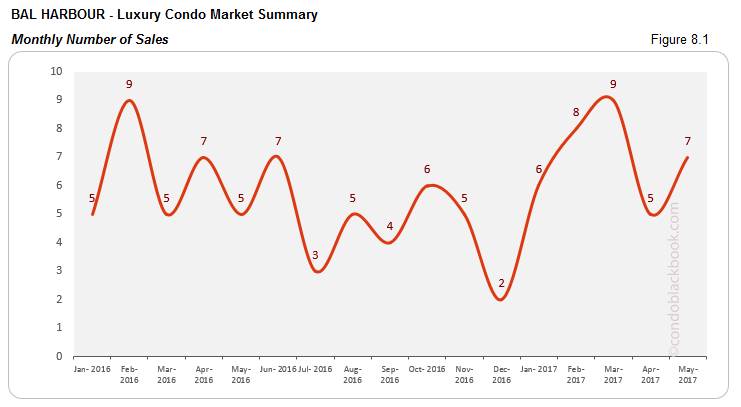
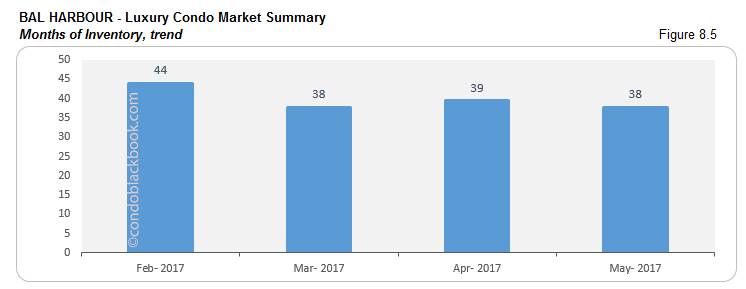
Bal Harbour Luxury Condo Market Summary back to top
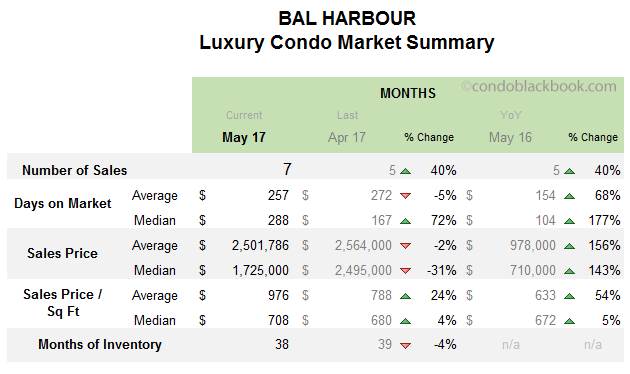
- Sales jump 40%. Bal Harbour reports an increase in sales (fig. 8.1), just like the overall numbers in Miami this month. The rise in luxury condo sales in the neighborhood is 40% higher than last month and last year (Bal Harbour market summary chart). All others sales stats also jumped compared to the previous year, including median sales price while sales price per sq ft crept upward. It looks like we had a strong month in newer properties which come with bigger ticket prices this year as opposed to last year.
- Increase in sales pushes inventory down. The overall trend (fig. 1.1) is visible in this upscale neighborhood as well. The increase in sales made its impact felt by lowering the months of inventory by 4%. May reported 214 active luxury condo listings in Bal Harbour, plus 12 pending. Considering inventory moves at an average (last 6 months) of 6 deals a month, we’re still looking at 39 months’ worth on the market (fig. 8.5). That’s significantly higher than the 9-12 months of a balanced market.
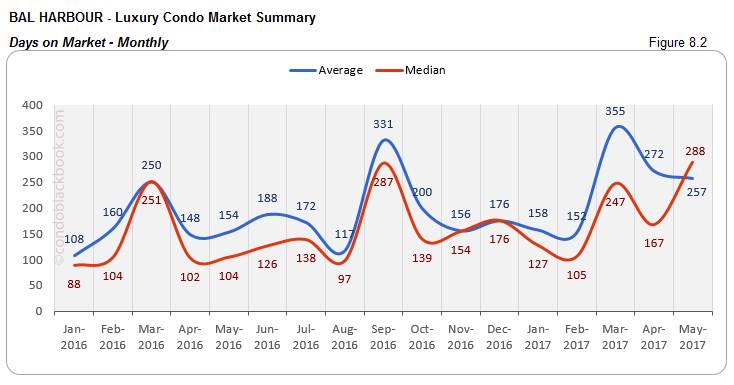
- Median days on market still move up. In spite of making progress with sales, Bal Harbour reports a 72% increase in the median days on market for its luxury condos (fig. 8.2). Again, we believe that owners that have had their units on the market a very long time are coming down to reality, so we expect the days on market trend to dip in coming months.
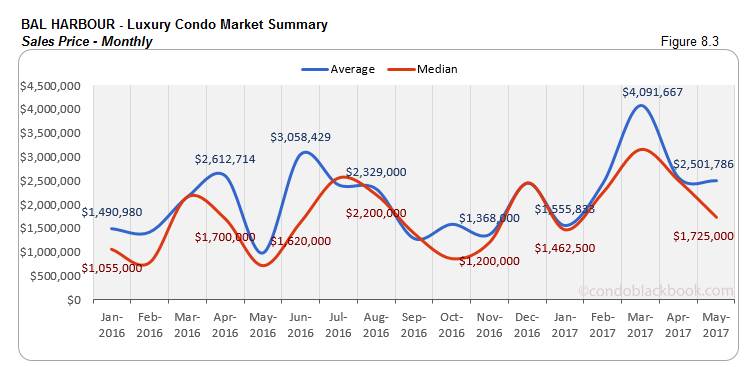
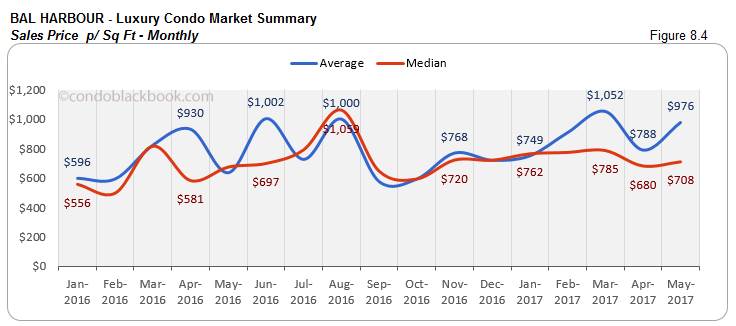
- Price drops, buyers retain edge. Just like the overall luxury condo market stats, Bal Harbour’s median sales price (fig. 8.3) has dropped 31% month-on-month. However, the price per sq. ft. (fig. 8.4) has gained ground with a 4% increase since April. Nonetheless, the market still favors buyers, giving buyers control over negotiations. Click to see what makes Bal Harbour a top pick for upscale living, or make the most of this buyer’s market by searching Bal Harbour condos for sale here.
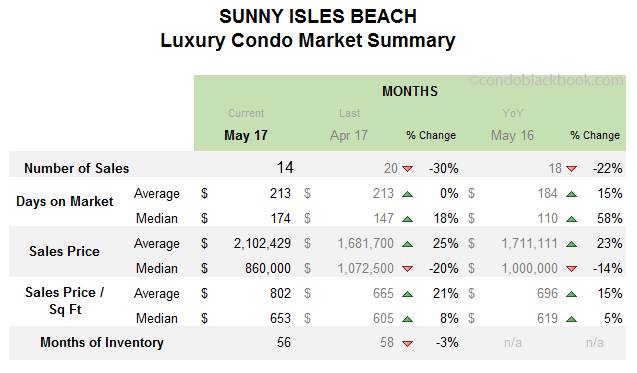
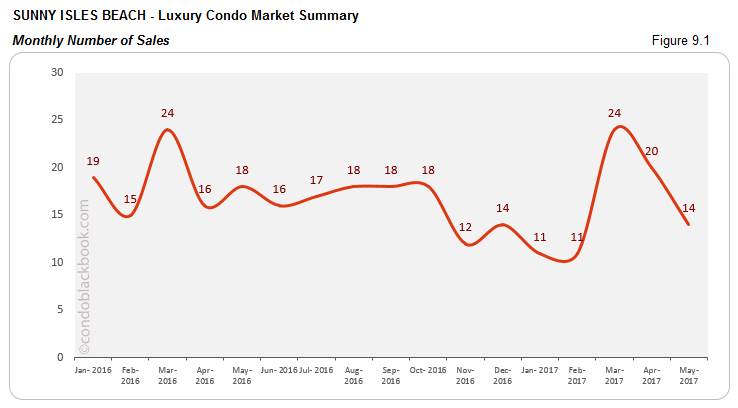
Sunny Isles Beach Luxury Condo Market Summary back to top
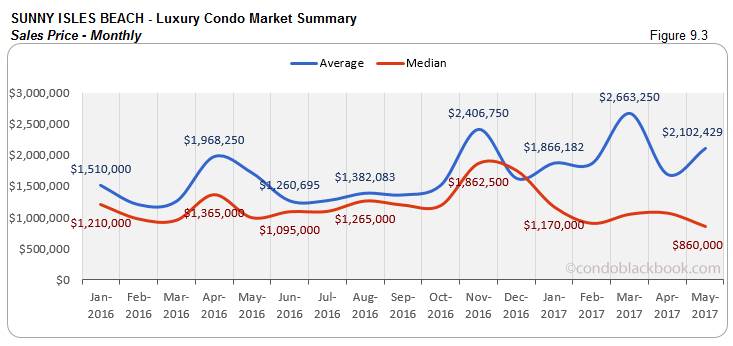
- Downward trend continues on sales. The luxury condo story changes a bit in Sunny Isles Beach. This is the second month that the beach town reports a dip in sales (fig. 9.1), 30% to be precise. However, these sales numbers are still better than the months preceding March.
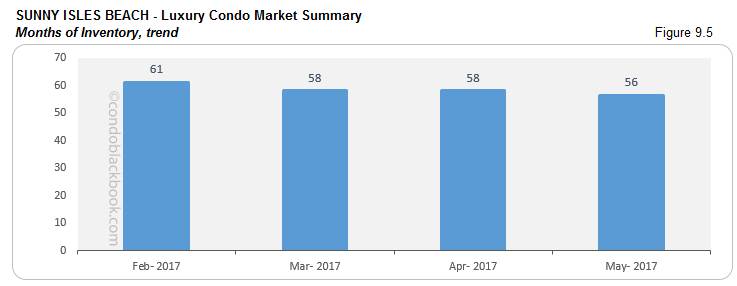
- Months of inventory decrease, but for how long. In spite of the dip in sales, it’s good to see that inventory is down 3%, even though it’s a far cry from the 9-12 month normal. May saw 828 active listings plus 26 pending in the neighborhood. With its average (last 6 months) of 15 deals a month, Sunny Isles Beach still has 56 months’ worth on the market (fig. 9.5). However, if the sales trend continues its downward trek, then the recent market recovery will be lost here.
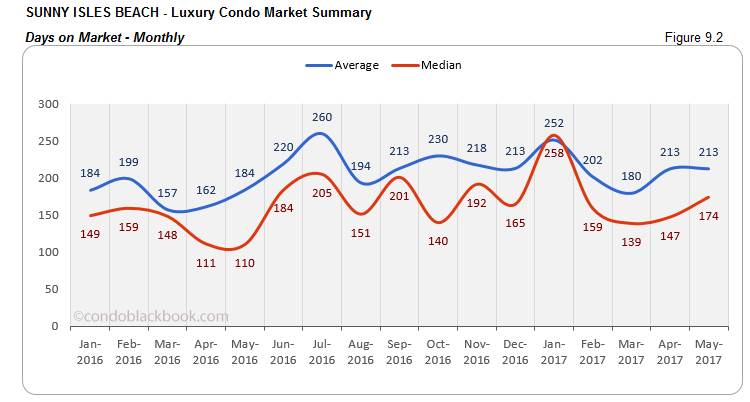
- Days on market rise 18%. Luxury condos are sitting on the market in Sunny Isles Beach for a median of 174 days (fig. 9.2). This is 18% longer than April and 58% higher than last year. Sellers definitely need to re-adjust pricing and expectations for the move to speed up.
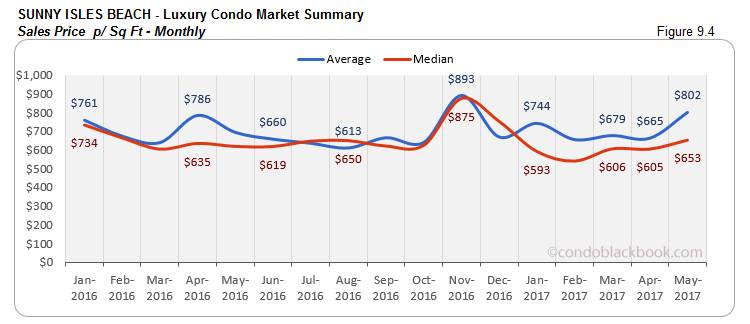
- Prices down, buyers have upper hand. The median sales price (fig. 9.3) in the beach town has dropped 20% since April and 14% since last year. However, the price per sq. ft. rose 8%. Still, with the such high inventory on hand, buyers have the upper hand in driving negotiations. This would be the right time to search Sunny Isles Beach condos for sale here or tour the amenities and lifestyle of Sunny Isles Beach here before making a decision.
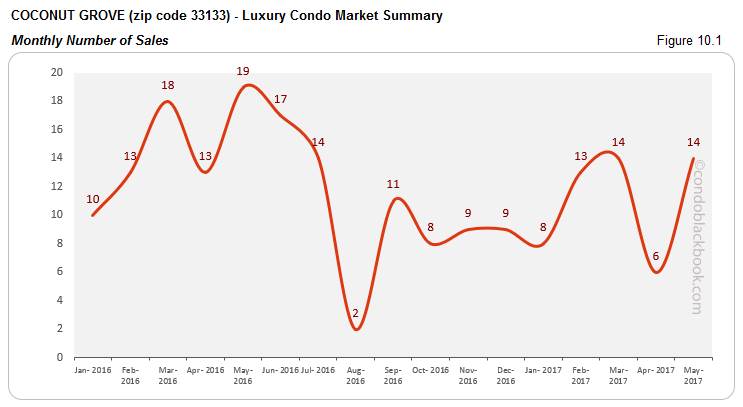
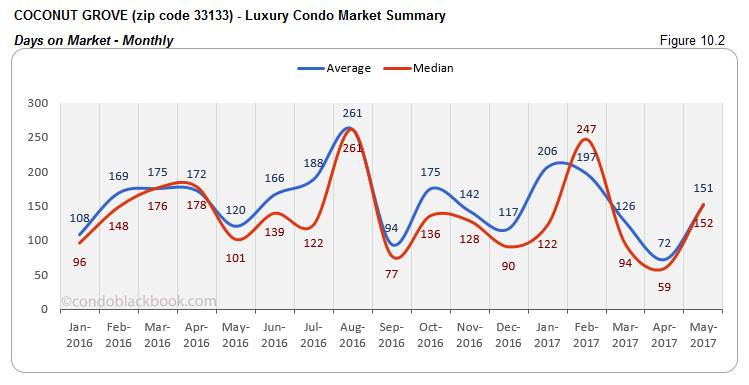
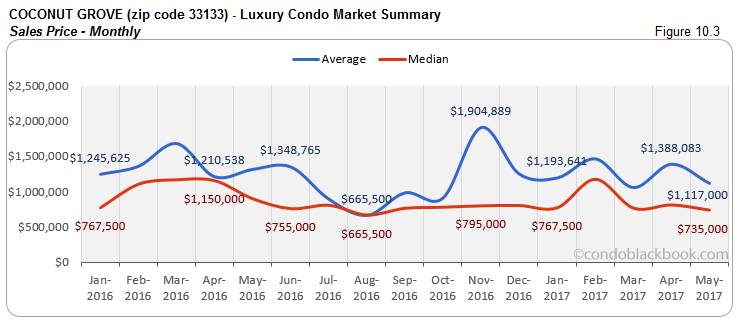
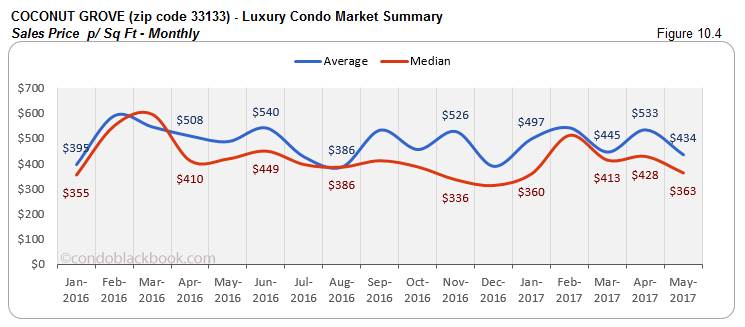
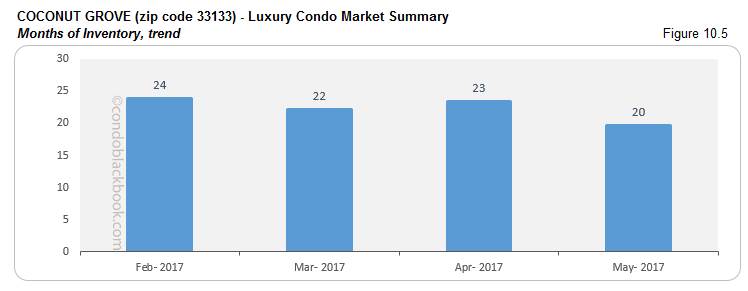
Coconut Grove Luxury Condo Market Summary (33133 zip) back to top
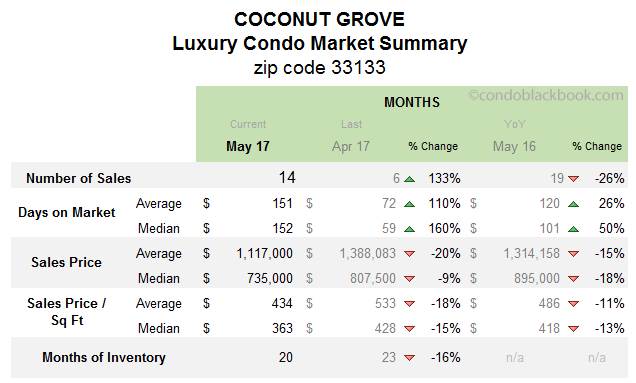
- Big jump in sales for early bird of recovery. With a 133% increase in sales from April, Coconut Grove has posted one of the strongest recoveries of all neighborhoods. This early bird of recovery (as sales got a jumpstart in February, fig. 10.1) is making strides, as luxury condo sales are back up to match March’s exceptional performance.
- Sales jump = 16% dive in months of inventory. Closest to achieving the ideal 9-12 months of a balanced market, Coconut Grove posted a 16% decline in inventory. May reported 184 active luxury condo listings with another 21 pending. Considering the vibrant neighborhood’s average (last 6 months) of 10 deals a month, it still has 20 months’ worth on the market (fig. 10.5).
- Days on market inflate. Despite all the progress, we are yet to see a decline in the days on market for Coconut Grove, like the overall trend (fig. 2.1). The median days on market are up 160% month-over-month (fig. 10.2).
- Prices decline, buyers get advantage. Coconut Grove has posted a 9% decline in its median sales price (fig. 10.3) and 15% decline in price per sq. ft. (fig. 10.4). Lower prices reaffirm the strong hold of buyers on the market. See what lifestyle options exist in the historic Coconut Grove, or search Coconut Grove condos for sale here.
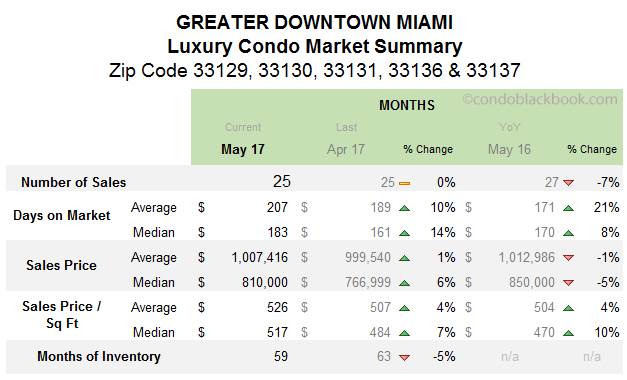
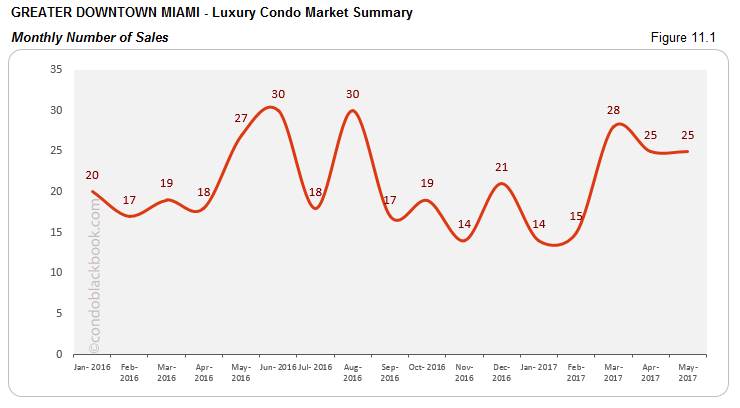
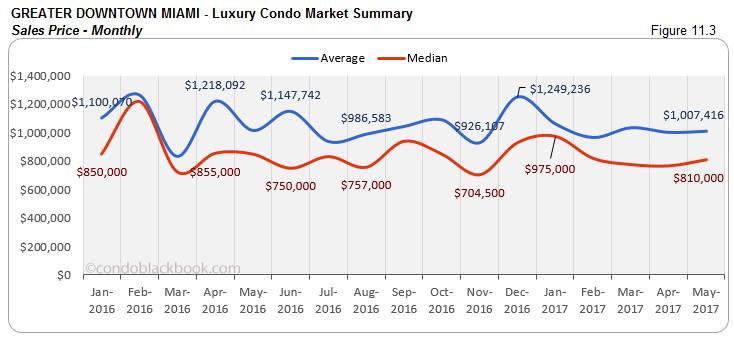
Greater Downtown Miami Luxury Condo Market Summary (33129, 33130, 33131, 33136, 33137 zips) back to top
- Same sales as month before. May posted the same sales as April, which weren’t that far along from March’s exceptional show.
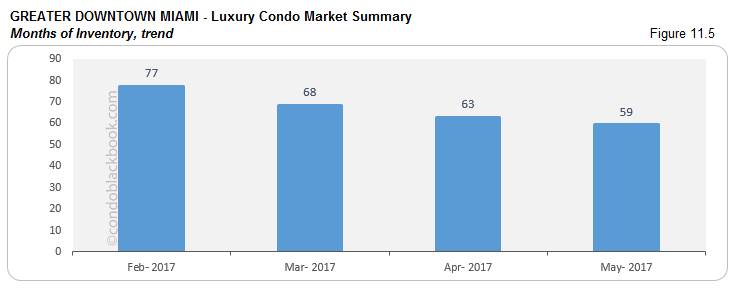
- Inventory down 5%. By keeping up its numbers, the Greater Downtown area has been able to bring down inventory steadily (fig. 11.5). May had 1169 active luxury condos listed on the market, and another 35 pending. Taking an average (last 6 months) of 20 deals a month for the neighborhood, there is still 59 months of inventory left on the market. This is still way higher than the 9-12 month normal of a balanced market.
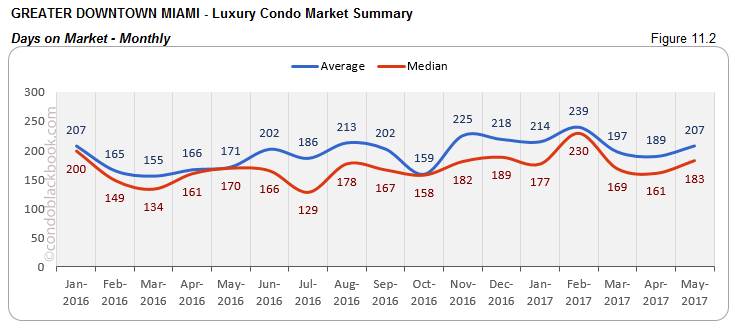
- Days on market up 14%. Luxury condos are still taking longer to get off the market, with the median days on market (fig. 11.2) registering at 14% higher than April. It is also 8% more than last year (Greater Downtown market summary).
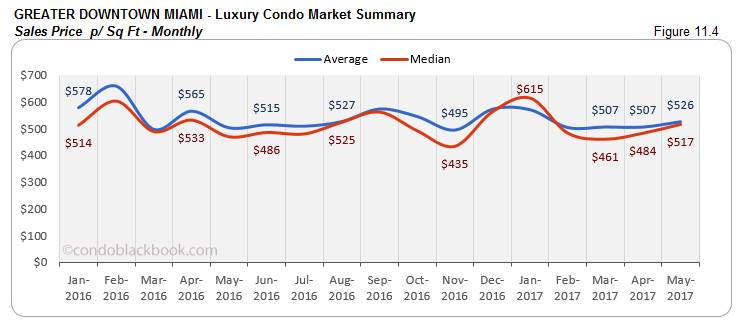
- Prices hold and increase in buyer’s market. It’s quite peculiar to see the prices in Greater Downtown holding their ground, even as the overall market (fig. 3.1, 3.2) and other sub-markets report a decline. It could be because of the newly delivered projectsboosting the numbers as they command higher overall prices than existing ones. The median sales price (fig. 11.3) is up 6% and the median sales price per sq. ft. (fig. 11.4) is up 7%. However, with the market favoring buyers, they still have the upper hand in negotiations. Click to see what condos are available in the Greater Downtown Miami area.
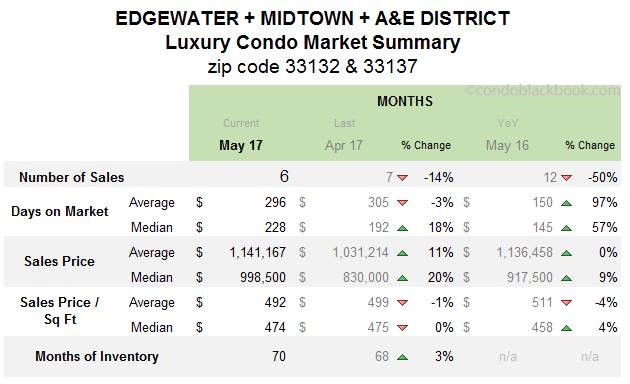
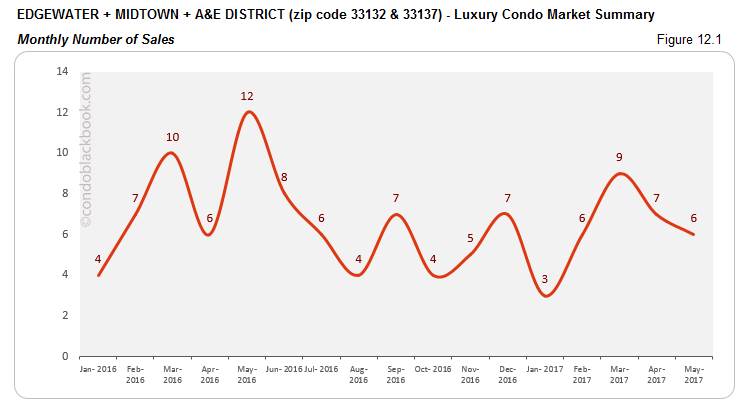
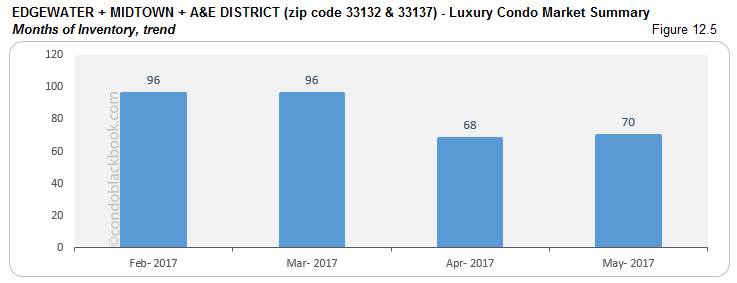
Edgewater + Midtown + A&E District Luxury Condo Market Summary (33132 + 33137 zip) back to top
- Slower sales, not reflective of market overall. The Edgewater, Midtown, Arts & Entertainment District grouping reported a 14% decrease in sales.
- Inventory up 3%. May reported 420 active luxury condo listings with another 11 pending. Considering inventory moves here at an average (last 6 months) of 6 deals a month, there is still 70 months of inventory to get through for the grouping (fig. 12.5). This is way higher than the 9-12 month normal of a balanced market.
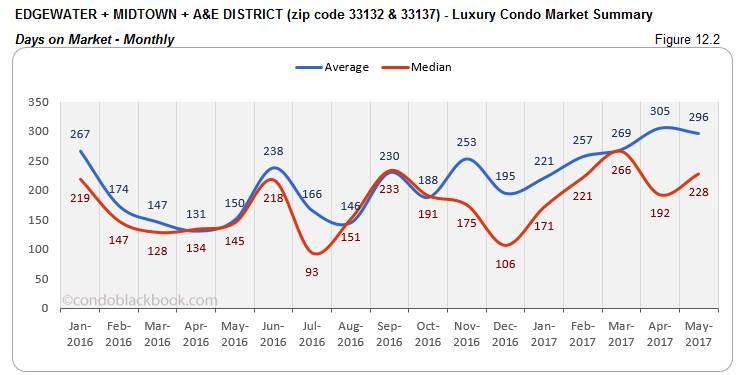
- 18% increase in days on market. Luxury condo listings are taking a median of 228 days to get off the market as of May. This is not just 18% higher than April, but also 57% higher than last year. Sellers will need to adjust prices and expectations to get in sync with the market for any real progress to be made.
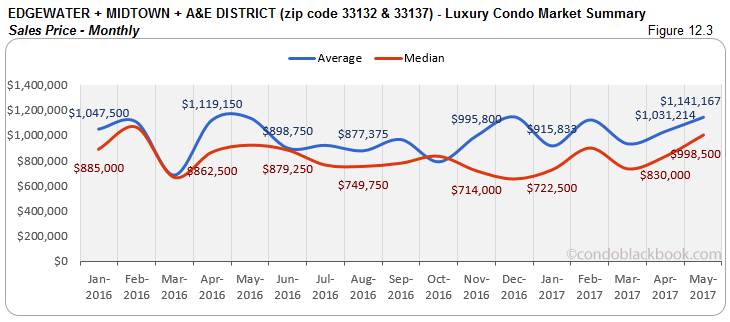
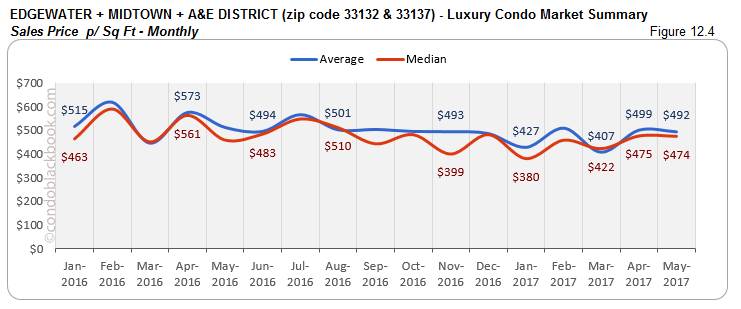
- Prices retain inflation, buyers can still gain. The month of April saw 3 above million dollar sales, which resulted in inflated prices. This inflation continues into May with a 20% increase in median sales price (fig. 12.3), but no change in price per sq. ft. (fig. 12.4). However, with so much inventory waiting to get off the market, buyers can still use this leverage to strike out a great deal. Check out the individual lifestyle and condo options in Edgewater, Midtown and Arts & Entertainment District, or search Edgewater condos for sale here.
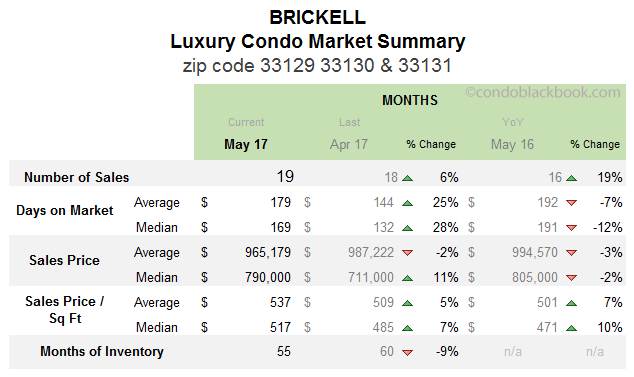
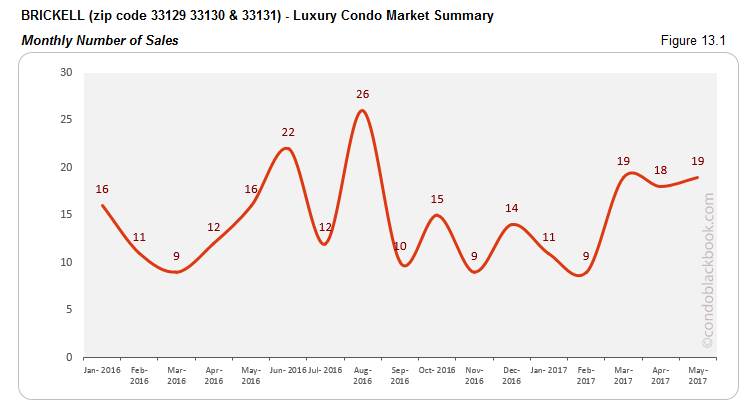
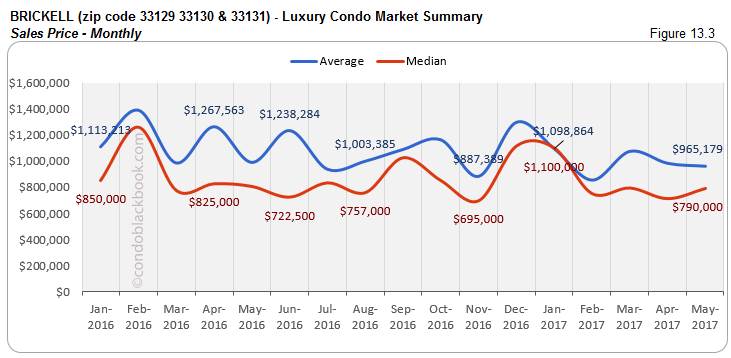
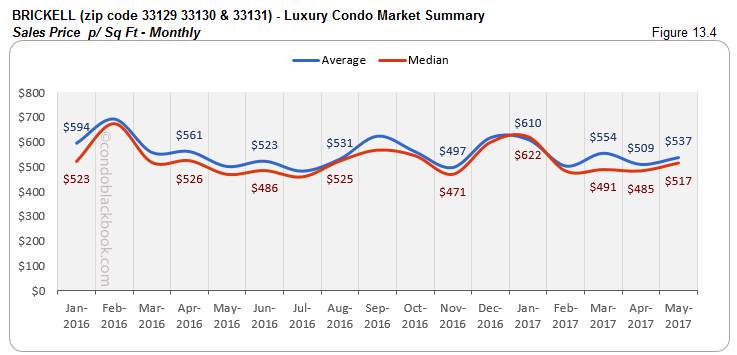
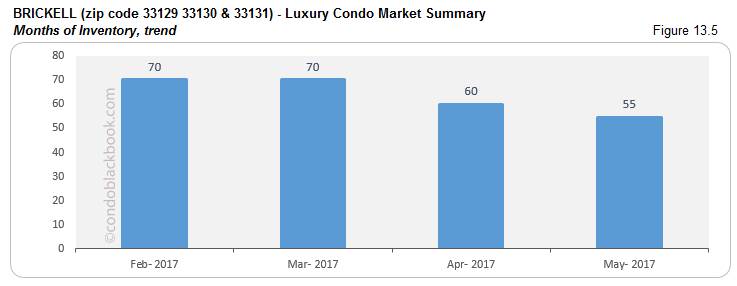
Brickell Luxury Condo Market Summary (33129, 33130, 33131 zip) back to top
- Sales keep upward trend. Since there wasn’t much of a correction last month for Brickell, the sales here show only a slight uptick of 6%. However, taking a closer look at the months preceding March (fig. 13.1) reveals the bigger picture on the progress made by the financial district.
- Good sales drive inventory down 9%. Inventory is gradually declining for Brickell (fig. 13.5) as a result of positive sale numbers. May reported 748 active luxury condo listings plus 24 pending in Brickell. Taking the average (last 6 months) of 14 deals a month, the bustling neighborhood has 55 months’ worth on the market. This is way higher than the 9-12 month normal of a balanced market.
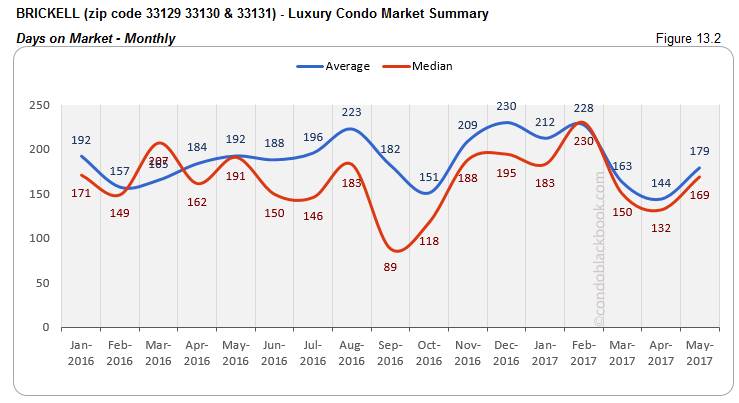
- Days on market up 28%. Just like the market overall (fig. 2.1), the median days on market here posted a month-over-month increase of 28%. However, this is still 12% lower than last year’s median.
- Sales prices creep up, but buyers can still play. Both, the median sales price (fig. 13.3) and sales price per sq. ft. (fig. 13.4) posted an increase in May. The numbers went up by 11 and 7 percent, respectively. However, considering the glut of inventory the neighborhood is sitting on, buyers can use it to their advantage when shopping for deals. Click to dabble through Brickell’s lifestyle options or search Brickell condos for sale here.
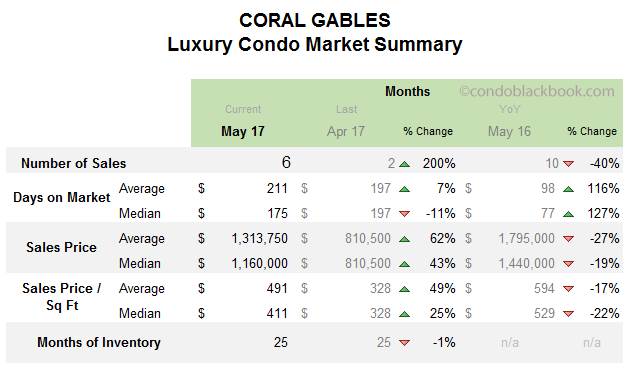
Coral Gables Luxury Condo Market Summary back to top
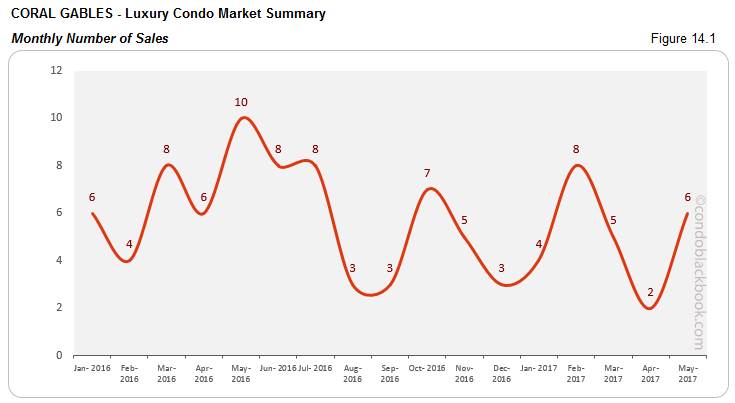
- Big spike in sales. Coral Gables posted a 200% increase in sales for the month of May. This is a big uptick (fig. 14.1) for the neighborhood which is otherwise a bit quiet when it comes to luxury condos.
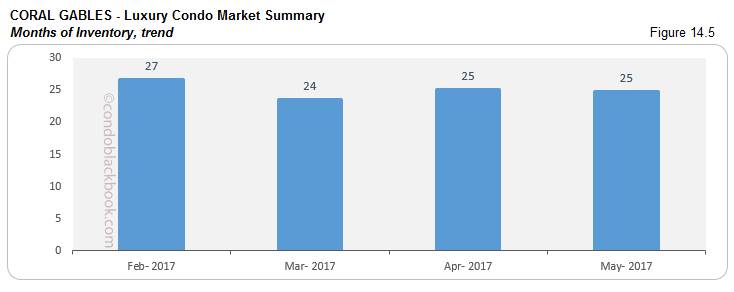
- 25 months of inventory. There were 103 active condo listings and 11 pending sale in the month of May in city beautiful. Taking the average (last 6 months) of 5 deals a month, the neighborhood still has 25 months of inventory on hand (fig. 14.5). This is still higher than the 9-12 month normal.
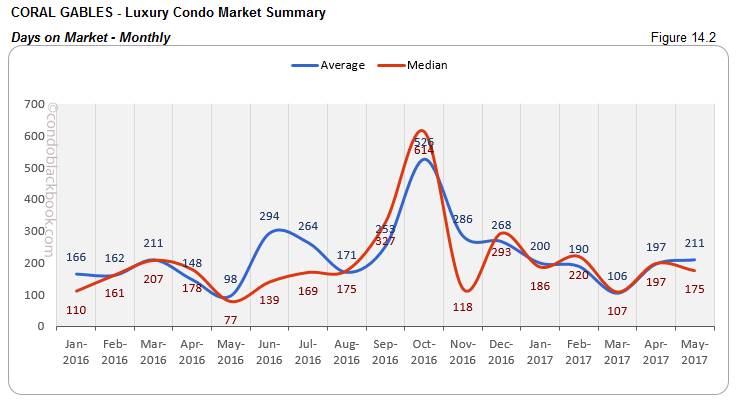
- Days on market drop 11%. The big sale spike took its affect on the median days on market by driving it down 11%. If sellers remain flexible, the neighborhood could get properties off the market faster.
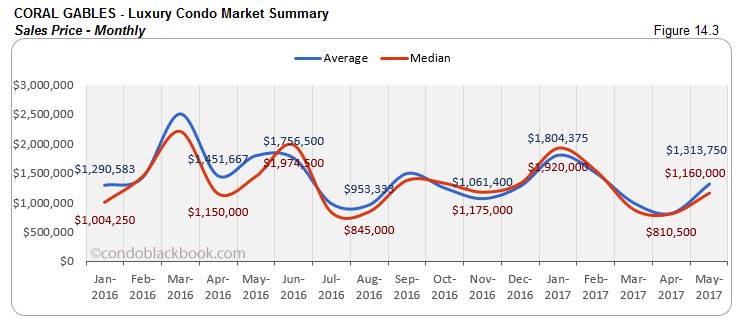
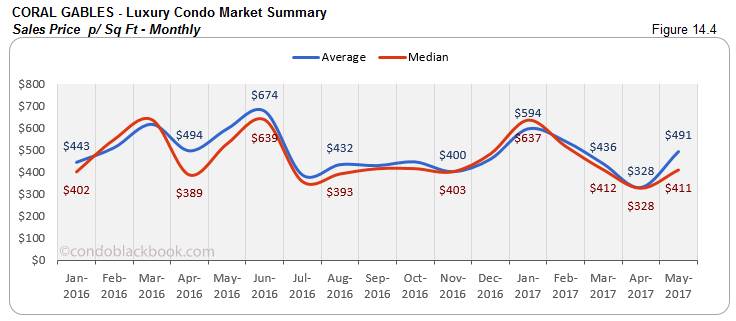
- Prices up, but buyers still in control. Though prices dropped last month, they see an uptick in May. The median sales price (14.3) is up by 43%, but down 19% from last year. The median sale price per sq. ft. (fig. 14.4) is again up 25% from April, but down 22% since last year. However, with the overall market still favoring buyers, clients can make use of the opportunity to drive down prices. Click to see what Coral Gables has to offer in lifestyle, or search Coral Gables condos for sale here.
Conclusion back to top
Buyers still enjoy the leverage. In spite of sales going up and months of inventory coming down for most sub-markets, there is still a high amount of inventory stuck on the market. Buyers can use this to their advantage and land good deals. Prices coming down in most neighborhoods is another plus. So, if you’ve been looking to buy your first condo, second home or simply invest in a luxury condo in Miami, now is the time to get your pick of the litter.
Love what you see? Don’t forget to share our blog and subscribe (see the subscribe link on the top menu) to receive the latest market news in your inbox.
Have any questions? Or see something wrong with the stats? Please contact Sep at sniakan (at) hbroswell.com or call 305-725-0566.
Share your thoughts with us

Your Miami Condo Awaits
Recent Posts


 (305) 697-7667
 (786) 321-7233
  contact@condoblackbook.com

