Miami Beach Luxury Condo Market Report Q4 2019

Feb 17, 2020 February 17, 2020
CondoBlackBook.com's year-end data review of the overall Miami luxury condo market trends revealed an increase in Sales and Sales Prices, but also increases in Days on Market and Inventory from 2018 to 2019. While higher sales and prices show that the market is headed in the right direction, especially in the Mid/North Beach condo market, increase in inventory shows that there's still a long way to go before the market can stabilize and move out of its buyer-friendly zone. This 4Q19 report details how Miami Beach and its sub-neighborhoods fared annually as well as over the last quarter of 2019, along with tracing their alignment with the overall luxury condo market trends in Miami.
For the purposes of this report, we've included the sub-neighborhoods of South Beach, Mid-Beach, North-Beach, Sunny Isles Beach, Surfside, Bal Harbour, and Fisher Island as part of our Miami Beach grouping. Also, this luxury condo market report only features properties priced at $1 million and above.
Annual Luxury Condo Market Highlights - Miami Beach and sub-neighborhoods
- Overall Sales increased
- Overall Median Sales Price increased
- Overall Median Price/sq. ft. decreased
- Overall Days on Market trended higher
4Q19 Luxury Condo Highlights - Miami Beach and sub-neighborhoods
- Miami Beach Overall Sales jump 45%, highest sales in a 4Q since 2015
- However, 12-month Sales trendline slightly negative
- Overall Median Sales Price increased 9%
- Overall Median Price/sq. ft. increased 7%
- Overall Days on Market trended higher
- Overall Months of Inventory increased
Miami Beach Sub-neighborhood Highlights
- Annual Sales in South Beach decreased almost 5%, but 4Q sales jumped 67%
- Fisher Island and Sunny Isles Annual Median Price/sq. ft. increased
- South Beach's 4Q Median Price/sq. ft. increased 41%
- Mid/North Beach posted highest 4Q19 Sales in all of Miami, up 126.7%
- 12-month trendline positive for Mid/North Beach and Fisher Island
- 4Q19 Days on Market decreased for South Beach and Mid/North Beach
- 4Q19 Inventory in Mid/North Beach declined
- Days on Market in Surfside & Bal Harbour significantly up
Miami Beach Luxury Condo Markets at a Glance - Q4 2019 YoY
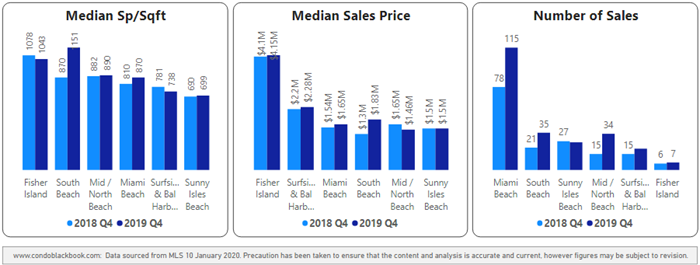
Table of Contents
- Overall Miami Beach Luxury Condo Market Trends
- South Beach Luxury Condo Market Trends
- Mid and North Beach Luxury Condo Market Trends
- Surfside & Bal Harbour Luxury Condo Market Trends
- Sunny Isles Beach Luxury Condo Market Trends
- Fisher Island Luxury Condo Market Trends
- Conclusion
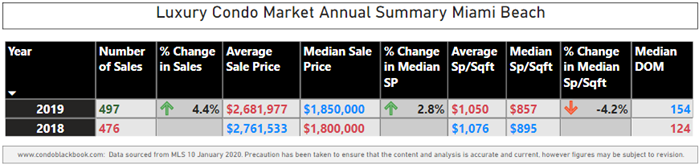
Miami Beach Luxury Condo Market Summary 2019 - Fig. 1.1
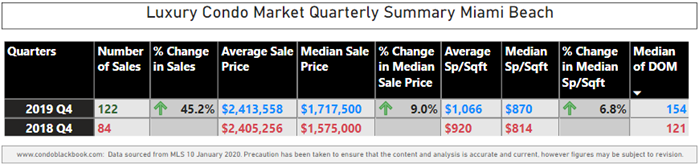
Miami Beach Luxury Condo Market Summary 4Q19 - Fig. 1.2
Annual and 4Q19 YoY Luxury Condo Sales Up in Miami Beach
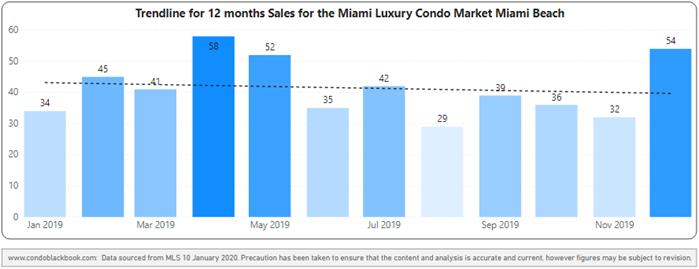
Annual sales increase 4.4%, but trendline slips to negative by year-end. Contributing to the overall market trend of higher sales in Miami, Miami Beach reports a 4.4% increase in annual numbers from 2018 to 2019 (fig. 1.1). However, this momentum was not enough to sustain the positive trendline seen in Q3, which has now slipped into a negative for Q4 (fig. 2.2). This is due to Q1 and Q2 registering lower sales compared to 2018, which could not be compensated for even by a good increase in Q3 and Q4 (fig. 2.1). However, strong fourth quarter data could indicate a market shift.
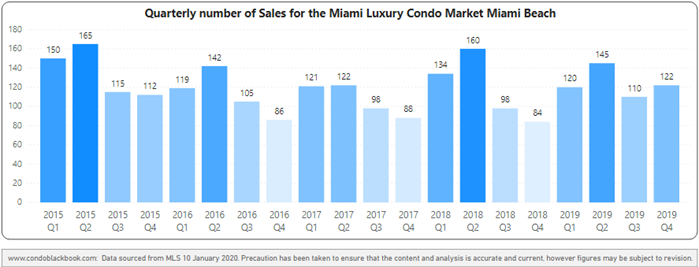
Q4 sales spike 45.2% year-over-year. Powered by an exceptional performance in November and December, sales in Q4 jumped 45.2% over the same quarter 2018 (fig. 1.2), which is unusual for a fourth quarter, which typically sees a decline in sales. This is the highest the sales have been in a fourth-quarter since 2015 (fig. 2.1), and was supported by strong sales growth in South Beach, clearly contributing to the growth in overall annual sales mentioned above.
Miami Beach Quarterly Sales Heatmap 1Q2015 - 4Q2019 - Fig. 2.1
Miami Beach 12-Month Sales with Trendline 2019 - Fig. 2.2
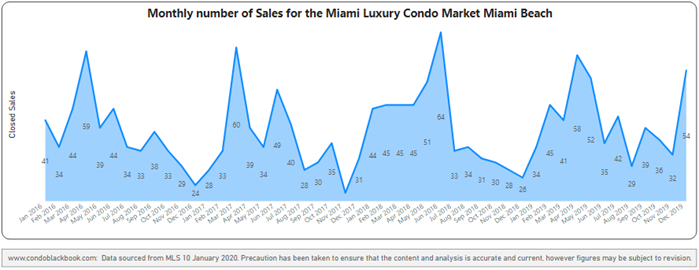
Miami Beach Monthly Sales from Jan. 2016 to Dec. 2019 - Fig. 2.3
Luxury Condo Prices Up in Miami Beach
Annual Sales Price increases, while the Price per sq. ft. drops to $857/sq. ft. Moving in line with the overall market trend in Miami, the Median Sales Price increased 2.8% against 2018, while the Price per sq. ft. decreased 4.2% (fig. 1.1). This difference in trends could be due to an increase in the sale of larger units, so even as they commanded better prices, the median price per sq. ft. was discounted for spreading over the size of the condo.
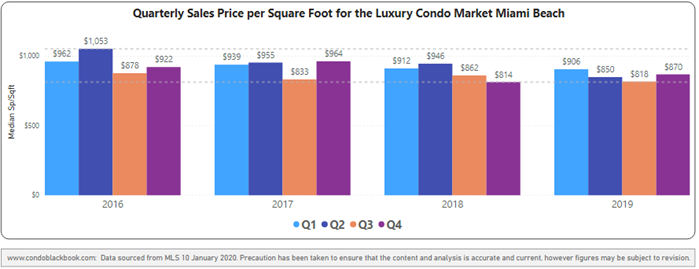
Q4 Sales Price and Price per sq. ft. increase year-over-year. Both the Median Sales Price and Price per sq. ft. showed year-over-year increases over Q4 2018. The Median Price increased by 9.0%, and the Price per sq. ft. went up 6.8% (fig. 1.2). Looking at a four-year snapshot of quarterly prices per sq. ft. (fig. 3), it's worth noting that prices still trended closer to the lower end of the range.
Miami Beach Quarterly Sales Price Per Sq. Ft. 2016-2019 - Fig. 3
Annual and 4Q19 YoY Days on Market Higher in Miami Beach
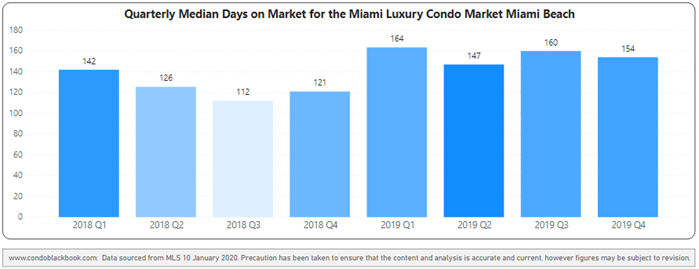
Annual Days on Market trend higher. Moving with the overall market trend in Miami, the Days on Market increased from a median of 124 days in 2018 to 154 days in 2019 (fig. 1.1). With luxury condos spending 30 more days on the market in Miami Beach, the trend indicates that buyers and sellers had a tough time reaching a consensus over the course of the year or possibly an oversupply.
Similar uptick in Q4 year-over-year Days on Market. Contributing to the annual trend, luxury condos spent 33 more days on the market in Q4 compared to the same quarter last year (fig. 1.2 and 4). Again, this shows a lengthier dialogue in buyer-seller negotiations but sales none-the-less as the year came to a close.
Miami Beach Quarterly Days on Market 2018-2019 Heatmap – Fig. 4
Higher Year-end Inventory Keeps Miami Beach Buyer-friendly
Inventory closes the year with 42 months' surplus. Trending much higher than September end's 35 months, Miami Beach closed the year with 42 months of inventory. In line with the overall market trend in Miami, this figure is way off the 9 to 12-month benchmark of a balanced market. With buyers again in an advantaged position, it is the right time to search for deals on Miami Beach condos for sale here.
Miami Beach Months of Inventory from Mar. 2017 to Dec. 2019 - Fig. 5
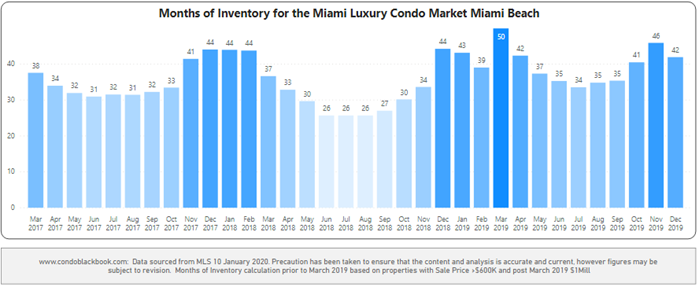
A balanced market has only 9-12 months of inventory. The months of inventory are calculated as – no. of active listings + no. of pending listings divided by the average number of deals in the last 6 months.
*As of March 2019, we have only considered properties priced $1 million and upwards for our luxury condo study, instead of the previous $600K benchmark. This means that, while our historical data compares to condos priced $600K and higher, post March 2019, the numbers represent properties priced $1 million and higher only.
Miami Beach Neighborhoods: South Beach (ZIP 33139)
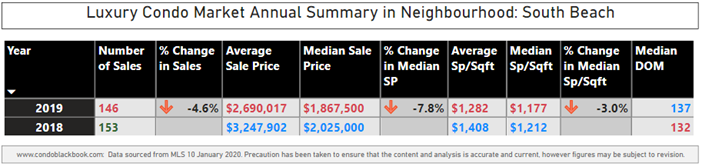
South Beach Luxury Condo Market Summary 2019 - Fig. 6.1
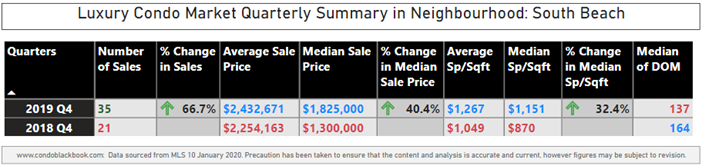
South Beach Luxury Condo Market Summary 4Q19 - Fig. 6.2
Annual Sales Dip but Strong 4Q19 Uptrend YoY in South Beach
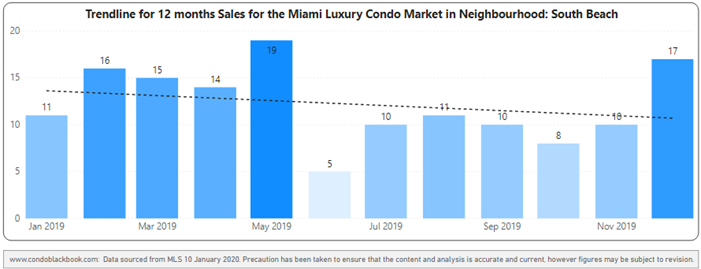
Annual Sales decline 4.6% with a negative trendline. Going against the overall market trend of higher sales in Miami, South Beach showed a decline in annual figures going down 4.6% from 2018 to 2019 (fig. 6.1). This slowdown is also captured in the negative sloping 12-month trendline of fig. 7.2, despite sales doing exceptionally well in December.
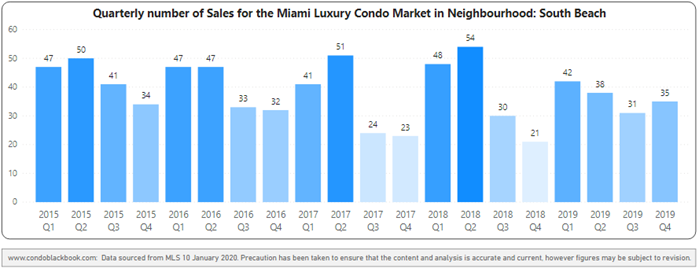
Q4 Sales grow 66.7% year-over-year. Boosted by an exceptional December, sales in Q4 posted a significant jump of 66.7% over the same quarter in 2018. It is also worth noting that this is the highest the sales have been in a fourth-quarter since 2015 for South Beach (fig. 7.1).
South Beach Quarterly Sales Heatmap 1Q2015 - 4Q2019 - Fig. 7.1
South Beach 12-Month Sales with Trendline 2019 - Fig. 7.2
Annual Prices Down in South Beach, But Higher YoY for 4Q19
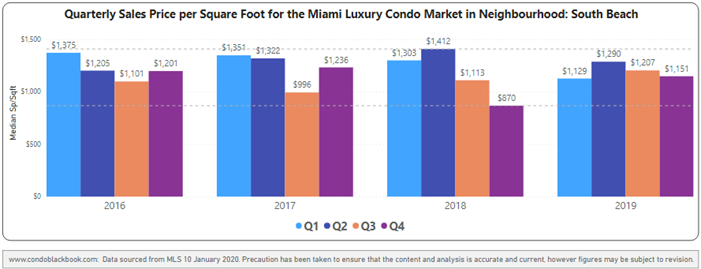
South Beach stays most expensive in Miami, despite year-end price dropping to $1,177/sq. ft. In contrast to the overall market trend in Miami, the Annual Median Sales Price fell 7.8% and Price per sq. ft. dropped 3% between 2018 and 2019 (fig. 6.1). However, ending the year with a median price of $1,177 per sq. ft., South Beach still continues to be the most expensive neighborhood to buy a luxury condo in Miami.
Q4 posts highest percentage increase in year-over-year Price per sq. ft. compared to the rest of Miami. Both the Median Sales Price and Price per sq. ft. increased year-over-year in Q4 for South Beach. While the median price went up 40.4%, the price per sq. ft. increased by 32.4% to post the highest percentage increase in all of Miami (fig. 6.2). Looking at a four-year snapshot of quarterly prices per sq. ft. (fig. 8), it is worth noting that prices stayed mid-range.
South Beach Quarterly Price Per Sq. Ft. 2016-2019 - Fig. 8
Annual Days on Market Flat in South Beach, Lower for Q4 YoY
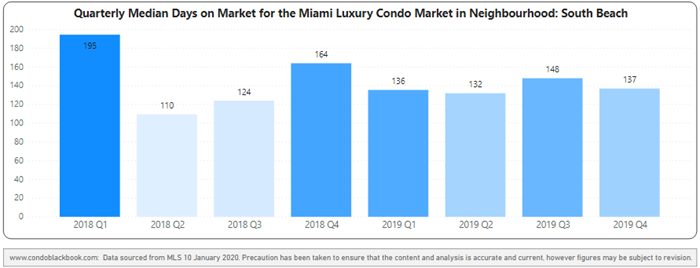
Annual Days on Market basically flat. Up only slightly from last year, luxury condos in South Beach sat five days longer on the market in 2019 compared to 2018 (fig. 6.1).
Q4 Days on Market drop year-over-year. In what is a positive indication, luxury condos in South Beach spent 27 fewer days on the market in Q4 2019 compared to the same quarter last year. This indicates an improvement in buyer-seller dialogue over the previous year (fig. 6.2 and 9).
South Beach Quarterly Days on Market 2018-2019 Heatmap - Fig. 9
Inventory Trends Higher in South Beach, Buyers Retain Edge
Inventory increased to 36 months. In line with the overall market trend in Miami, the year closed with a higher inventory than September-end's 31 months. At 36 months, luxury condo inventory in South Beach is also way off its ideal 9 to 12-month benchmark, giving buyers the upper hand in negotiations. Browse South Beach condos for sale here.
South Beach Condos Months of Inventory from Mar. 2017 to Sep. 2019 - Fig. 10
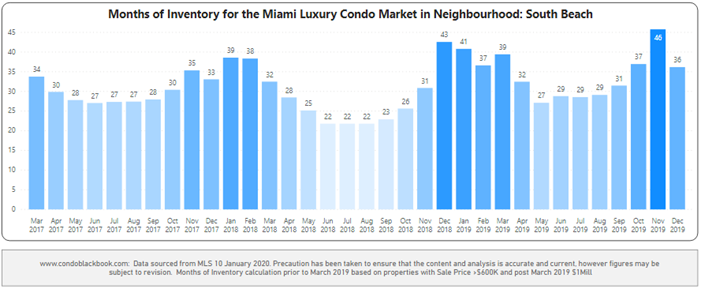
A balanced market has only 9-12 months of inventory. The months of inventory are calculated as – no. of active listings + no. of pending listings divided by the average number of deals in the last 6 months.
*As of March 2019, only properties priced $1 million and upwards are included in the CondoBlackBook.com luxury condo market reports, instead of the previous $600K benchmark. This means, that while our historical data compares to condos priced $600K and higher, starting March 2019, the numbers represent properties priced $1 million and higher only.
Miami Beach Neighborhoods: Mid and North Beach (ZIP 33140 & 33141)
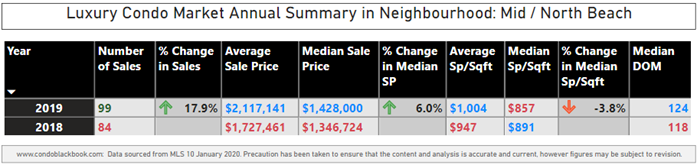
Mid-Beach and North-Beach Luxury Condo Market Summary - Fig. 11.1
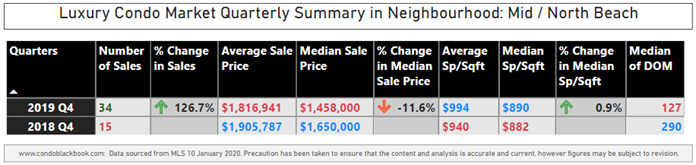
Mid-Beach and North-Beach Luxury Condo Market Summary - Fig. 11.2
Annual Sales Jump in Mid/North Beach, More than Double YoY in Q4
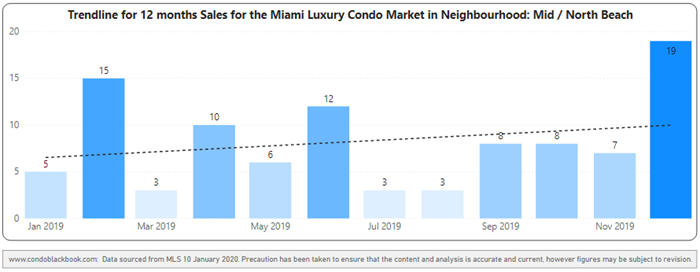
Annual sales grow 17.9% to retain a positive trendline. Boosting the overall Miami market trend of higher sales, the Mid/North Beach market reports an increase in its annual numbers compared to 2018 (fig. 11.1). This growth can also be traced in the 12-month trendline of fig. 12.2, making Mid/North Beach the only neighborhood in Miami Beach to post a positive annual trendline.
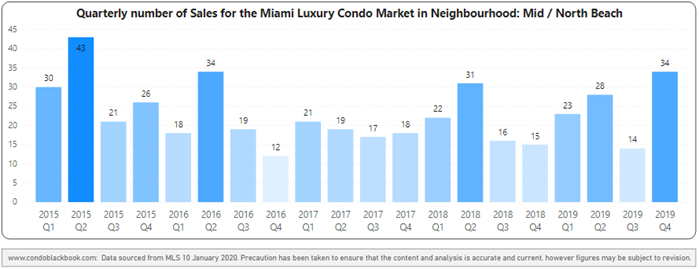
Q4 reports highest Year-over-year sales growth in all of Miami. Closing the year strongly and contributing to the annual boost mentioned above, Q4 outperformed the same quarter from last year by almost doubling year-over-year sales with an increase of 126.7% (fig. 11.2). This is also the highest the sales have been for the grouping in a fourth-quarter since 2015 (fig. 12.1).
Mid-Beach and North-Beach Quarterly Sales Heatmap - Fig. 12.1
Mid-Beach and North-Beach 12-Month Sales with Trendline - Fig. 12.2
Annual Luxury Condo Price/Sq. Ft. Down in Mid/North Beach
Annual Sales Price increases, while the Price per sq. ft. drops to $857/sq. ft. In sync with the overall market trend in Miami, the Median Sales Price increased 6.0% against 2018, while the Price per sq. ft. declined 3.8% (fig. 11.1). This difference in trends could be due to more sales of larger units, so even as they commanded higher prices, the median price per sq. ft. was discounted for spreading thinly over the size of the unit.
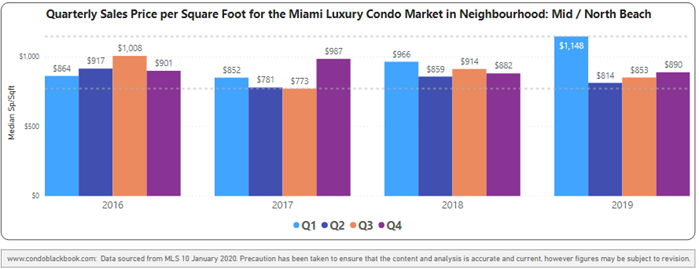
Q4 Median Sales Price decreases, while the Price per sq. ft. stays flat year-over-year. Mid/North Beach reported an 11.6% drop in year-over-year prices in Q4. However, the Price per sq. ft. remained flat, posting only a marginal year-over-year increase of 0.9%. Looking at a four-year snapshot of quarterly prices per sq. ft. (fig. 13), it's also worth noting that prices trended closer to the lower end of the range as the year came to a close.
Mid-Beach and North-Beach Quarterly Price Per Sq. Ft. 2016-2019 - Fig. 13
Annual Days on Market Flat in Mid/North Beach, Big Drop YoY in Q4
Annual days on market flat. Not budging from the previous year, condos in Mid/North Beach sat six additional days on the market in 2019, up from a median of 118 days in 2018 to 124 days in 2019 (fig. 11.1).
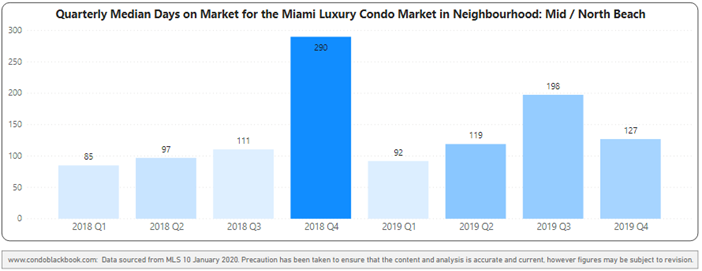
Year-over-year Days on Market down in Q4. In what is a strong positive indicator, Mid/North Beach luxury condos sat 163 fewer days on the market in Q4 2019 compared to the same quarter last year (290 days compared to 127 days). This huge improvement indicates that buyers and sellers had a much better dialogue this last quarter and an increased demand for this area may be in motion (fig. 11.2 and 14).
Mid-Beach and North-Beach Quarterly Days on Market 2018-2019 Heatmap – Fig. 14
Mid/North Beach - Only Neighborhood in Miami Beach with Decline in Inventory
Inventory down to 32 months. With a strong Q4 (sales) chipping away at inventory, Mid/North Beach is the only neighborhood in Miami Beach to report a decline in numbers. Coming down from September-end's 34 months, the year closed with 32 months of inventory. However, the metric is still far from reaching the 9 to 12-month benchmark of a balanced market, so buyers can still make the most of the opportunity at hand as they search North Beach and Mid-Beach condos for sale here.
Mid-Beach and North-Beach Months of Inventory from Mar. 2017 to Dec. 2019 - Fig. 15
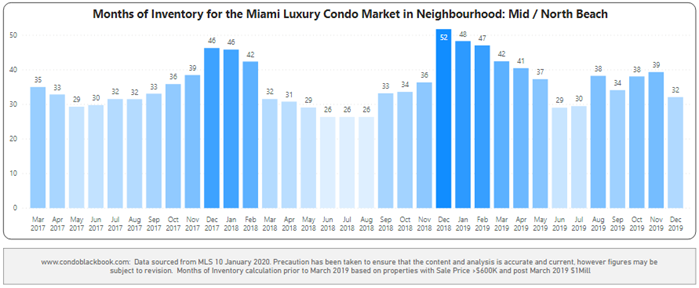
A balanced market has only 9-12 months of inventory. The months of inventory are calculated as – no. of active listings + no. of pending listings divided by the average number of deals in the last 6 months.
*As of March 2019, only properties priced $1 million and upwards are included in the CondoBlackBook.com luxury condo market reports, instead of the previous $600K benchmark. This means, that while our historical data compares to condos priced $600K and higher, starting March 2019, the numbers represent properties priced $1 million and higher only.
Miami Beach Neighborhoods: Surfside & Bal Harbour
Surfside & Bal Harbour Luxury Condo Market Summary 2019 - Fig. 16.1
Surfside & Bal Harbour Luxury Condo Market Summary 4Q19 - Fig. 16.2
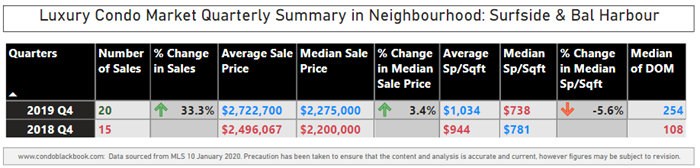
Surfside & Bal Harbour: Annual and 4Q19 YoY Luxury Condo Sales Up
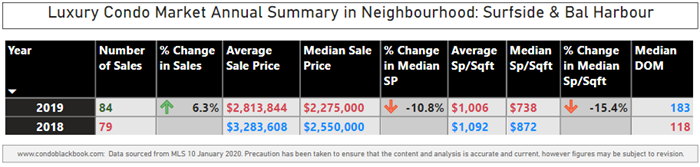
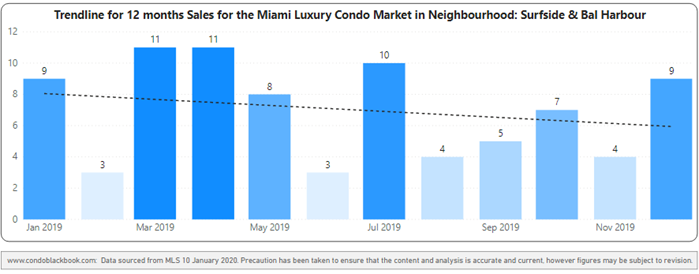
Annual sales grow 6.3%, but the 12-month trendline slips into negative. Moving in line with the overall market trend in Miami, this combined district posts an increase of 6.3% in annual sales against 2018 (fig. 16.1). However, a negative sloping trendline in fig. 17.2 shows that the combined neighborhoods are still recovering from the sluggishness seen in Q1 and Q2, where both posted lower volumes year-over-year.
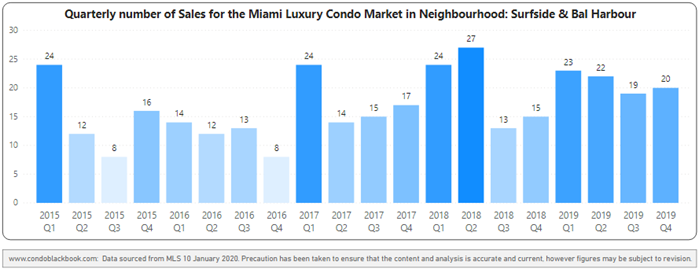
Q4 sales grow 33.3% year-over-year. Closing the year strongly, Q4 sales increased by 33.3% over the same quarter last year (fig. 16.2). This is also the highest the sales have been in a fourth-quarter since 2015 for the Miami Beach sub-market (fig. 17.1).
Surfside & Bal Harbour Quarterly Sales Heatmap - Fig. 17.1
Surfside & Bal Harbour 12-Month Sales with Trendline - Fig. 17.2
Annual and Q4 YoY Luxury Condo Prices Mixed in Surfside & Bal Harbour
Annual Sales Price drops with Price per sq. ft. falling to $738/sq. ft. Going against the overall market trend in Miami, both the Median Sales Price and Price per sq. ft. declined against 2018. While the Median Sales Price dropped 10.8%, the Price per sq. ft. fell 15.4% (fig. 16.1).
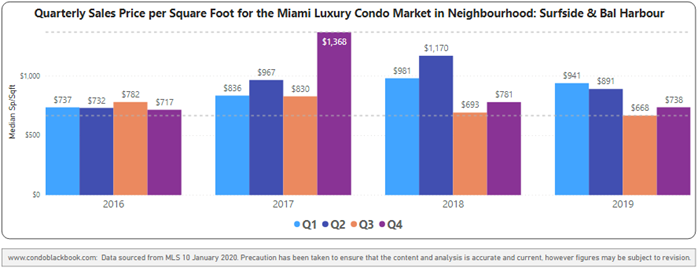
Q4 Sales Price increases, while the Price per sq. ft. declines year-over-year. Surfside & Bal Harbour reported a 3.4% increase in year-over-year prices in Q419, while the Price per sq. ft. went down 5.6% (fig. 16.2). This difference in trends could be due to increased sales of larger luxury condos, so even as they commanded better prices, the median price per sq. ft. was discounted for spreading thinly over the size of the unit. Looking at a four-year snapshot of quarterly prices per sq. ft. (fig. 18), it's worth noting that prices trended closer to the lower end of the range as the year came to a close.
Surfside & Bal Harbour Quarterly Price Per Sq. Ft. 2016-2019 - Fig. 18
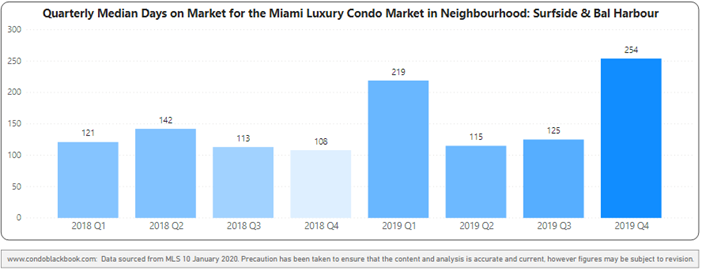
Annual and 4Q19 YoY Days on Market Trend Higher in Surfside & Bal Harbour
Annual Days on Market uptrend. Increasing from a median of 118 days in 2018 to 183 days in 2019, luxury condos spent 65 days longer on the market (fig. 16.1). This is in line with the overall market trend in Miami, and the metric shows how buyers and sellers found it difficult to reach a consensus over the course of the year.
Q4 Days on Market post sharp year-over-year uptick. Contributing to the annual trend, luxury condos in Surfside & Bal Harbour spent 146 more days on the market compared to Q4 2018, more than doubling (fig. 16.2 and 19). This shows a widening gap between buyer and seller expectations in the combined neighborhood.
Surfside & Bal Harbour Quarterly Days on Market 2018-2019 Heatmap – Fig. 19
Surfside & Bal Harbour Inventory Increases, Again Favoring Buyers
Inventory now at 33 months. Increasing from September end's 30 months to 33 by year-end, the trend is in line with the overall Miami market. Since a normal market has only 9-12 months of inventory, this gives buyers a good window of opportunity to take their time in their condo selection. To browse available condos, search for Surfside or Bal Harbour condos for sale here.
Surfside & Bal Harbour Months of Inventory from Mar. 2017 to Dec. 2019 - Fig. 20
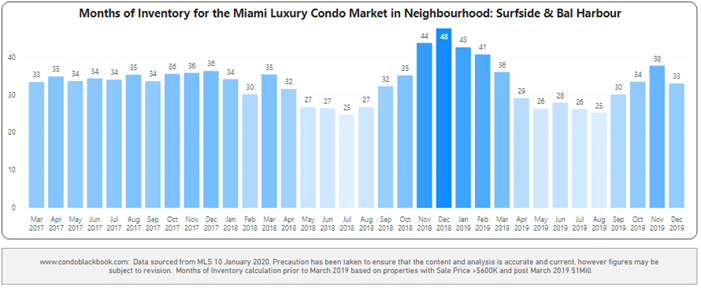
A balanced market has only 9-12 months of inventory. The months of inventory are calculated as – no. of active listings + no. of pending listings divided by the average number of deals in the last 6 months.
*Starting March 2019, we have only considered properties priced $1 million and upwards for our luxury condo study, instead of the previous $600K benchmark. This means, that while our historical data compares to condos priced $600K and higher, post March 2019, the numbers represent properties priced $1 million and higher only.
Miami Beach Neighborhoods: Sunny Isles Beach
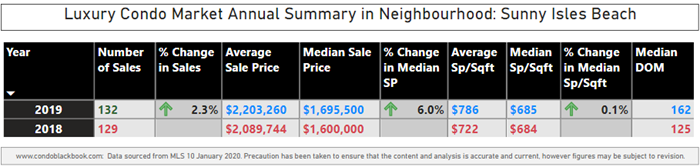
Sunny Isles Beach Luxury Condo Market Summary 2019 - Fig. 21.1
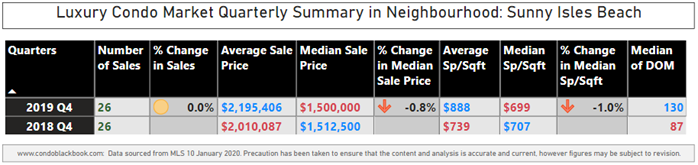
Sunny Isles Beach Luxury Condo Market Summary 4Q19 - Fig. 21.2
Sunny Isles Annual Luxury Condo Sales Slightly Up, Flat YoY in Q419
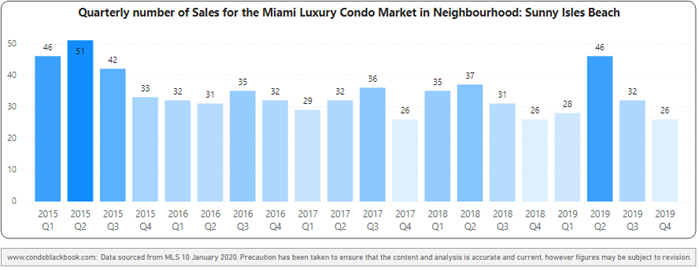
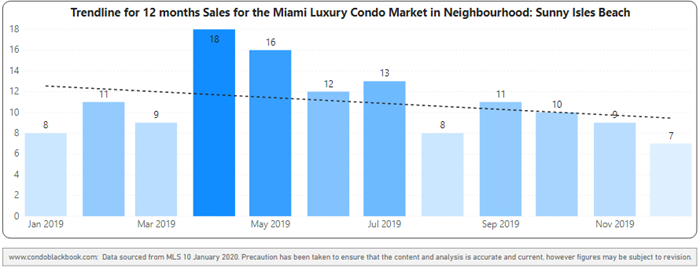
Annual sales increased by 2.3% with a negative trendline. Similar to the overall luxury condo market in Miami, Sunny Isles posted a 2.3% increase in its annual sales against 2018 (fig. 21.1). However, a slower Q1 and flat Q4 (compared to 2018) dragged the trendline to post a negative slope in Q4 from a positive stance in Q3 (fig. 22.2).
Q4 sales flat year-over-year. Sales in Q4 2019 matched numbers from the same quarter last year and 2017.
Sunny Isles Beach Quarterly Sales Heatmap - Fig. 22.1
Sunny Isles Beach 12-Month Sales with Trendline - Fig. 22.2
Annual Luxury Condo Prices Up in Sunny Isles Beach, Down YoY in Q4
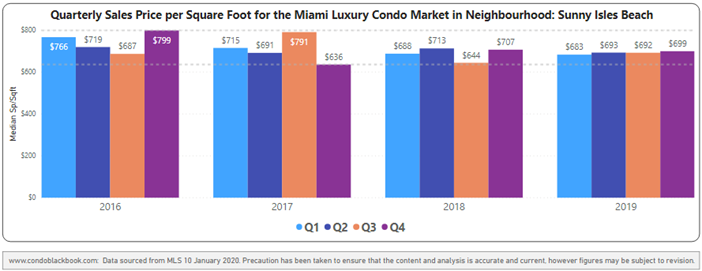
Annual Sales Price up, but a flat Price per sq. ft. at $685/sq. ft. Almost in line with the overall Miami market trend of higher prices, Sunny Isles reports a 6.0% uptick in Median Sales Price, while its Price per sq. ft. stayed put in an annual comparison to 2018 at (fig. 21.1).
Q4 Sales price flat, while Price per sq. ft. marginally down year-over-year. While the Median Sales price for Q4 remained flat with a negligible year-over-year drop of 0.8%, the price per sq. ft. declined 1.0% (fig. 21.2). Looking at a four-year snapshot of quarterly prices per sq. ft. (fig. 3.1), it's worth noting that Q4 2019 closed with a mid-range median of $699/sq. ft. (fig. 23).
Sunny Isles Beach Quarterly Price Per Sq. Ft. 2016-2019 - Fig. 23
Sunny Isles Annual and 4Q19 YoY Days on Market Increase
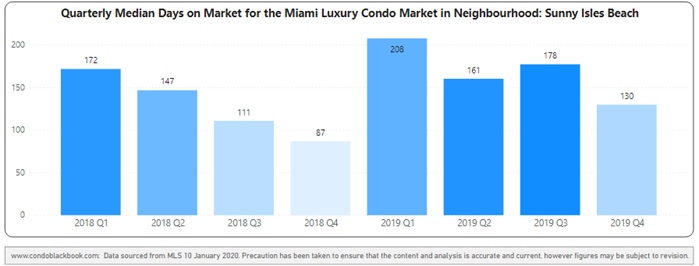
Annual Days on Market post uptick. Increasing from a median of 125 days in 2018 to 162 days in 2019, luxury condos in Sunny Isles spent 37 extra days on the market (fig. 21.1). This is in line with the overall Miami market trend and shows a slowdown in buyer-seller communication over the course of the year.
Sharp increase in year-over-year days on market for Q419. Increasing from a median of 87 days in Q4 2018 to 130 days in Q4 2019, luxury condos spent 43 more days on the market (fig. 21.2 and 24), indicating a disparity between buyer and seller expectations as the year came to a close.
Sunny Isles Beach Quarterly Days on Market 2018-2019 Heatmap – Fig. 24
Sunny Isles Beach Condo Inventory Up and Favoring Buyers
Inventory higher at 66 months. Sitting with the highest levels of inventory in Miami Beach, Sunny Isles Beach reports a significant increase from September end's 46 months. Closing the year with 66 months of inventory, the neighborhood is the furthest off from reaching the 9 to 12-month mark of a balanced market. This puts buyers at a great advantage as they can take their time in finding the best deals as they search for Sunny Isles Beach condos for sale here.
Sunny Isles Beach Months of Inventory from Mar. 2017 to Dec. 2019 - Fig. 25
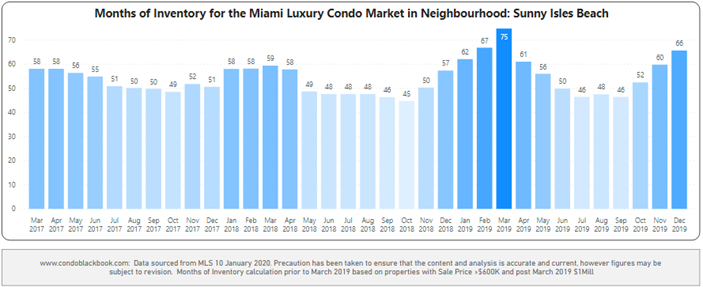
A balanced market has only 9-12 months of inventory. The months of inventory are calculated as – no. of active listings + no. of pending listings divided by the average number of deals in the last 6 months.
*Starting March 2019, we have only considered properties priced $1 million and upwards for our luxury condo study, instead of the previous $600K benchmark. This means, that while our historical data compares to condos priced $600K and higher, post March 2019, the numbers represent properties priced $1 million and higher only.
Miami Beach Neighborhoods: Fisher Island
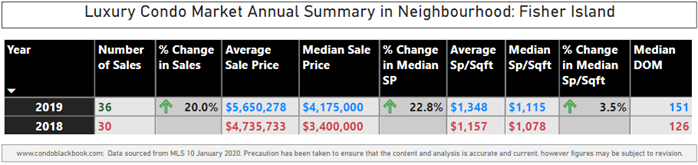
Fisher Island Luxury Condo Market Summary 2019 - Fig. 26.1
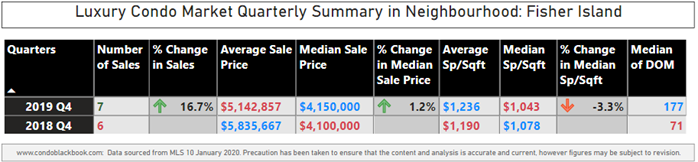
Fisher Island Beach Luxury Condo Market Summary 4Q19 - Fig. 26.2
Fisher Island Annual and 4Q19 YoY Luxury Condo Sales Up
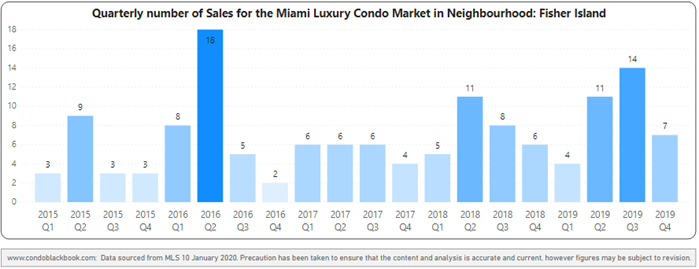
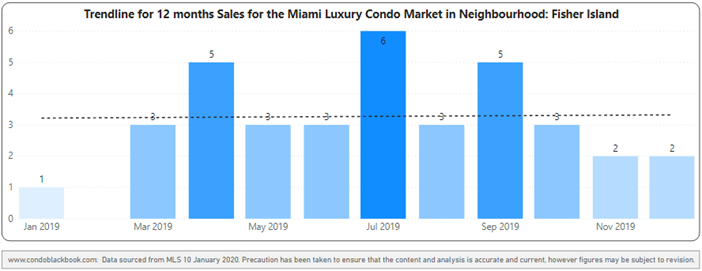
Annual sales increased by 20% with a flat trendline. With a boost in Q3 and Q4, where both registered higher sales volumes compared to 2018, Fisher Island condo sales increased 20.0% in its annual sales figures (fig. 26.1). However, this push is offset by the slowdown seen in 1Q19 and 2Q19, bringing the full year sales trendline flat in fig. 27.2.
Q4 sales grow 16.7% year-over-year. Closing the year on a good note, 2019's fourth-quarter sales outperformed 2018 by 16.7% (fig 26.1). This is also the highest the sales have been in a fourth-quarter for the island since 2015 (fig. 27.1).
Fisher Island Quarterly Sales Heatmap 1Q2015 - 4Q2019 - Fig. 27.1
Fisher Island 12-Month Sales with Trendline 2019 - Fig. 27.2
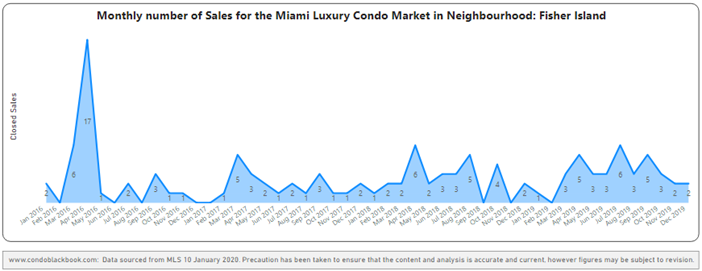
Fisher Island Monthly Sales from Jan. 2016 to Dec. 2019 - Fig. 27.3
Annual Luxury Condo Price/Sq. Ft. Up in Fisher Island, Lower YoY in Q4
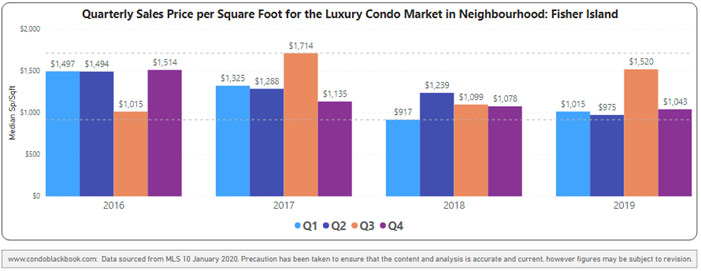
Fisher Island is second most expensive in Miami with a year-end median of $1,115/sq. ft. In sync with the overall market trend in Miami, the annual Median Sales Price increased by 22.8% and Price per sq. ft. by 3.5% between 2018 and 2019 (fig. 26.1). This made Fisher Island the only neighborhood to report the highest percentage increase in prices in all of Miami. Ending the year with a median price of $1,115 per sq. ft., Fisher Island was also the second most expensive neighborhood to buy a luxury condo in Miami, after South Beach's $1,177 per sq. ft.
Q4 Sales price increases, while Price per sq. ft. declines year-over-year. Going in opposite directions, the Median Sale Price for Q419 increased by 1.2% compared to the same quarter 2018, while the price per sq. ft. fell 3.3% year-over-year (fig. 26.1). This difference in trends could be due to increased sales of larger luxury condos, so even as they commanded higher prices, the median price per sq. ft. was discounted for spreading thinly over the sheer size of the unit. Looking at a four-year snapshot of quarterly prices per sq. ft. (fig. 28), it's further worth noting that prices trended closer to the lower end of the range.
Fisher Island Quarterly Price per Sq. Ft. 2016-2019 - Fig. 28
Annual and Q4 YoY Days on Market Uptrend in Fisher Island
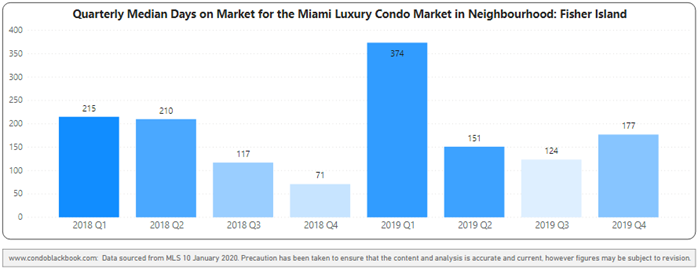
Annual Days on Market post uptick. In line with the overall market trend in Miami, luxury condos spent 25 days longer on the market in 2019 compared to 2018 (fig. 26.1). This increase in annual trends indicates a slowdown in buyer-seller communication over the course of the year.
Q4 Days on Market increase year-over-year. More than doubling from a median of 71 days in Q4 2018 to 177 in Q4 2019, luxury condos in Fisher Island spent 106 more days on the market (fig. 26.2). This increase in days again point to a mismatch in buyer-seller expectations as the year came to a close (fig. 26.2 and 29) and perhaps a stronger buyer interest in the nearby area of South Beach.
Fisher Island Quarterly Days on Market 2018-2019 Heatmap – Fig. 29
Year-end Inventory Increases, Buyers Gain Advantage in Fisher Island
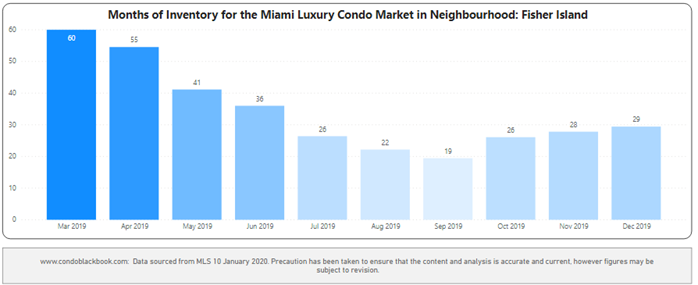
Inventory increased to 29 months. In line with the overall market trend in Miami, the year closed with a higher inventory of 29 months compared to September-end's 19 months, the lowest inventory point of the year. Still, this submarket is the closest to reaching the ideal 9 to 12-month benchmark of a balanced market, buyers interested in Fisher Island's exclusivity and supreme luxury should make the most of this window of opportunity to fetch the best deals possible. Browse available Fisher Island condos for sale here.
Fisher Island Months of Inventory from Mar. 2019 to Dec. 2019 - Fig. 30
A balanced market has only 9-12 months of inventory. The months of inventory are calculated as – no. of active listings + no. of pending listings divided by the average number of deals in the last 6 months.
*As of March 2019, only properties priced $1 million and upwards are included in the CondoBlackBook.com luxury condo market reports, instead of the previous $600K benchmark. This means that, while our historical data compares to condos priced $600K and higher, starting March 2019, the numbers represent properties priced $1 million and higher only.
Conclusion
Trends in this Miami Beach grouping were mostly in step with the overall Miami market. On an annual basis, sales for all the neighborhoods except South Beach increased, which was compensated by very strong 4Q19 sales. However, all the neighborhoods reported an increase in Days on Market. All Miami Beach neighborhoods also reported an increase in months of inventory (except Mid/North Beach), keeping buyers in control of the market. And, most neighborhoods reported higher prices, with South Beach and Fisher Island turning out to be the most expensive per sq. ft. However, the winner in this Miami Beach market is Mid/North Beach, which definitely is showing a strong trend toward a market correction.
Still, moving into 2020, if buyers keep flowing in at a good pace from high-tax states, prices are kept reasonable, inventory keeps getting chipped at without any new construction additions scheduled, and buyers take the advantage of historically low mortgage rates as well as buying options, we are looking forward to seeing signs of a corrective shift this year. Until then, buyers can continue enjoying the leverage this inventory-heavy market brings along.
Love what you see? Don't forget to share our blog and subscribe (see the subscribe link on the top menu) to receive the latest market news in your inbox.
Questions or comments with the stats? Please contact Sep at sniakan (at) hbroswell.com or call 305-725-0566.
Share your thoughts with us

Your Miami Condo Awaits
Recent Posts


 (305) 697-7667
 (786) 321-7233
  contact@condoblackbook.com

