Miami Luxury Condo Market Report - Q4 2018 and 2018 Year-in-Review
Jan 23, 2019 January 23, 2019
Miami luxury condo market numbers are in for Q4 2018, which gives us a chance to see how we fared for the quarter and also take a look back at 2018 as a whole.
- Miami Luxury Condo Report Overall Market: Summary
- City and Neighborhood Luxury Condo Reports
Miami Luxury Condo Market Report: Summary
Numbers are in for the last quarter and we see sales taking a seasonal break. However, looking into the annual numbers revealed that 2018 was a much better year for sales compared to 2017. Read on to find out which neighborhoods went against the slowing trend of Q4 and how inventory could impact the luxury condo market in 2019.
For the purpose of this luxury condo report, we have only considered properties priced $600,000 and above. Also, properties priced $5 million and higher have been referred to as ultra-luxury.
Overall Market Highlights:
- Q4 sales take seasonal plunge, but annual numbers show growth
- Greater Downtown Miami, the Edgewater grouping and Brickell defy seasonal slowdown to enjoy sales growth
- Overall luxury condos spent less time on market throughout 2018
- Overall, prices for properties built 2000 and after post decline
- All neighborhoods report spike in year-end inventory except Brickell and Coral Gables
- Buyers regain control of market with higher inventory and lower prices
Sales take seasonal breather, but annual numbers suggest growth. Most neighborhoods in our study report a seasonal decline in sales this last quarter, with beachside districts suffering the most. Perhaps the stock market volatility and a general sense of uncertainty in the U.S. political and world economic climate might have caused some buyers to pause. Also, news that the condo market was soft may have had some would-be buyers on the fence in a wait-and-see. Having said that, a closer look at the overall numbers for 2018, we can actually see that the luxury condo market in Miami received more buyer interest in 2018 compared to 2017 with a growth in numbers. We expect continued sales growth in 2019.
Annual and year-over-year days on market decline. This is a definite positive for the luxury condo market in Miami, as a declining days on market indicates that buyers and sellers have been seeing eye to eye faster. It also shows that sellers have been reasonable with asking prices.
Annual prices post increase, but overall prices show downward trend. Even as the newer, more expensive luxury product kept overall prices up compared to 2017, existing condo product built between 2000 and 2015 saw a drop in prices, exposing the realities of this buyer's market. In another analysis of new construction resales we did, it became clearer that new construction resales were soft as well.
Inventory treks further up. After months of hitting new lows, we see the months of inventory move upwards this last quarter. We were actually hoping that the typical seasonal uptick in inventory would be a little less pronounced this time, but it may be so due to many new construction owners (who were speculating) decided to finally place their properties on the market to see if they could unload during the high season. Now that a majority of the under-construction properties have delivered (2018 was a big year for delivery of new construction units), we expect inventory levels to fall again as we get through 2019.
Overall, 2019 again opens majorly in favor of the buyer. But, we’re hoping that sales get a bigger boost in this new year to bring the market back into balance. Until then, buyers can enjoy the luxuries a favorable market brings with it.
Where Does the Market Go From Here?
With 2019 again opening in favor of buyers, here are a few factors that could (and some have even started to) take effect to help push the market back into balance:
- Inventory could see improved momentum. As less new product gets delivered in 2019 (there aren’t many condos under construction. Most of the cranes you see out there are rental buildings), it should get easier to chip away at the current inventory levels. Also, since the overall prices do show a downward trend, more owners may opt to wait out this down cycle by taking their units off the market for a while, which will help take down inventory even further.
- Better priced condos built post 2014 to pique buyer interest. We expect to see great deals in the new construction inventory built post 2014, as a lot of competition may create some really interesting buying opportunities at great prices. In general, news of great deals in the luxury condo market will continue to bring more buyers off the fence and into the condo buying mood this year.
- High tax states keep pushing through new buyers. By now it’s pretty obvious that the implementation of the SALT tax laws has pushed a huge wave of domestic buyers towards tax-saving cities like ours. With all these taxes to save as a resident of Miami, we expect more out-of-towners to come with inquiries.
- Stock market volatility makes real estate fertile ground. With the stock market moving sideways and volatile through 2018, 2019 could continue seeing investors park their funds in a safer place such as real estate that has much less drama.
- Higher interest rates could be the perfect nudge for some. As more and more people get wind of an imminent increase in interest rates, there could be a sense of urgency that takes over first-time buyers, pushing them to make a purchase sooner.
Below is an insight into Miami’s overall and neighborhood-level luxury condo trends for Q4 and year-end 2018:

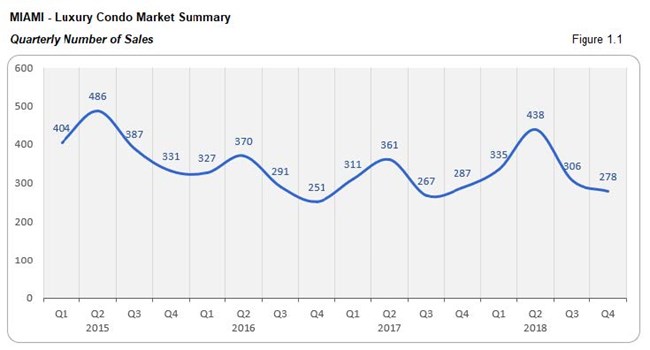
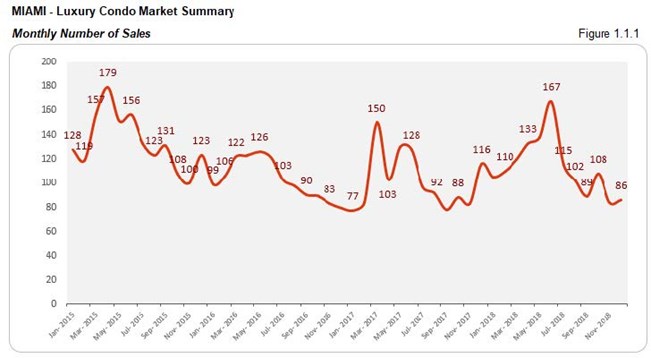
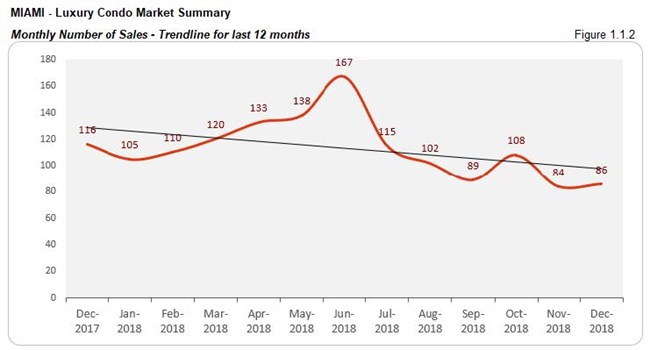
Monthly Number of Sales - Miami Luxury Condo Market Overall
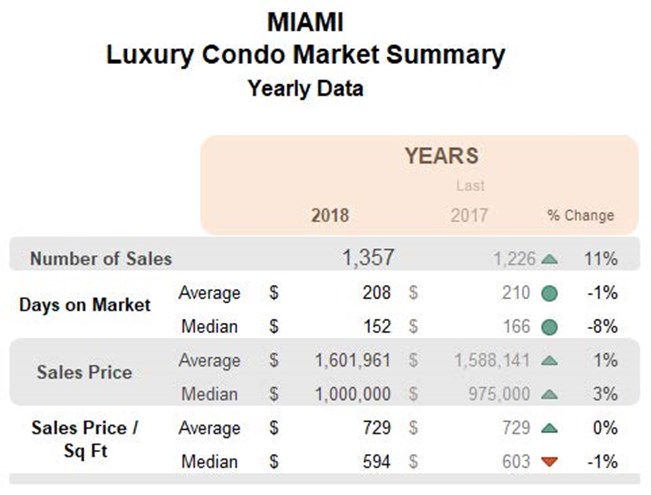
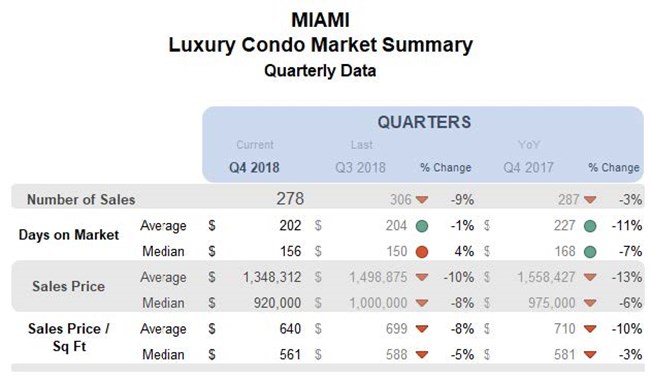
Boost in annual sales, but Q4 reports slowdown with negative trend line. Overall, sales in the luxury condo market closed on a very positive note last year, posting an increase of 11% over 2017. Now, considering that the last quarter is generally a low time for sales with the holiday season in full swing, it was not surprising to see Q4 sales fall 9% short of Q3. However, the year-end quarter also fell 3% short of the same quarter last year (fig. 1.1). This is clearly reflected in the negative trend line of fig. 1.1.2.
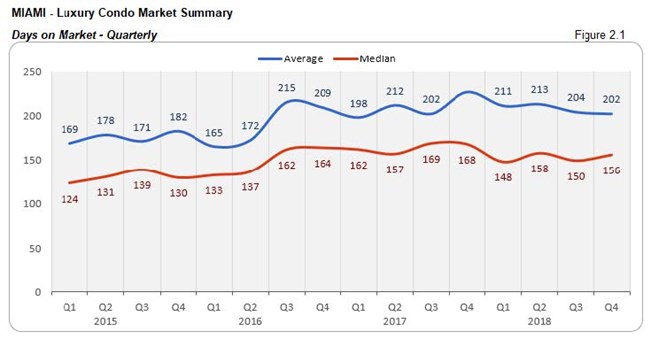
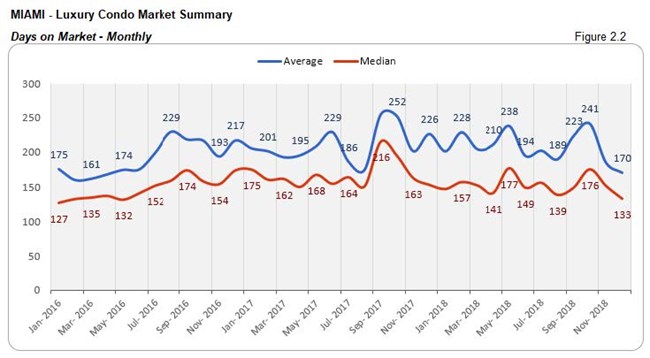
Days on Market - Miami Luxury Condo Market Overall
"Days on market" are the total number of days from when a property is active to the day it goes under contract.
Annual numbers report progress, with Q4 improving YoY too. Overall, luxury condos spent 14 less days on market (median) in 2018 compared to 2017. Even the last quarter posted a 7% decline year-over-year (fig. 2.1). This is a definite positive for the market, showing that buyers and sellers came to a consensus sooner this past year.
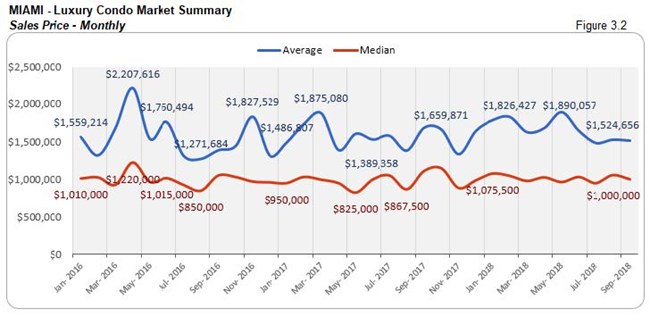
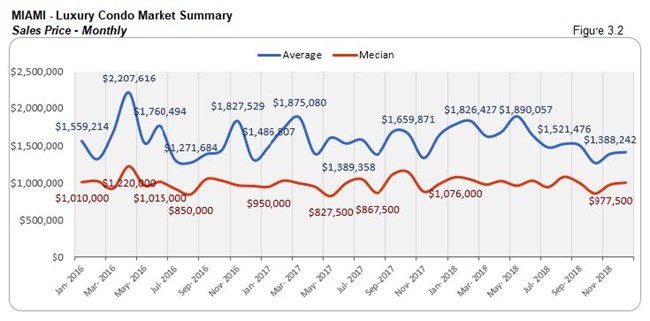
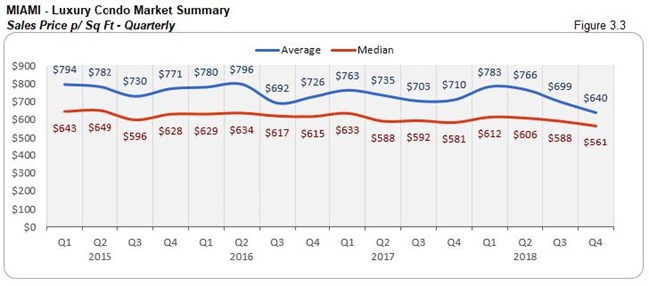
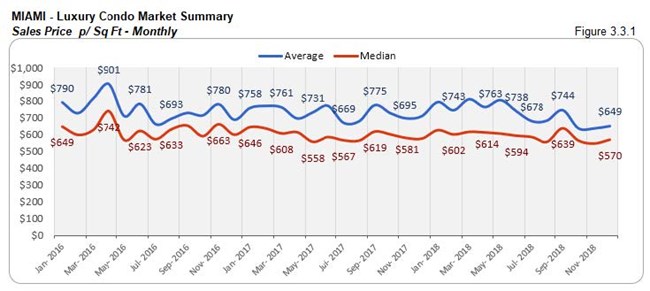
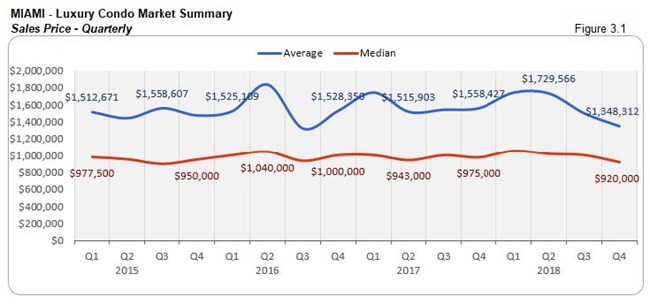
Sales Price Trends - Miami Luxury Condo Market Overall
Overall, annual prices post small increase, but Q4 deflates YoY and QoQ. In our annual analysis above, Miami sees a 3% boost in median prices compared to 2017. However, the last quarter posts a decline of 6% in the median price and 3% decline in the median per sq. ft. (fig. 3.1 and 3.3) compared to Q4 2017. Below is a detailed analysis on how the prices add up on basis of age of construction for luxury condos.
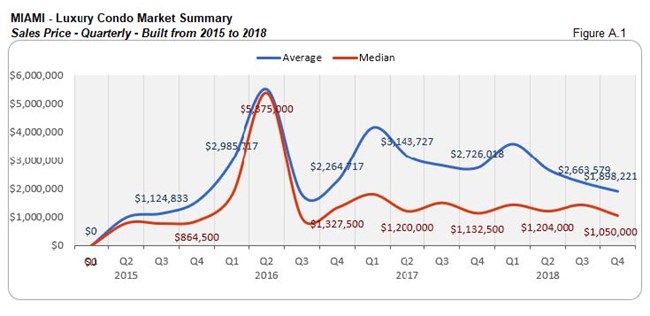
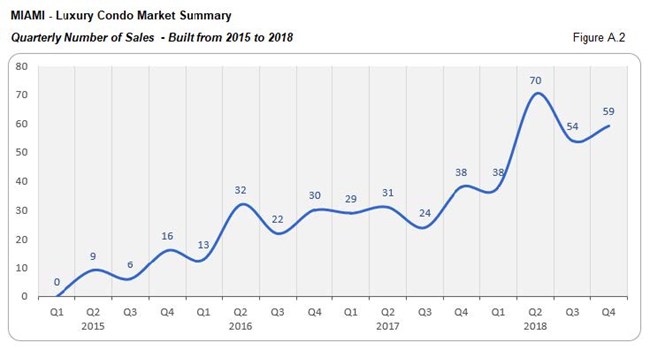
Prices decline YoY and QoQ for luxury condos built 2015 to 2018. This last quarter, even as the sales numbers went up quarter-over-quarter (fig. A.2) for newer condos, the median price posted a dip QoQ and YoY (fig. A.1). This steers in the opposite direction to what we had observed throughout the previous year. Perhaps it is this very dip in prices that has powered the boost we see in sales.
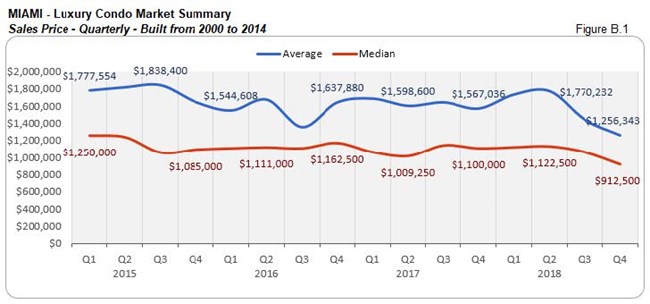
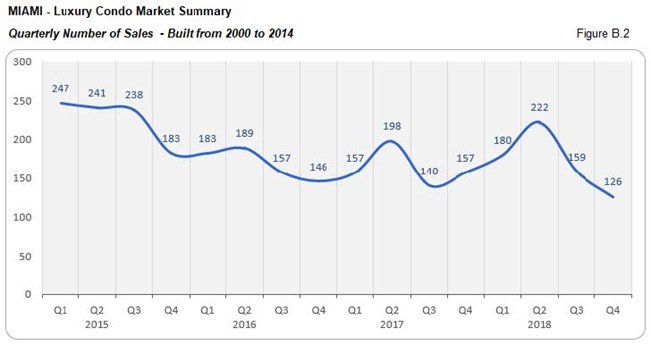
Prices dip YoY and QoQ for luxury condos built 2000 to 2014. In fig. B.1, we can see a dip in the quarter-over-quarter and year-over-year median sale prices along with the sales numbers (fig. B.2) for condos built 2000 to 2014. This shows that sellers in this category continue being flexible with their prices.
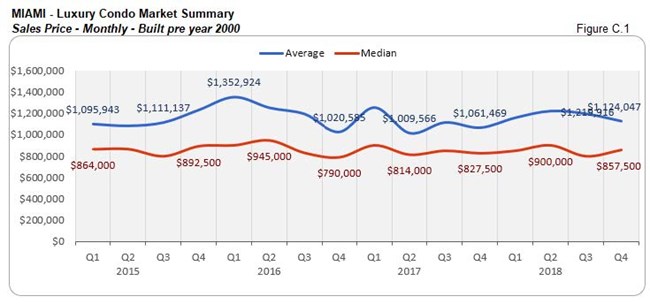
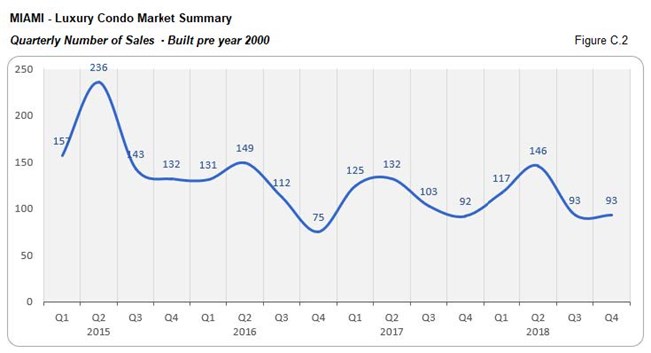
Prices show slight uptick for luxury condos built 1999 and earlier. Surprisingly, in fig. C.1, we see a slight increase in the median sale prices compared to Q3. They were also higher compared to Q4 2017. This, even as the quarterly sales remained flat.

Sales Price Trends considering Building year - Miami Luxury Condo Market Overall
ALL BUILDINGS

BUILDINGS (2015 to 2018)
BUILDINGS from 2000 to 2014
BUILDINGS from 1999 and older
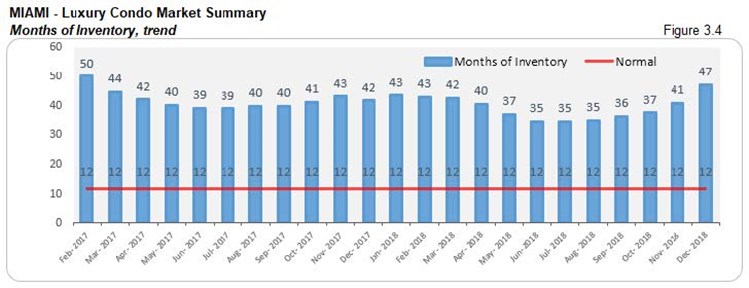
Inventory Trends - Miami Luxury Condo Market Overall
A balanced market will only have 9-12 months of inventory. The months of inventory are calculated as – no. of active listings + no. of pending listings divided by the average number of deals in the last 6 months.
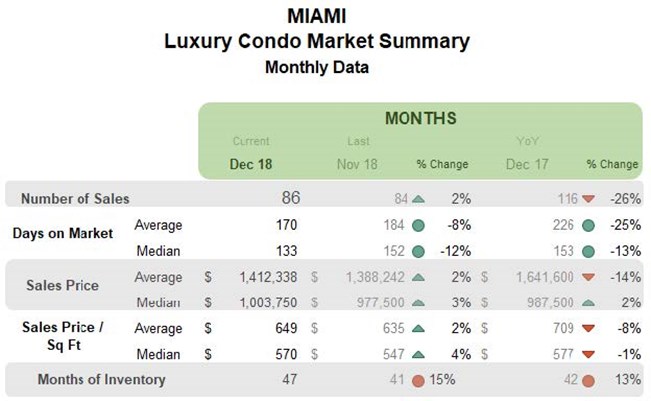
Inventory jumps year-over-year. A seasonal slowdown and increase in the active properties on market bring the year-end months of inventory to 47 compared to Q3’s closing of 36. Fig. 3.4 also reveals a 13% increase in the year-over-year inventory, pushing it further from the 9-12 month ideal mark. This metric clearly indicates that buyers still rule the roost going into 2019, with choices aplenty.
City and Neighborhood Market Reports
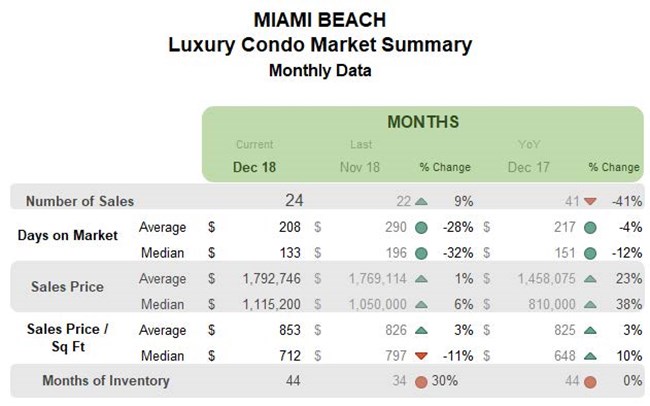
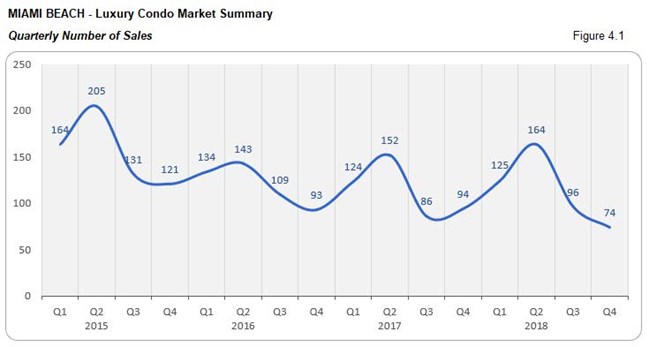
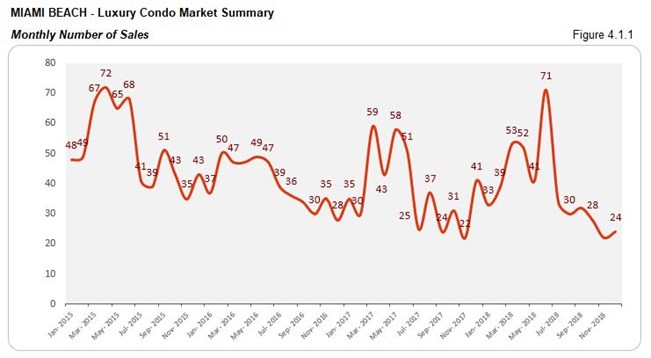
Miami Beach Luxury Condo Market Summary
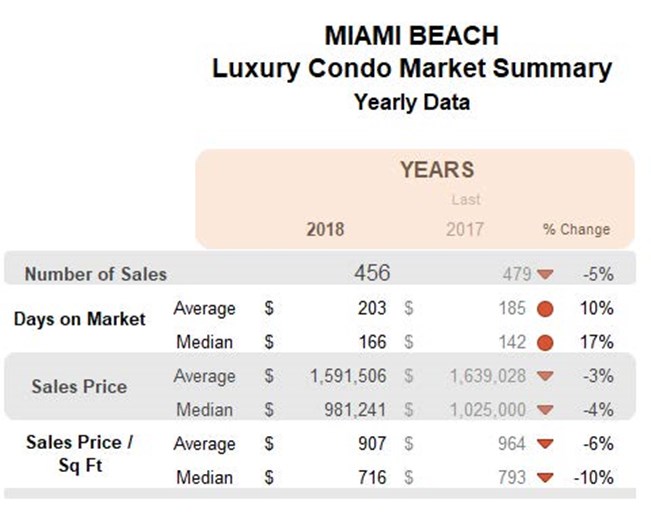
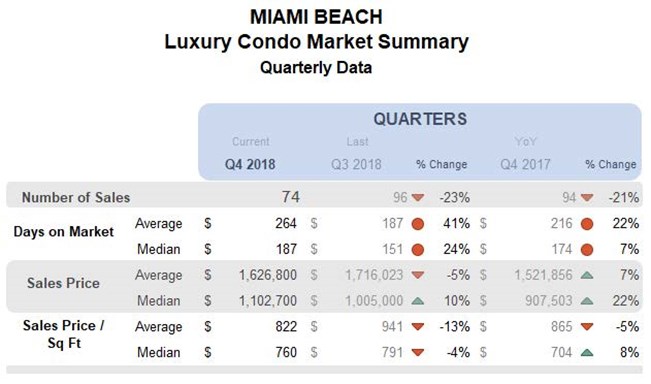
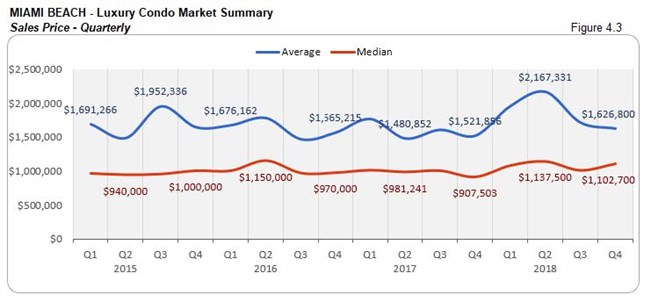
Annual sales and Q4 numbers take a hit with negative trend line. Looking back at 2018, we see that Miami Beach reported 5% lower sales annually. Also, since the last quarter is generally slower, the coastal district reports a 21% year-over-year decline (fig. 4.1). This slowdown is clearly reflected in the negatively sloping trend line of fig. 4.1.2. Hopefully, Q1 2019 can deliver a boost for this challenged market.

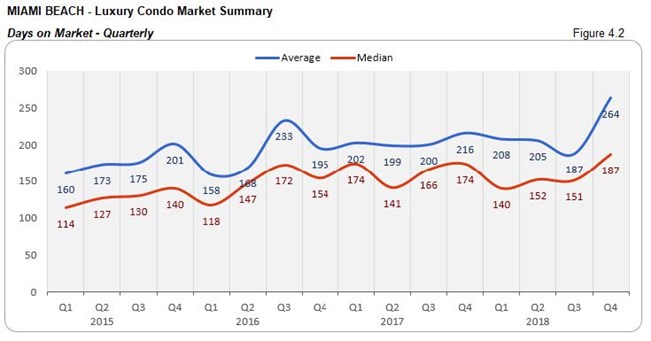
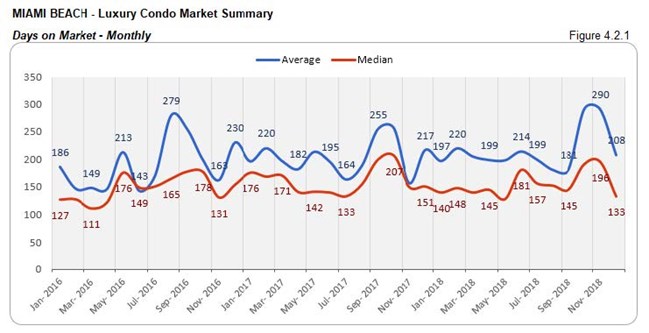
Days on market climb higher annually, and year-over-year in Q4. The median days on market for luxury condos in Miami Beach increased by 17% compared to 2017. Looking into the last quarter, there was a 7% increase year-over-year and 24% increase quarter-over-quarter. These metrics indicate that buyers and sellers took longer to come to a consensus in this coastal district. (see fig. 4.2 and 4.2.1 below)
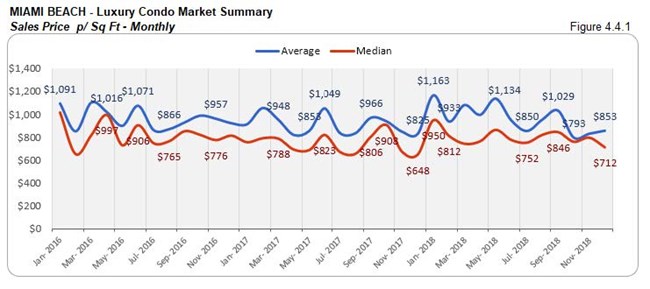
Annual prices post slight dip, but increase year-over-year for Q4. We see the overall median price in Miami Beach dip 4% against 2017, along with a 10% decline in its price per sq. ft. However, the last quarter reports an year-over-year uptick in the price (22%) and price per sq. ft. (8%). (see fig. 4.3, 4.3.1, 4.4 and 4.4.1 below) It would be interesting to note how prices shift in the opening quarter of 2019.


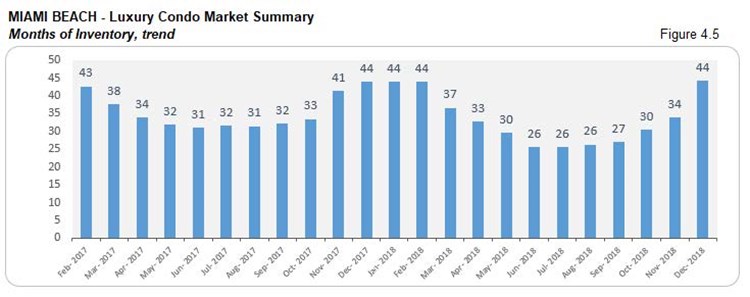
Sharp increase in inventory, rising to same levels as previous year. After dipping to its lowest mid-year, we see a sharp uptick in the months of inventory by year-end 2018. Increasing to 44 from September’s closing of 27, the months of inventory close at the same levels as December 2017. With the metric moving further away from its ideal of 9-12 months, buyers have a huge window of opportunity to hunt for deals as they search Miami Beach condos for sale here.
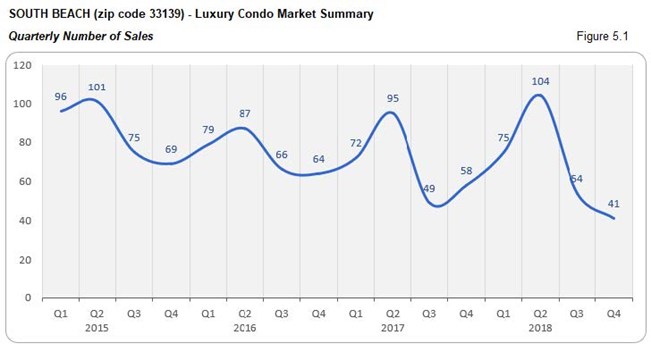
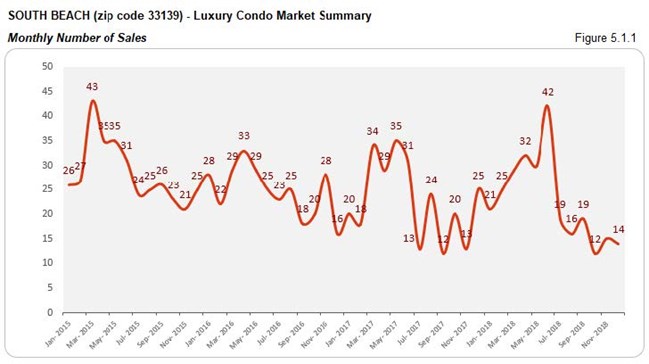
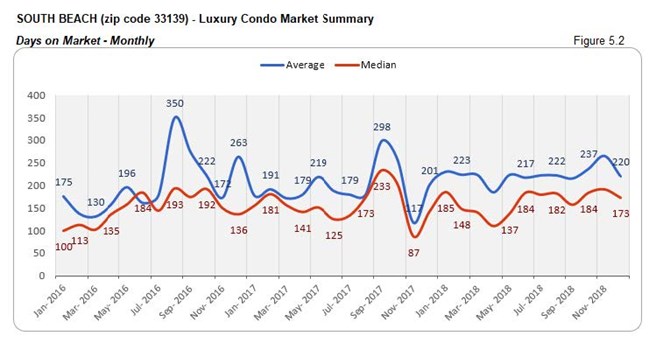
South Beach Luxury Condo Market Summary (33139 zip)
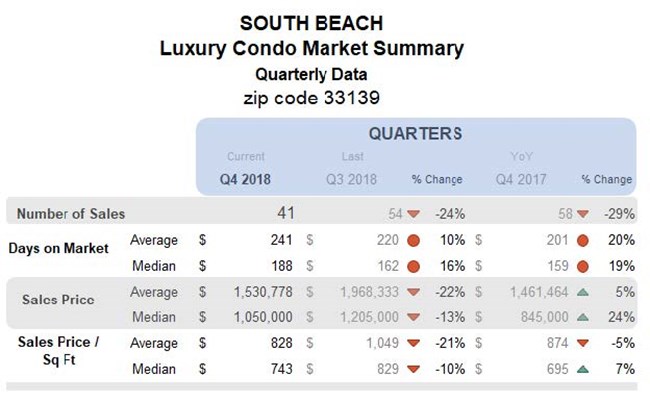
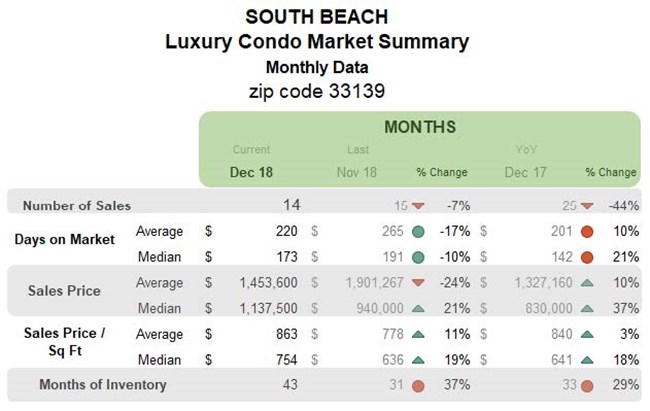
Sales figures and trend line bow to seasonal lull. South Beach reports a 24% decline in its quarter-over-quarter sales and 29% decrease in year-over-year numbers. This, along with a negative trend line in fig. 5.1.2 shows the impact of the seasonal slowdown for this vacation destination.

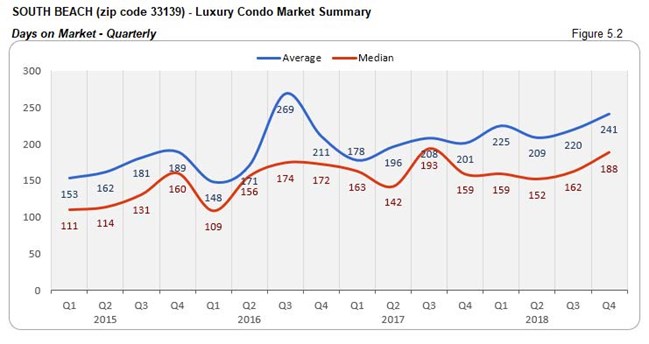
Q4 days on market inch up QoQ and YoY. Luxury condos took 26 days longer to get off the market compared to Q3, and 29 days longer compared to Q4 2017. The metric captures a slower dialogue taking place between buyers and sellers in the neighborhood.
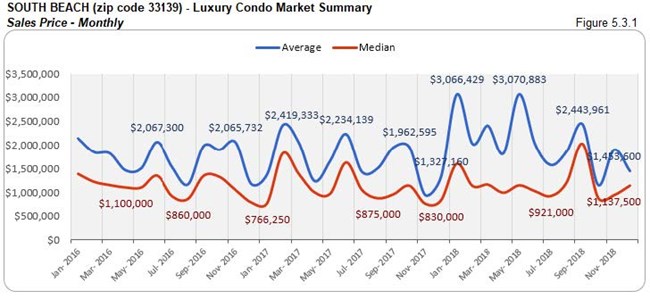
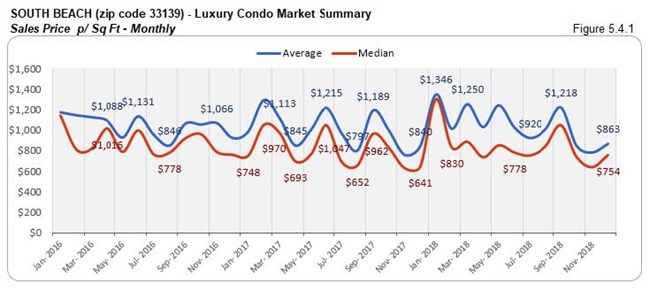
YoY prices post uptick in South Beach. South Beach reports a 24% spike in its year-over-year median price and 7% increase in the price per sq. ft. Ultra-luxury deals perhaps contributed to this uptick, since the newer construction (according to fig. A.1 above) reported a decline in prices. The quarter closed with a median price of $743 per sq. ft. (see fig. 5.3, 5.3.1, 5.4 and 5.4.1 below)


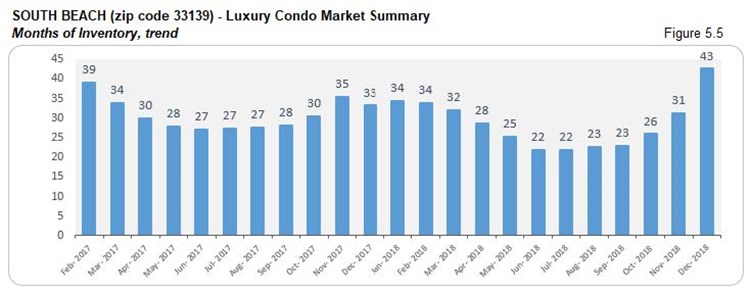
Year-end inventory escalates, moving to its highest in two years. At 43 months, the year-end inventory posts a significant jump from its previous quarter closing of 23. The seasonal slowdown also makes the metric jump 29% year-over-year. Moving further away from its ideal of 9-12 months, buyers should make the most of the opportunity by searching South Beach condos for sale here, or taking a tour of the neighborhood here.
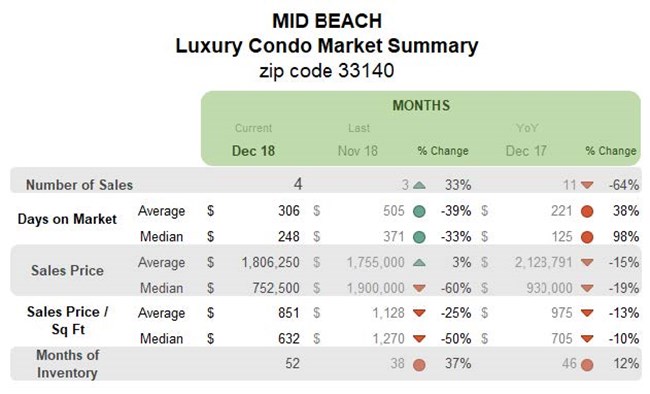
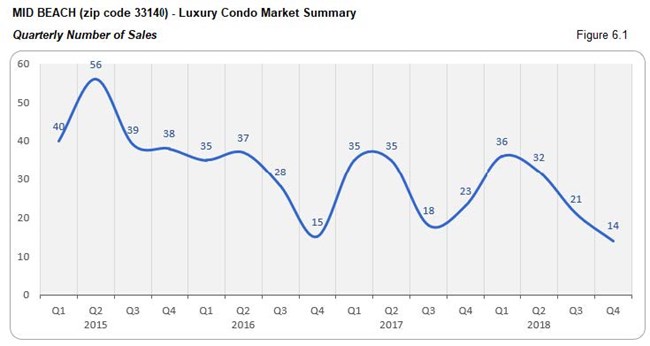
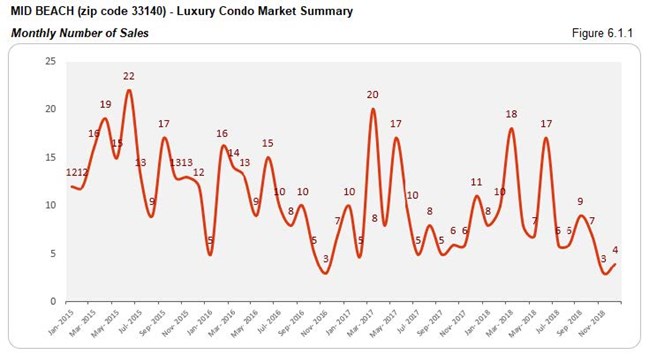
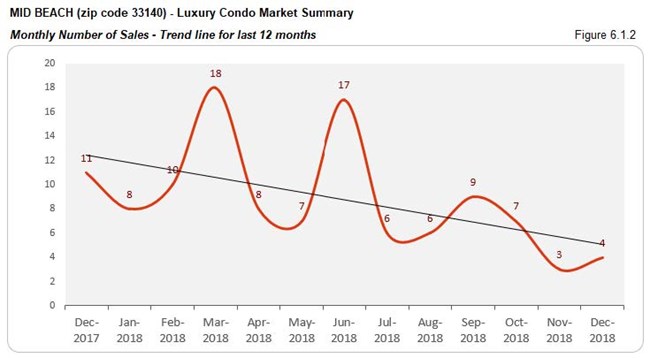
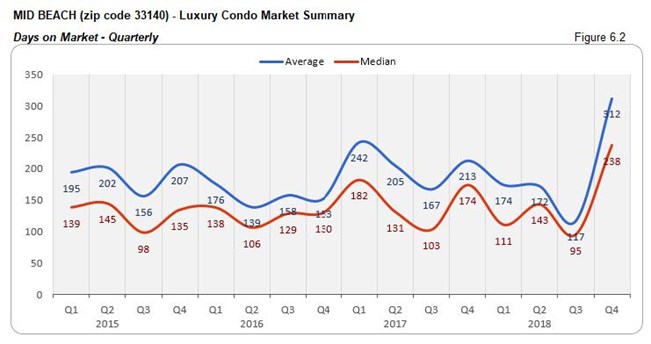
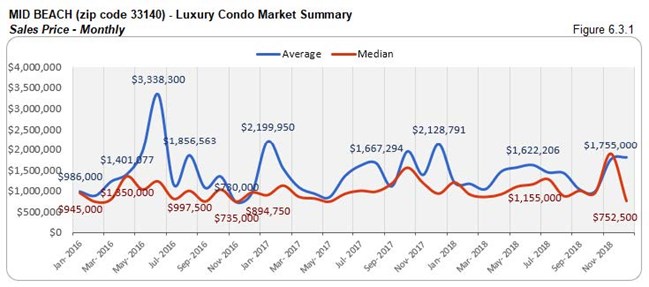
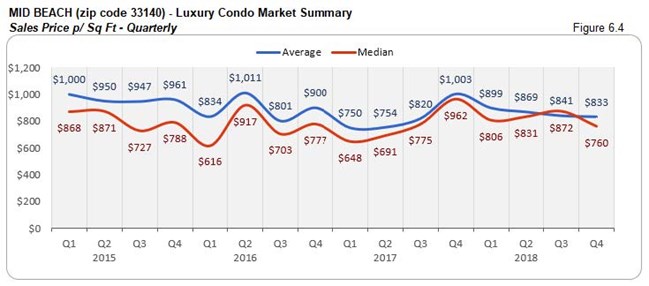
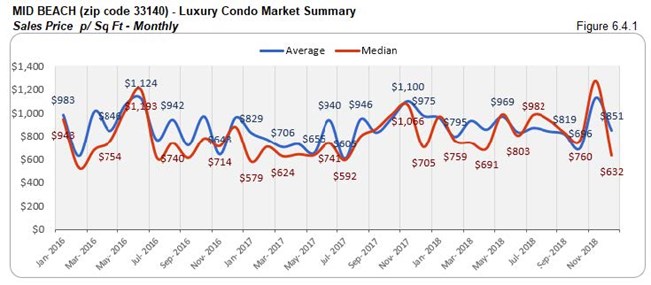
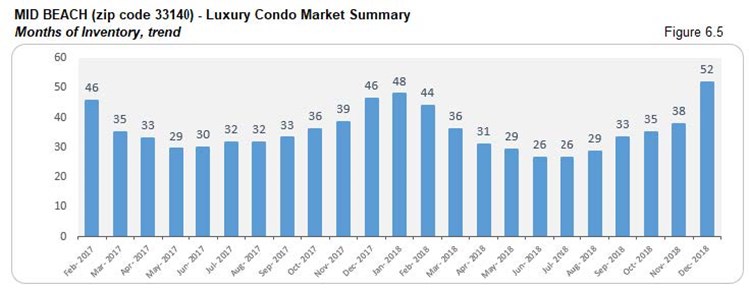
Mid-Beach Luxury Condo Market Summary (33140 zip)
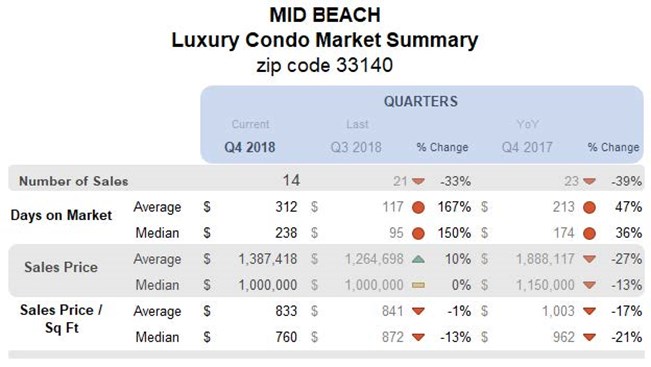
Quarterly sales and trend line succumb to seasonal lull. Reflective of the overall trend in Miami Beach, Mid-Beach posts a 39% decrease in year-over-year sales and 33% decline in quarter-over-quarter numbers. The impact of this slowdown is clearly visible in the negatively sloping trend line of fig. 6.1.2.
Days on market shoot up QoQ and YoY. Buyers and sellers had a tough time reaching a consensus in Mid-Beach. This is reflected by the steep increase in the median days on market for luxury condos. While the metric rose 150% quarter-over-quarter, the year-over-year numbers posted an increase of 36%.

Reduction in YoY prices, QoQ figures stay put. We see prices further deflate in Mid-Beach by year-end. While the quarter-over-quarter median price stayed put, the year-over-year metric reported a 13% decline. The year closed with the median price per sq. ft. at $760 (fig. 6.4).

Inventory rises to highest in past two years. The seasonal sluggishness of the market shows its impact by pushing up the months of inventory by 12% year-over-year. At 52 months, inventory is now much higher than the previous quarter’s closing of 33 and its ideal mark of 9-12 months. Buyers should milk it for all it’s worth by searching Mid-Beach condos for sale here, or starting out with a tour here.
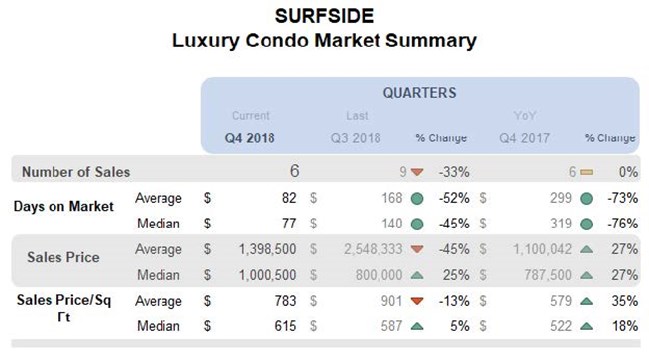
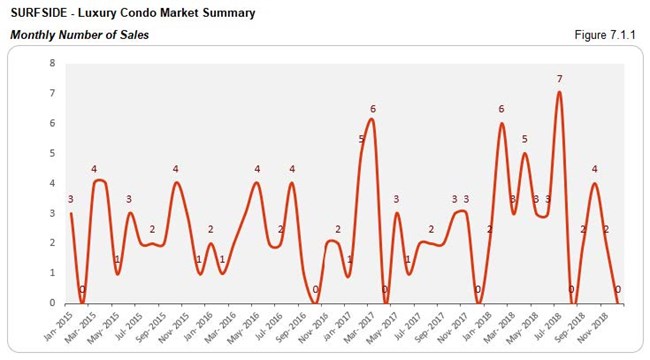
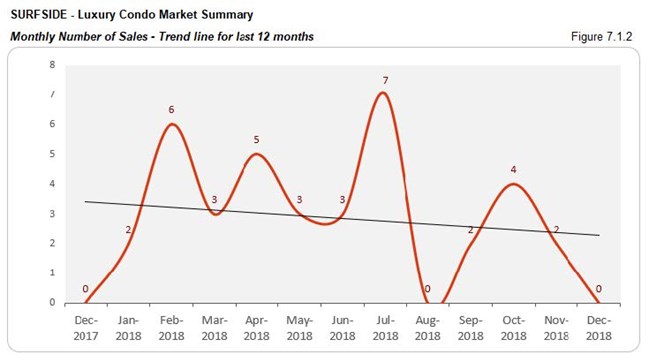
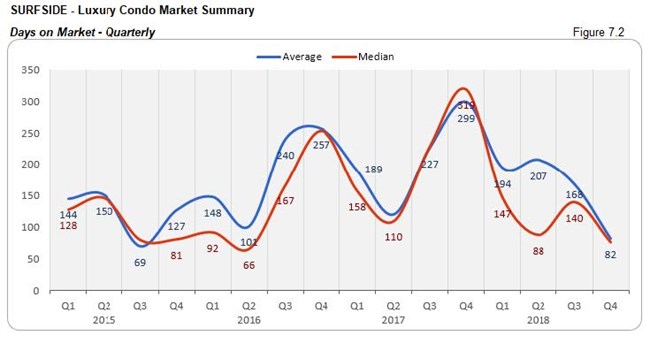
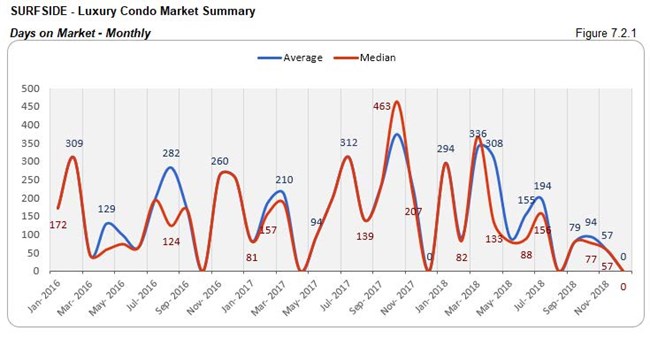
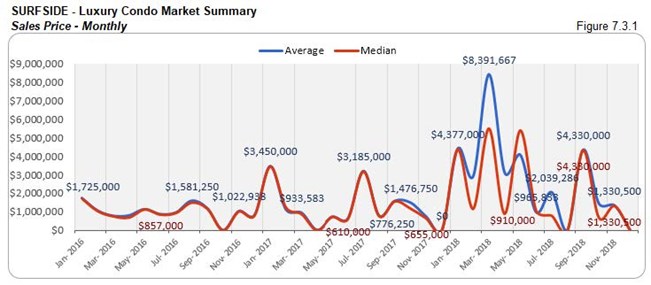
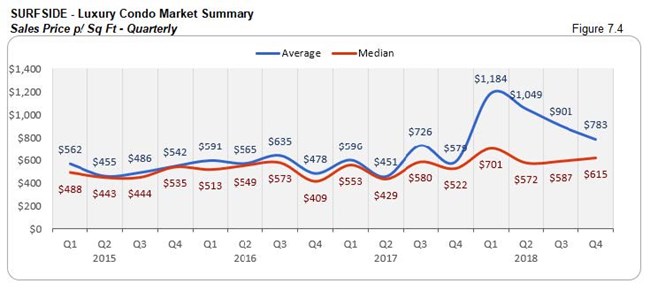
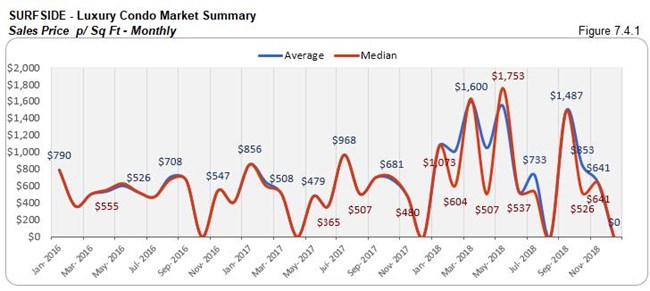
Surfside Luxury Condo Market Summary

Sales take a break and post negative trend line with volatile days on market. Surfside is a rather modest market for luxury condos, which is evident in its zero sales reported for September and December. Add to that a seasonal slowdown and this is why we see the market barely matching previous year numbers with a negative trend line in fig. 7.1.2.
Being a small market, the days on market tend to report great volatility, as seen in the sharp fall of fig. 7.2. Even the steep increase in quarter-over-quarter and year-over-year prices of fig. 7.3, 7.3.1, 7.4 and 7.4.1 are affected by this volatility.

Overall prices post reduction. Even with Surfside being a small market for luxury condos and metrics usually being volatile, we notice a decline in the prices for the coastal neighborhood. The median price is down 26% quarter-over-quarter and 10% lower year-over-year. The median price per sq. ft. for Q3 closed at $587. (see fig. 7.3. and 7.4 below)
Inventory ascends, but still below previous year levels. At 34 months, inventory is not just higher than September’s closing of 28, but also far from the ideal 9-12 months of a balanced market. However, an year-over-year analysis reveals that inventory is still 5% lower than Q4 2017. This shows buyer can still look for deals by searching for a Surfside condo for sale here, or see what lifestyle makes up Surfside here.

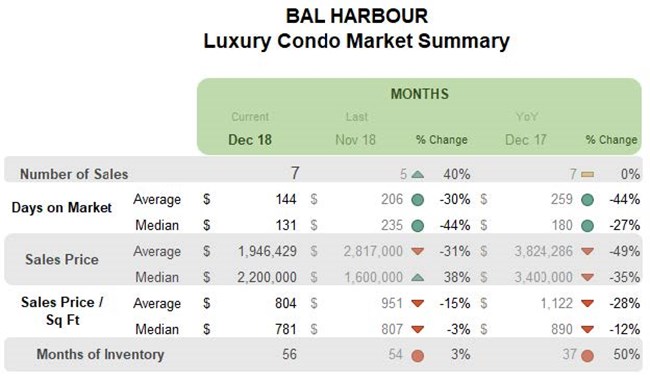
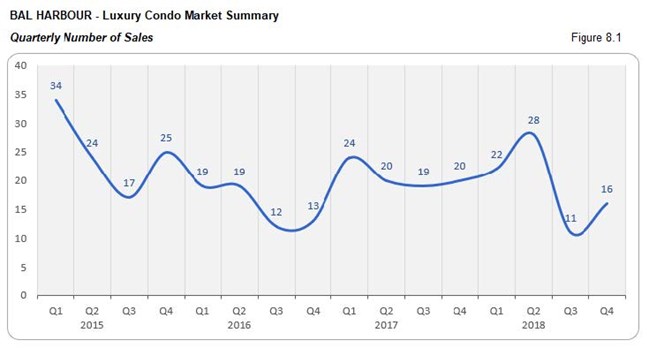
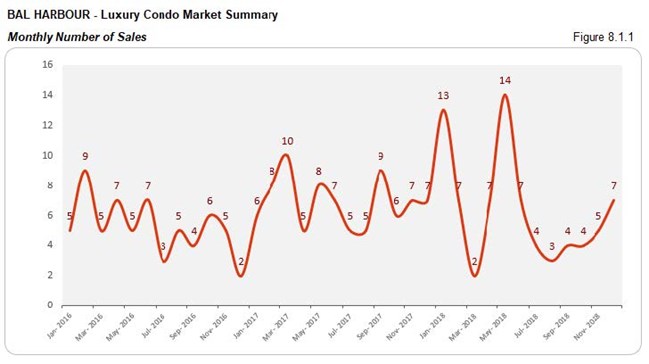
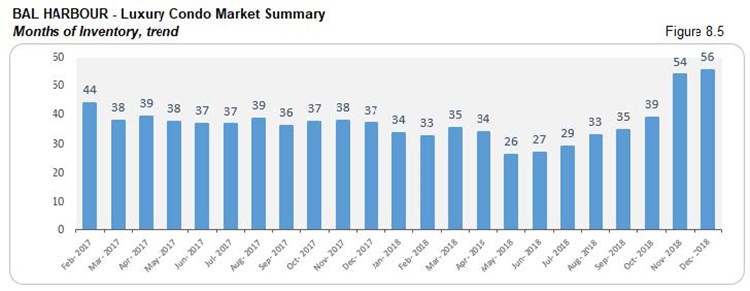
Bal Harbour Luxury Condo Market Summary
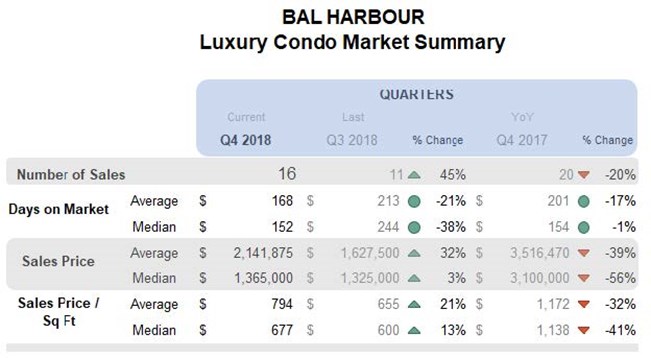
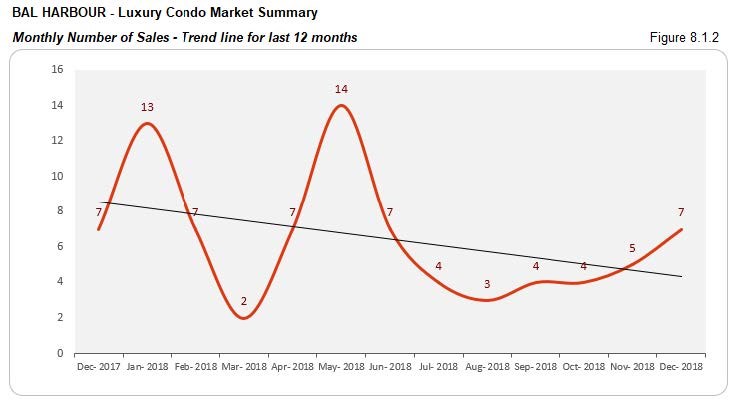
Sales above previous quarter, but lower YoY with negative trend line. Even though sales in Bal Harbour spiked 45% over Q3, they were still down 20% year-over-year. The impact of the seasonal lull in this last quarter is further visible in the downward sloping trend line of fig. 8.1.2.

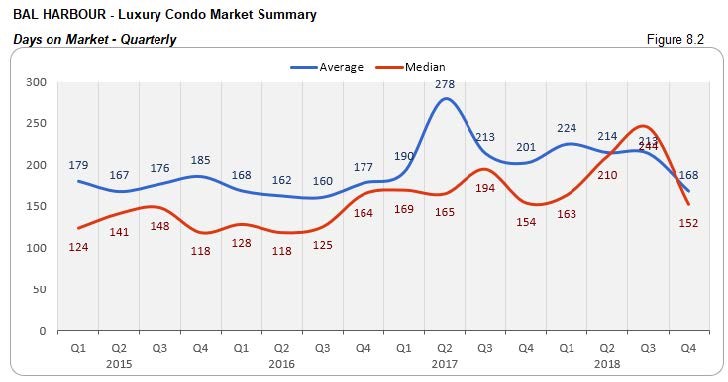
Days on market deflate QoQ and YoY. Luxury condos in Q4 took 92 days less (on median) than Q3 to get off the market. Even on a year-to-year basis, condos spent less time on the market, showing that buyers and sellers found it easier to find middle ground in this upscale neighborhood.

Prices decline YoY. Even though prices in Bal Harbour increased against the previous quarter, we see an overall decline in prices against Q4 2017. While the median price fell 56% year-over-year, the price per sq. ft. deflated 41%. Q4 closed with the median price at $677 per sq. ft. (see fig. 8.3 and 8.4 below)


Inventory jumps to highest in two years. Even with higher sales against its last quarter, inventory shot up 50% year-over-year in Q4. At 56 months, the seasonal slowdown pushed up inventory from September’s closing of 35 and pushed it away from the 9-12-month ideal of a balanced market. This puts ample choices and opportunities in the hands of buyers, which can be explored by searching for Bal Harbour condos for sale here, or checking out details on the upscale neighborhood here.
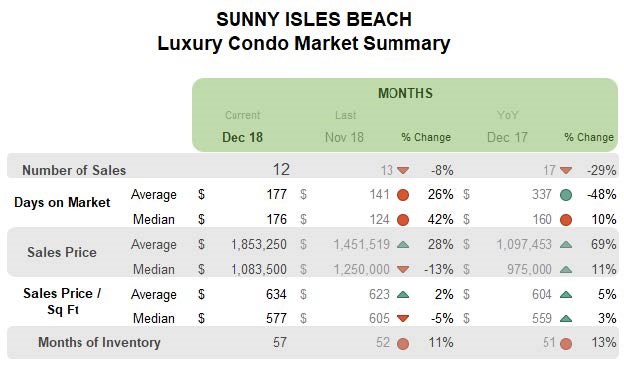
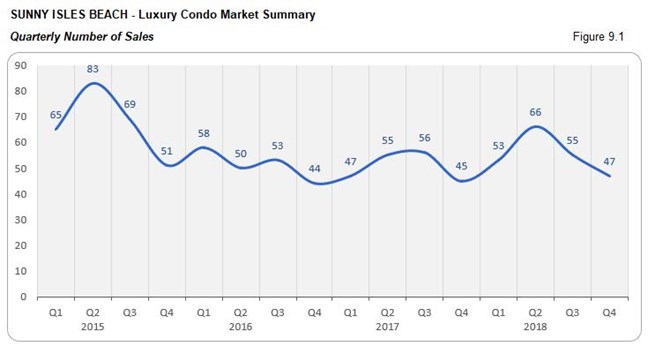
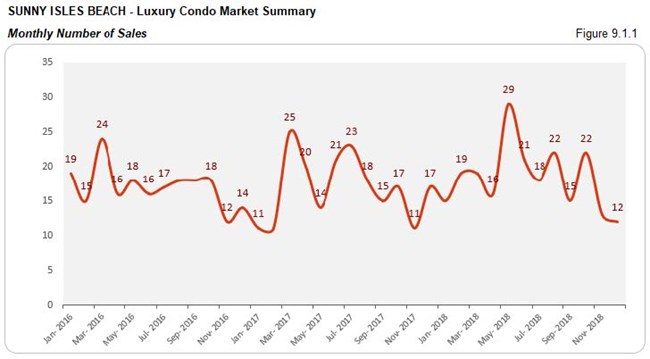
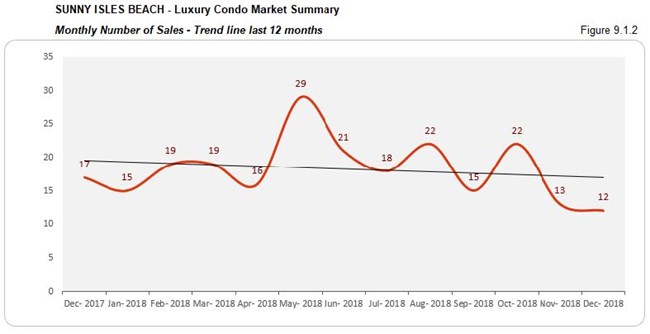
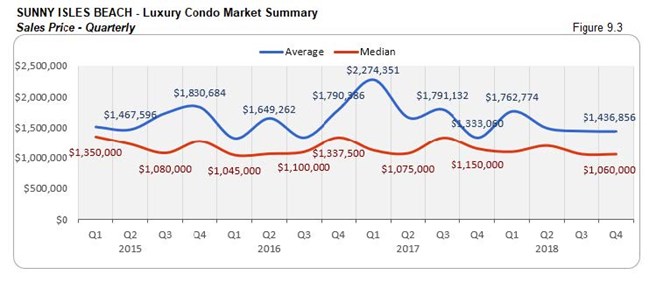
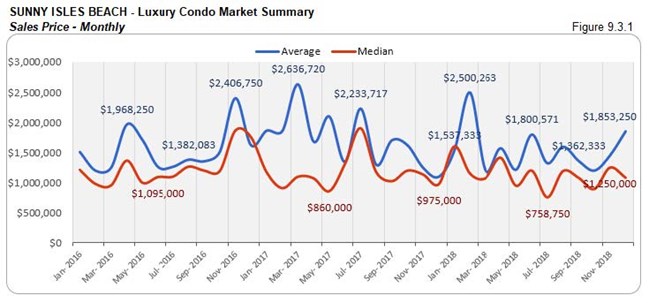
Sunny Isles Beach Luxury Condo Market Summary
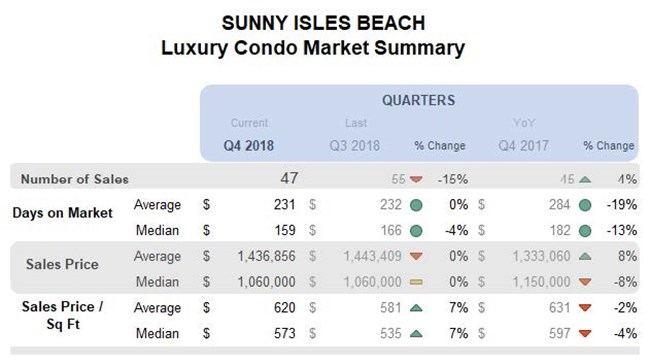

YoY sales post uptick with negative QoQ numbers and trend line. Even as sales post a 4% year-over-year increase in Q4, the momentum is not high enough to keep the trend line in fig. 9.1.2 positive, showing the impact of the seasonal slowdown on this branded condo dominated neighborhood.
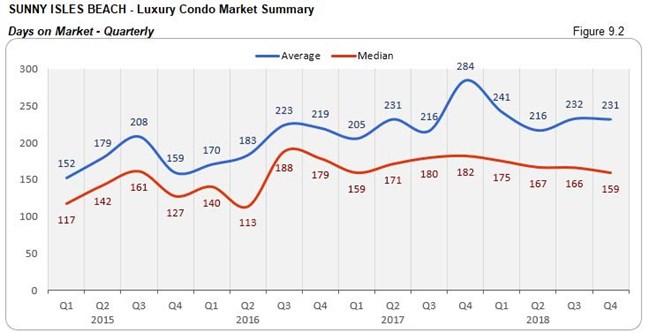
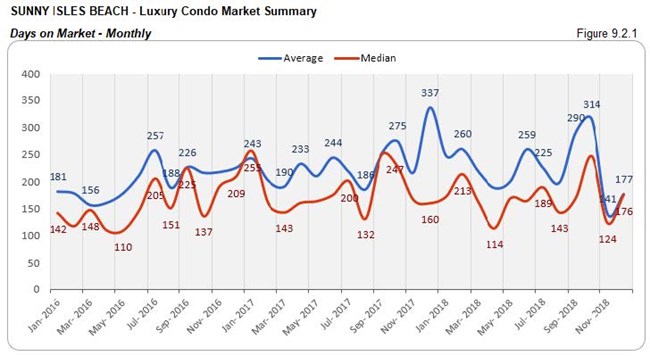
Days on market move to 10% higher YoY. Luxury condos had to sit 16 days longer on the market (on median) year-over-year and 52 days longer quarter-over-quarter. This metric shows that buyers and sellers found it tougher to reach a consensus in this seaside neighborhood.
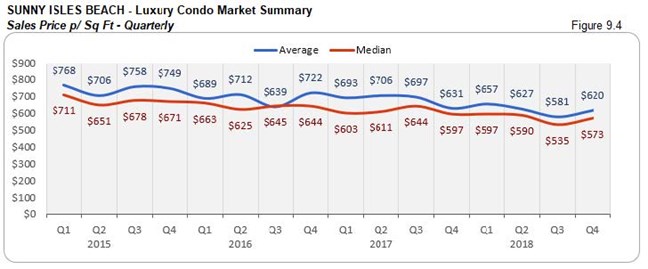
YoY prices post decline. There is an 8% decline in the year-over-year median price and 4% decrease in the YoY price per sq. ft. in Sunny Isles Beach. This shift shows that buyers have been successful in negotiating for deals, closing the quarter at a median price of $573 per sq. ft. (see fig. 9.3, 9.3.1, 9.4 and 9.4.1)
Inventory climbs 13% YoY. At 57 months, inventory is not only higher than Q3’s closing of 46, but also much higher than the 9-12-month mark of a balanced market. This puts buyers in the driving seat as they search Sunny Isles Beach condos for sale here or begin by exploring the lifestyle options here.

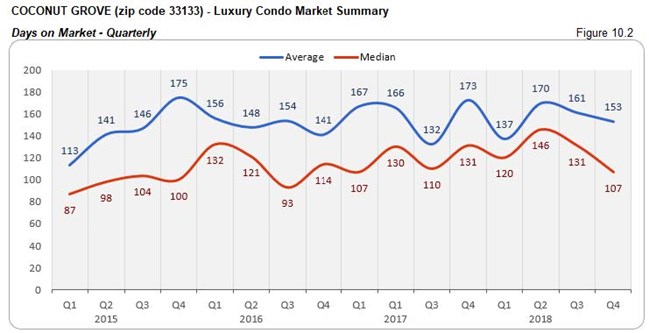
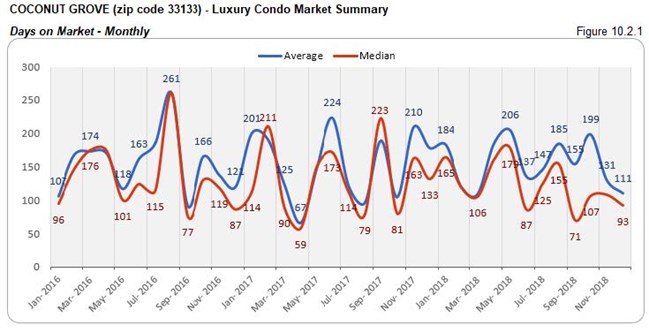
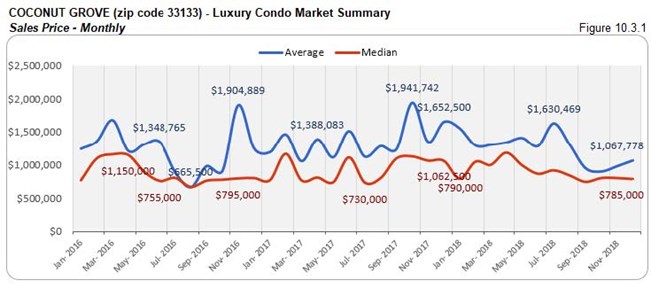
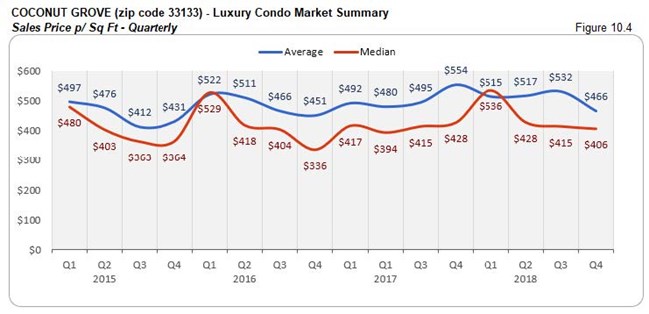
Coconut Grove Luxury Condo Market Summary (33133 zip)
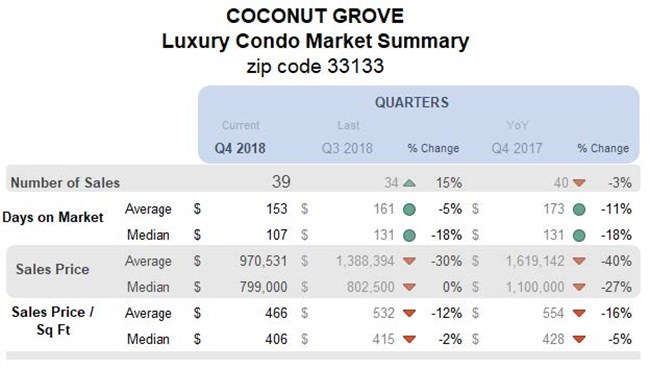
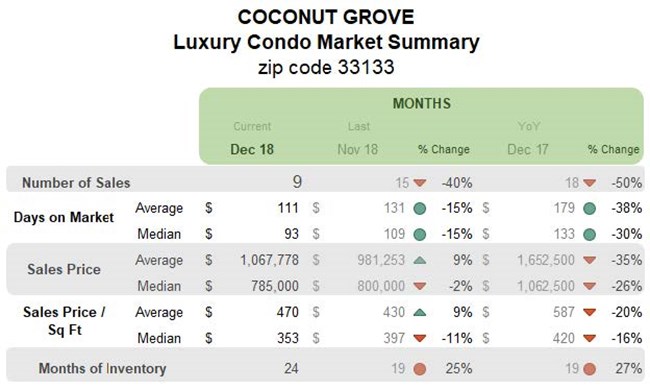
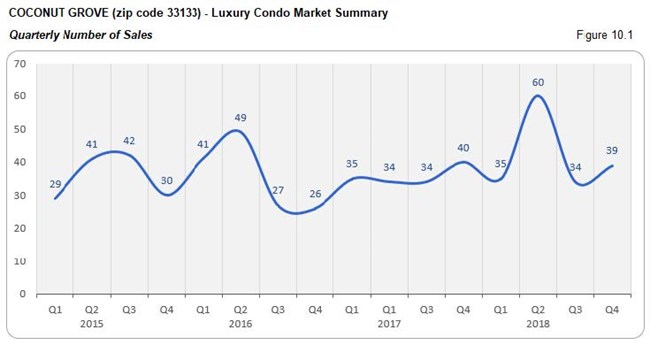
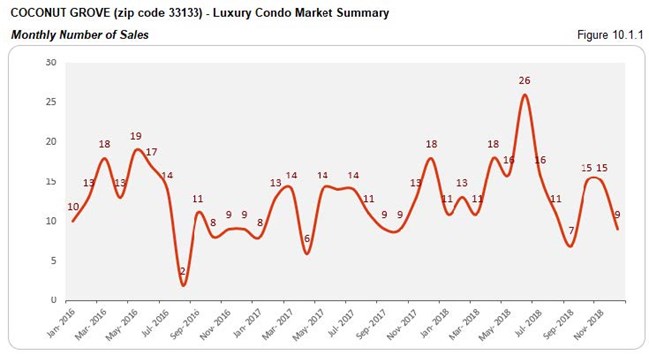
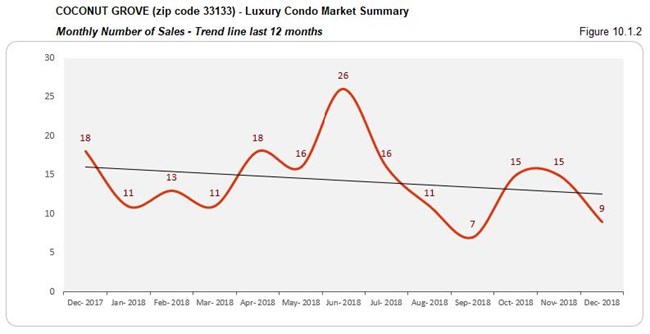
Quarterly sales post uptick, but YoY numbers and trend line come back negative. Even as this dynamic market posts a 15% quarter-over-quarter increase, we see that sales fell 3% year-over-year in Q4. The seasonal slip also makes it impact felt on the trend line in fig. 10.1.2, giving it a negative slope.
Days on market down 18% QoQ and YoY. On a more positive note, we see that the days on market reduced in the last quarter for this vibrant neighborhood. Luxury condos in Q4 took 24 less days (on median) than Q3 and Q4 2017 to move off the market. This shows that buyers and sellers reached a consensus sooner.
Prices reduce QoQ and YoY. With buyer pressure still clearly driving the market, we see the median prices fall 27% year-over-year and the price per sq. ft. reduce 5%. This closed the quarter at a median price of $406 per sq. ft. (see fig. 10.3, 10.3.1, 10.4 and 10.4.1 below)

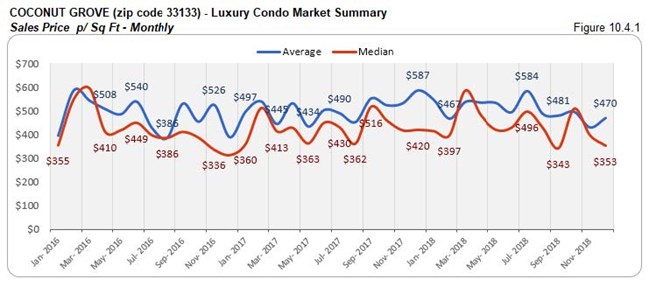
27% increase in YoY inventory. Moving back to its highest levels in the past two years, we see inventory at 24 months this Q4. This is not only way higher than Q3’s closing of 17 months, but also further from reaching the ideal 9-12-month mark of a balanced market. Buyers should make their move now to grab deals by searching Coconut Grove condos for sale here, or check out what lifestyle makes this vibrant neighborhood here.

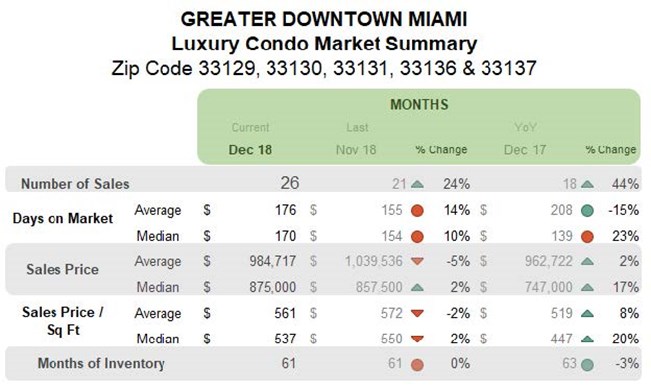
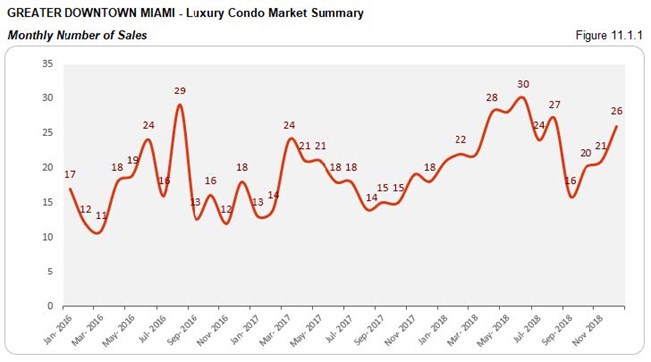
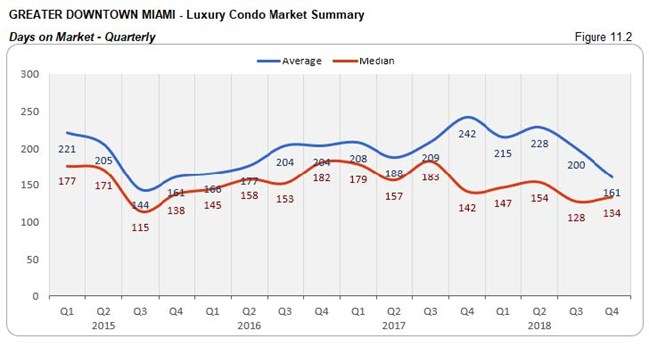
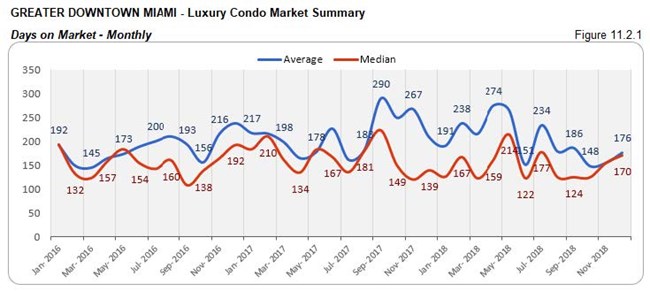
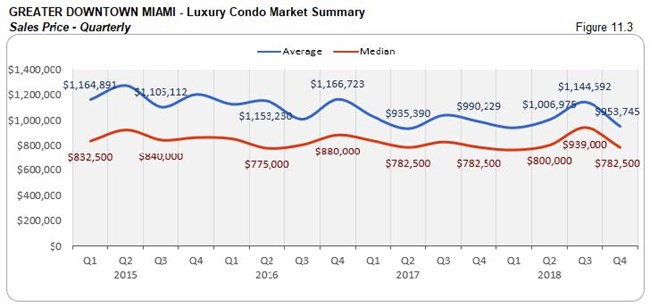
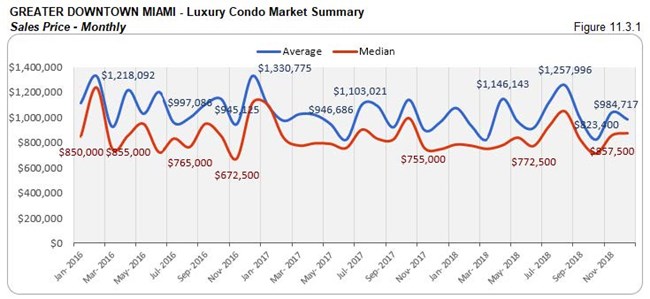
Greater Downtown Miami Luxury Condo Market Summary (33129, 33130, 33131, 33136, 33137 zips)
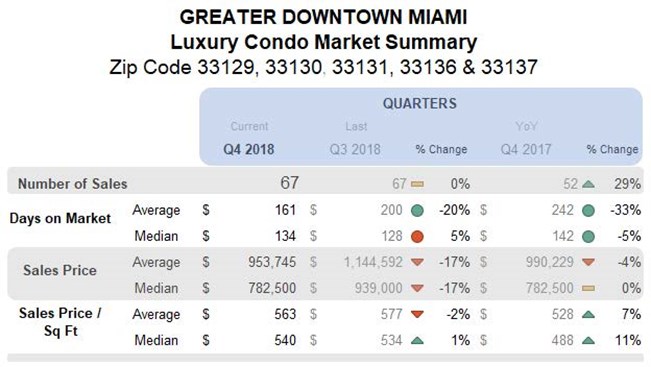
YoY sales jump 29% with positive trend line. Greater Downtown Miami is one of only three neighborhoods in our study to report an increase in year-over-year sales with a positive trend line (fig. 11.1.2). Not only did Q4 sales match Q3, but also outdid the same quarter last year by 29%. An upward incline on the trend line further indicates that the district managed to retain its momentum of sales in spite of a seasonal lull.


Days on market drop 5% YoY. In another positive marker, we see the year-over-year median days on market reduce by 8 days, indicating good dialogue between buyers and sellers.
Quarterly prices match previous year levels with uptick in price per sq. ft. After going up the last couple of quarters, we see the median price drop 17% compared to Q3 (fig. 11.3). This brings the median price to match Q4 2017 levels, however the price per sq. ft. was still 11% higher year-over-year. Q4 closed with the median price at $540 per sq. ft. (fig. 11.4).

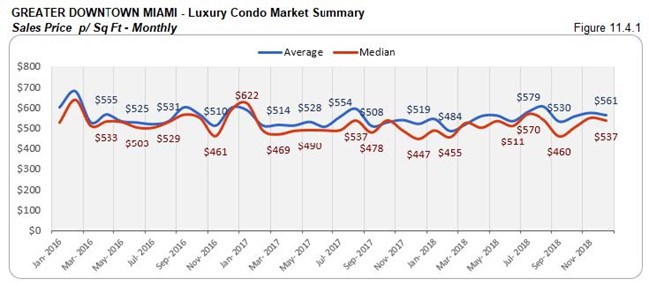
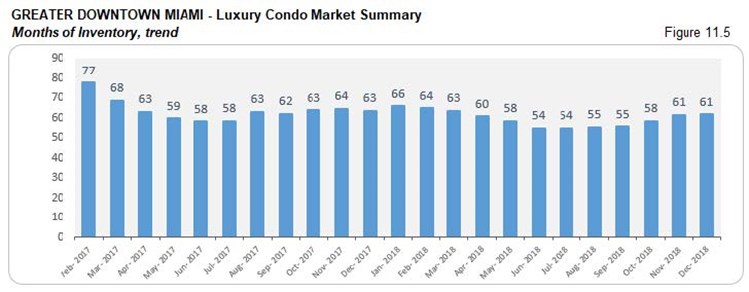
Inventory down 3% YoY. Even as we see the months of inventory jumping from 55 in the previous quarter to 61 months in Q4, it is still worth noting that there is a 3% decline in year-over-year trends. However, still way off the 9-12-month benchmark of a balanced market, buyers have a great window of opportunity to search the Greater Downtown Miami area here for some outstanding deals.
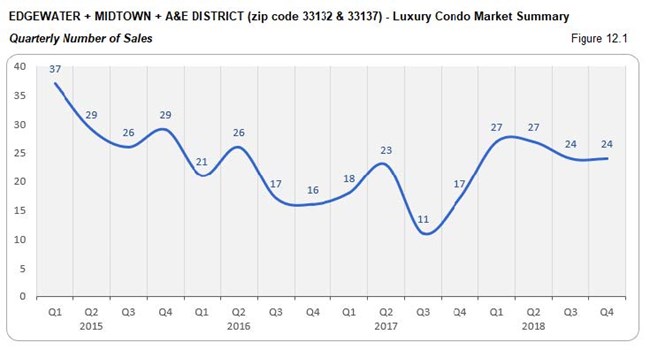
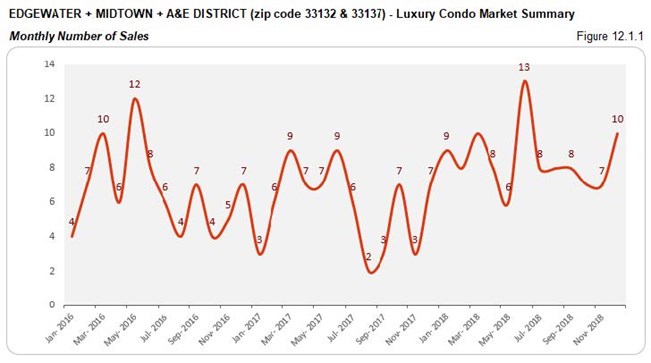
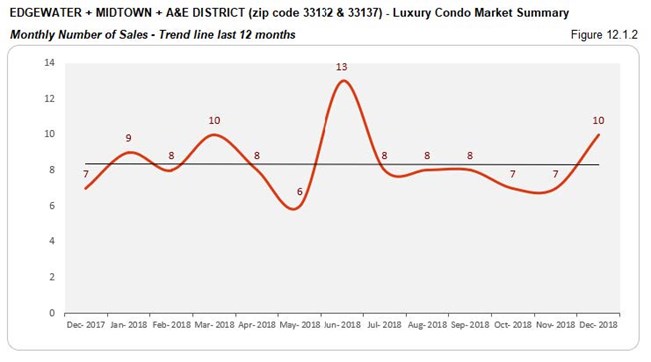
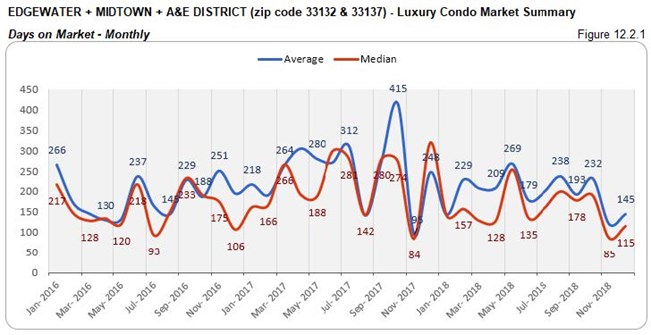
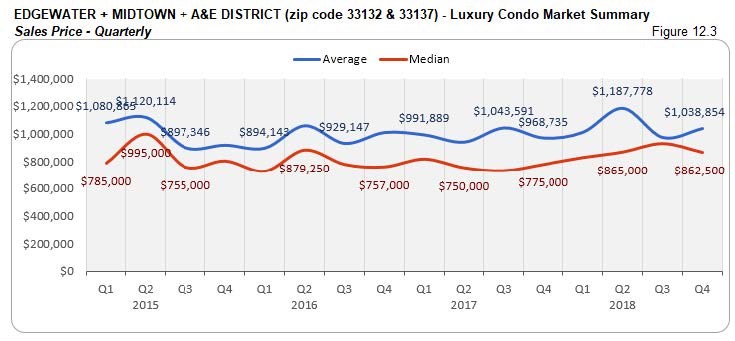
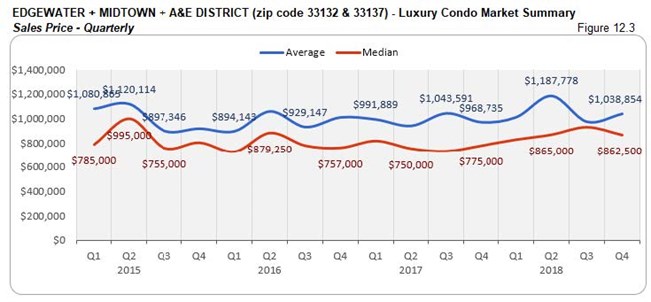
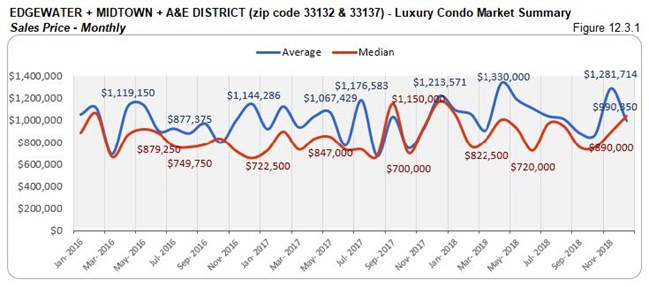
Edgewater + Midtown + A&E District Luxury Condo Market Summary (33132 + 33137 zip)
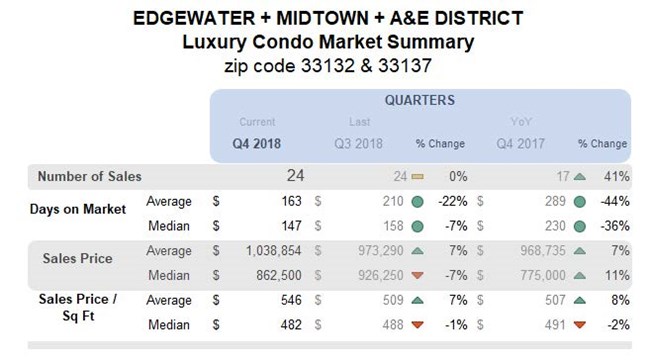
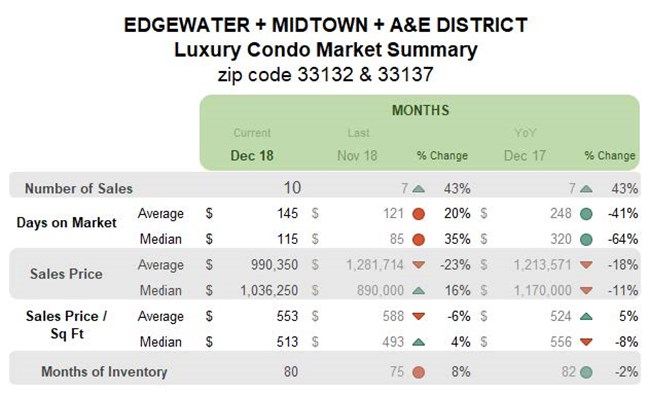
Quarterly sales sustain with positive YoY metrics and trend line. In spite of a seasonal dip, Q4 sales matched Q3 numbers and reported a 41% uptick in the year-over-year comparison. One of only three neighborhoods in our study to come back with positive sales this quarter, we see the grouping has kept its momentum with a balanced trend line in fig. 12.1.2.
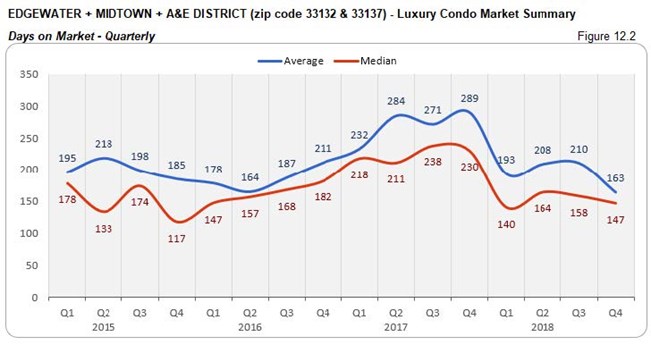
Days on market deflate 7% QoQ and 36% YoY. Here we find a healthy decline in days on market for both the quarter-over-quarter and year-over-year metrics. Luxury condos in Q4 took 11 less days (on median) to get off the market compared to Q3, and 83 less days compared to same time last year.
Prices move in an upward direction. Even though the quarter-over-quarter median prices post a reduction of 7%, we see that prices in this area have increased 11% year-over-year. By quarter-end, the median price per sq. ft. closed at $482. (see fig. 12.3, 12.3.1, 12.4 and 12.4.1). This is likely due to newer. more expensive condos selling.

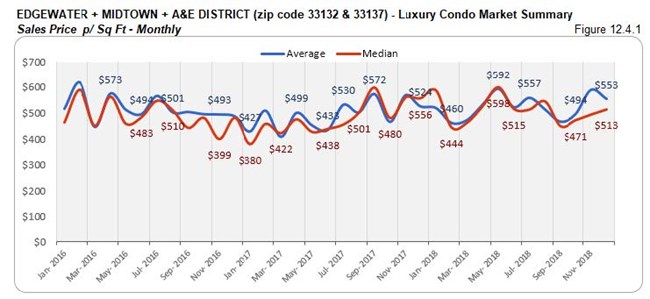
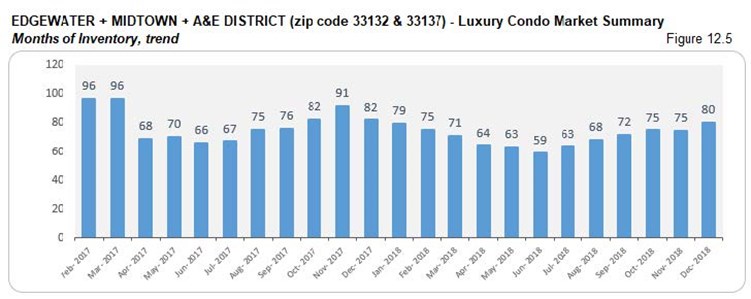
Inventory down 2% YoY. Again, as the months of inventory jump from 72 in the previous quarter to 80 in Q4, there is still a 2% reduction to report year-over-year. With levels far from the 9-12-month ideal of a balanced market, buyers have an upper hand in negotiations and should browse through Edgewater condos for sale here or begin by exploring the individual lifestyle plus condo options in Edgewater, Midtown and Arts & Entertainment District.
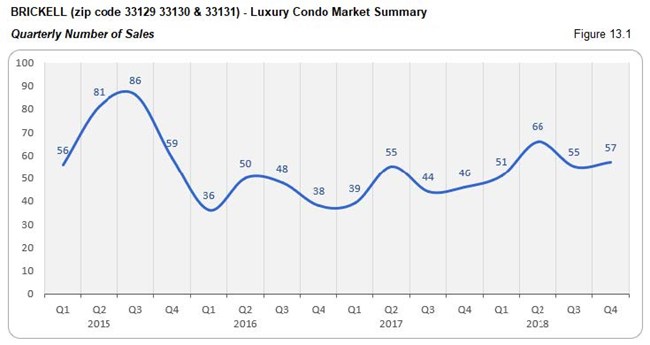
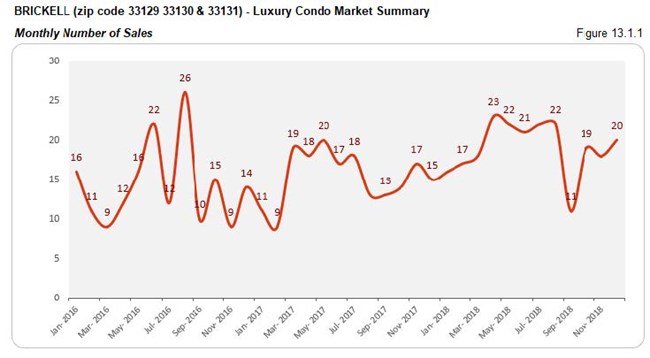
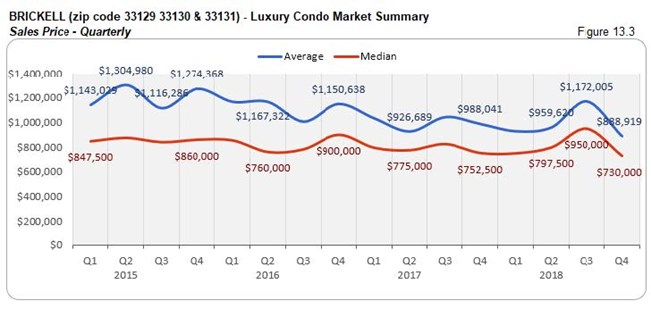
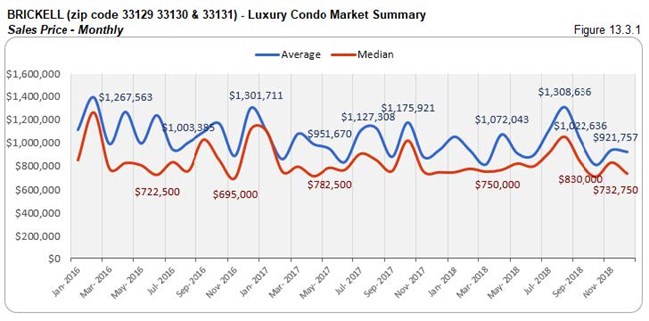
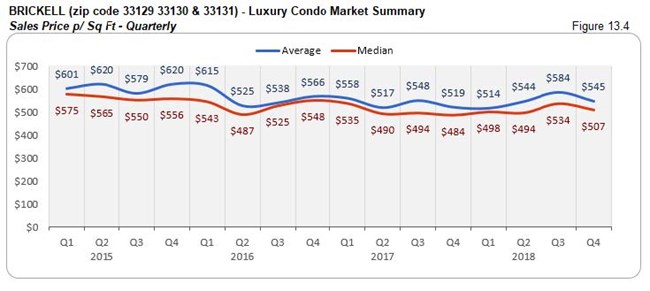
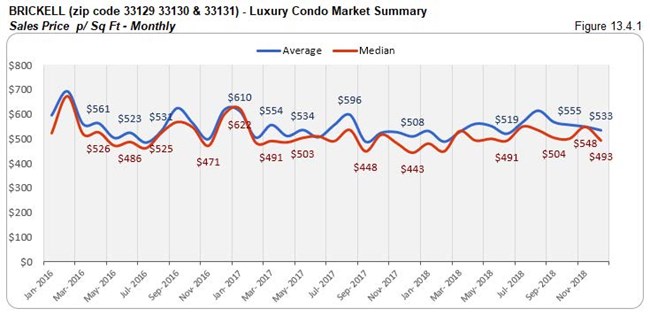
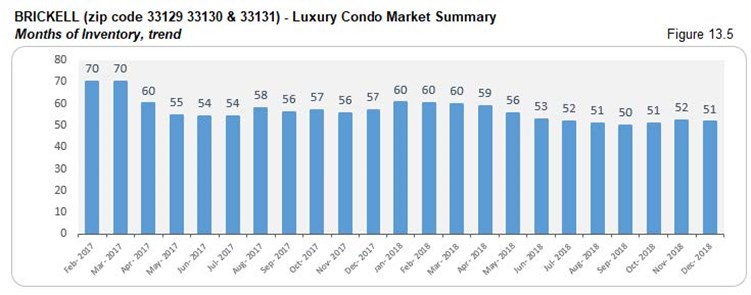
Brickell Luxury Condo Market Summary (33129, 33130, 33131 zip)
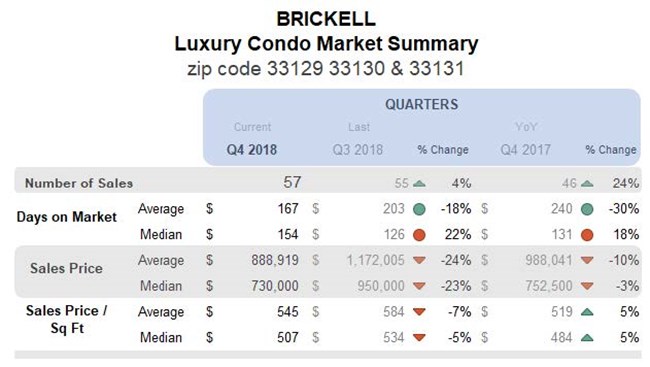

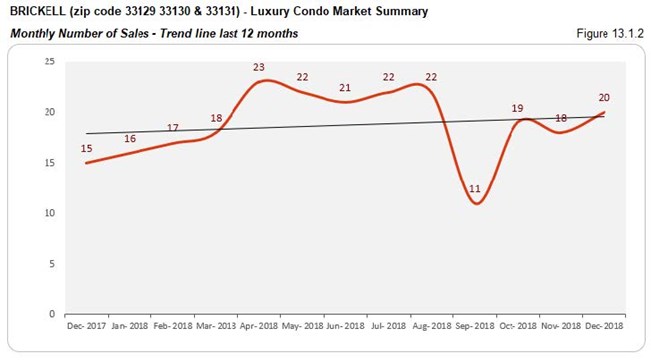
Quarterly and YoY sales post uptick with positive trend line. One of only three neighborhoods in our study to report positive sales, Brickell posts a 4% increase in quarter-over-quarter numbers and 24% improvement year-over-year. This keeps the trend line in fig. 13.1.2 positive, showing that the luxury condo market here maintained its momentum in spite of the seasonal slowdown.
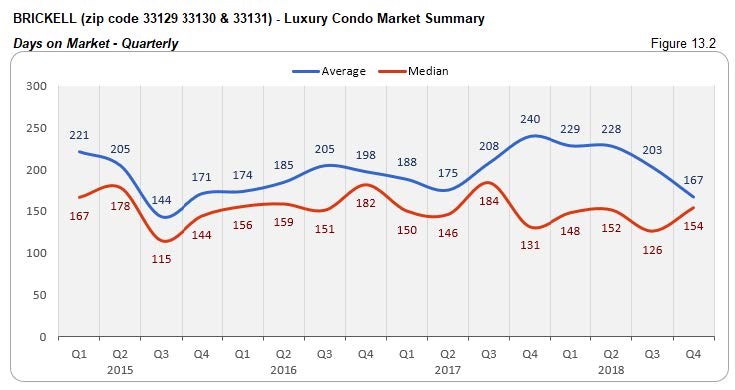
Days on market climb 18% YoY. Luxury condos in Q4 took 28 days longer (on median) than Q3 to move off the market, and 23 days longer compared to same quarter last year. This shows that buyers and sellers found it tougher to come to an understanding in the last quarter in this business district.


Prices mostly post decline with some volatility. We see the median price come down 23% against Q3 and 3% against same quarter last year in this business district. However, the median price per sq. ft. increased 5% year-over-year, closing the quarter at $507 per sq. ft. (see fig. 13.3, 13.3.1, 13.4 and 13.4.1 below)
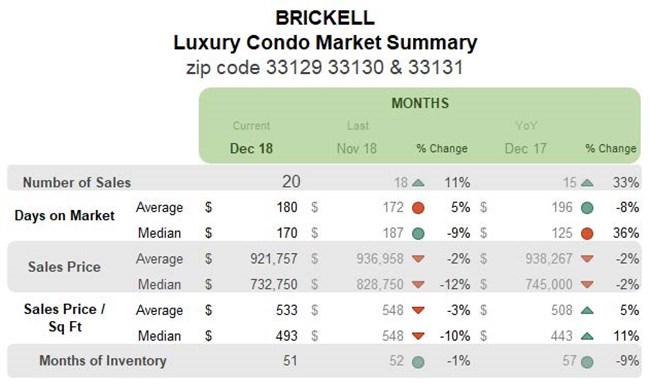
Inventory dips 9% YoY. A good level of sales keeps inventory in check for this business district. At 51 months, inventory has barely shifted from September’s closing of 50. Even the year-over-year trend declined 9%, showing good progress in Brickell. However, with levels far from the ideal mark of 9-12 months, buyers should seize this opportunity by searching Brickell condos for sale here or taking a tour through Brickell here and finding good deals.
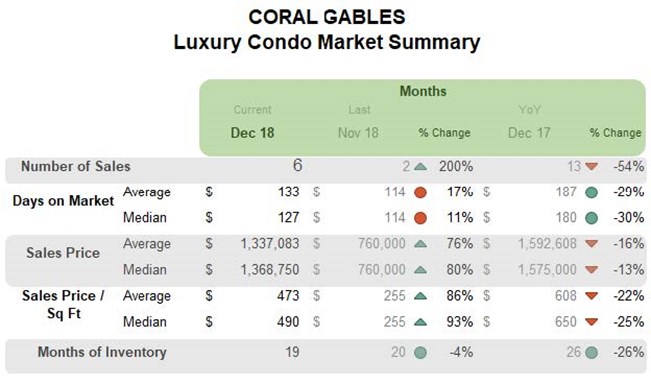
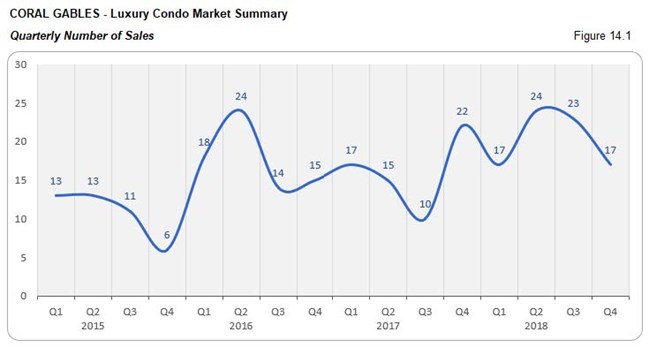
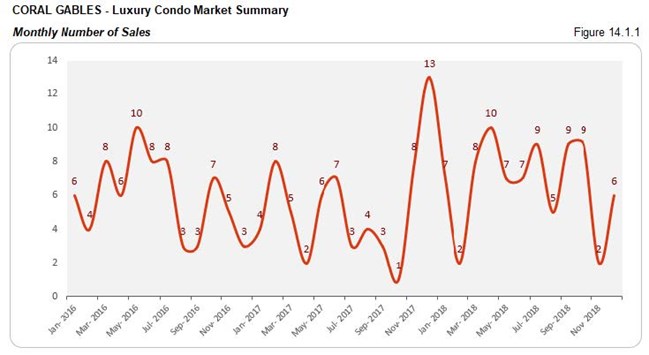
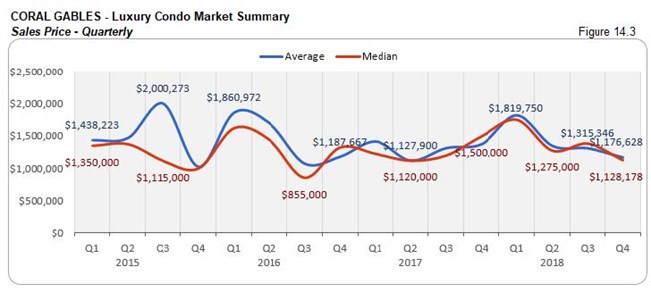
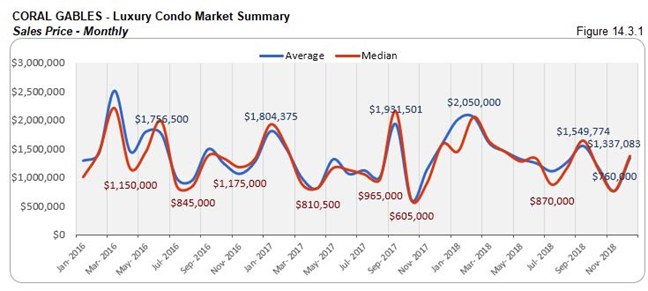
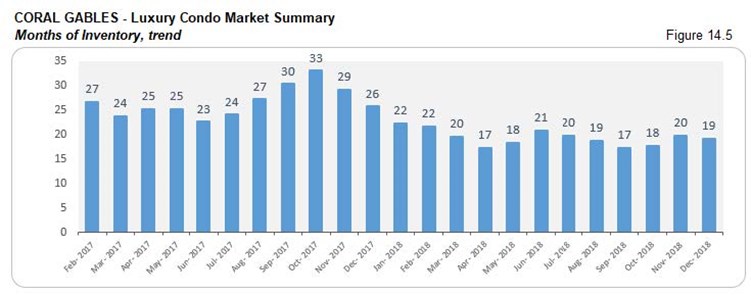
Coral Gables Luxury Condo Market Summary
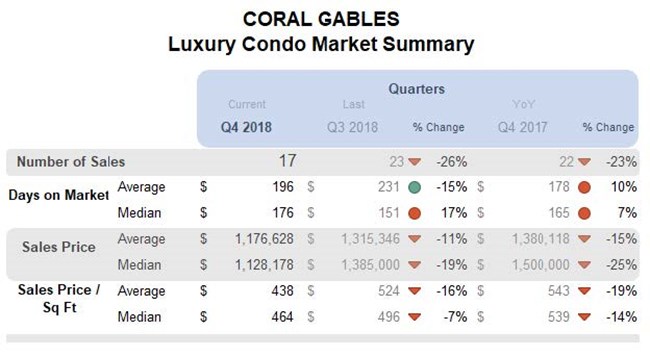
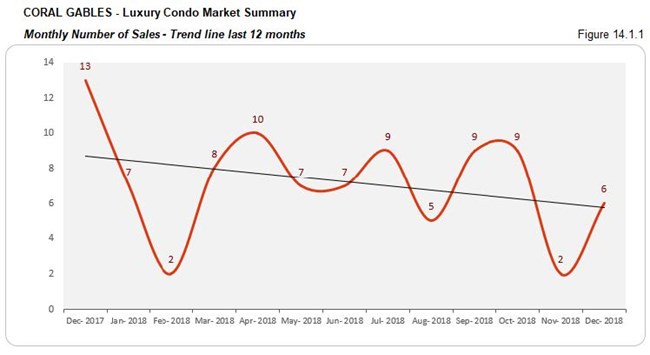
Quarter bows to seasonal pressure with negative sales and trend line. In line with the majority of the neighborhoods in our study, Coral Gables reports a 26% decline in sales quarter-over-quarter and 23% dip year-over-year. This leaves its impact on the trend line in fig. 14.1.2 by tilting it downwards.
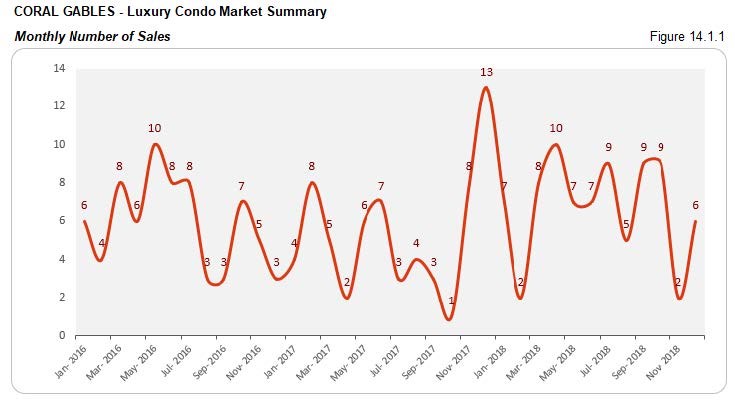
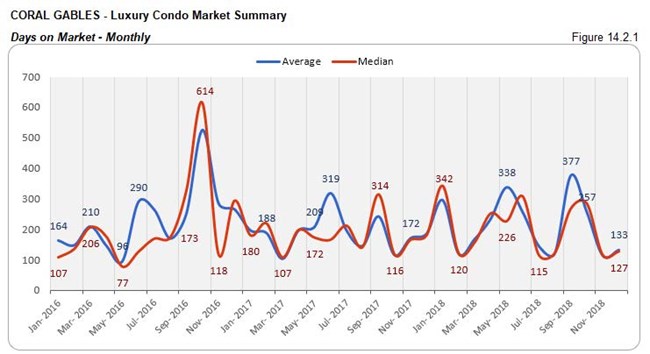
Days on market escalate 17% QoQ and 7% YoY. Luxury condos took 25 days longer to get off the market compared to Q3, and 11 days longer year-over-year. This shows that buyers and sellers could not easily come to a consensus in City Beautiful this last quarter.


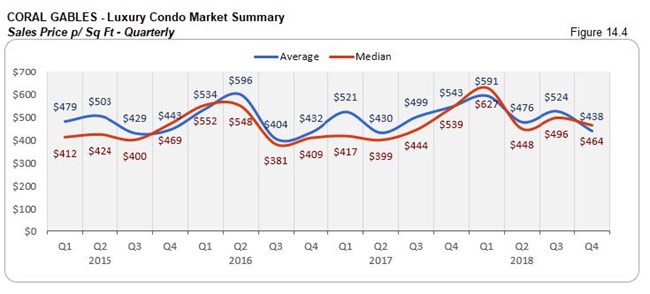
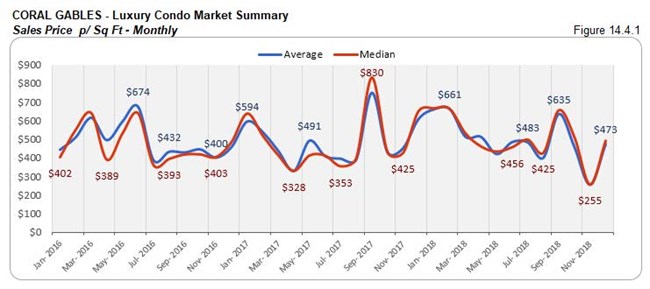
Drop in QoQ and YoY prices. There is a significant drop in quarter-over-quarter and year-over-year median prices, with Q4 reporting a 19% and 25% decline respectively. The median price per sq. ft. too closed 14% lower year-over-year at $464 per sq. ft. (see fig. 14.3, 14.3.1, 14.4 and 14.4.1 below)
Inventory deflates 26% YoY. While there was a slight increase in the months of inventory from September-end (17 months) to December-end (19 months), there is still a 26% decline to report year-over-year. Nonetheless, figures are still far from reaching the 9-12-month ideal of a balanced market, indicating a good playing field for buyers to come in for negotiations as they search Coral Gables condos for sale here, or start by checking out the lifestyle options in Coral Gables here.
Conclusion
Higher year-end inventory makes it a market full of opportunities in 2019. As 2018 came to an end, the luxury condo market saw a sudden escalation in inventory because of a slow holiday season, which is normal for this time of year. With higher inventory and lower prices in majority of the neighborhoods, we see that buyers have a perfect playing field to strike advantageous deals. Our verdict: we see most of 2019 favoring buyers again, until this glut of inventory clears up.
Love what you see? Don’t forget to share our blog and subscribe (see the subscribe link on the top menu) to receive the latest market news in your inbox.
Have any questions? Or see something wrong with the stats? Please contact Sep at sniakan (at) hbroswell.com or call 305-725-0566.
Share your thoughts with us

Your Miami Condo Awaits
Recent Posts


 (305) 697-7667
 (786) 321-7233
  contact@condoblackbook.com

