Miami Luxury Condo Market Report Q4 2019

Jan 27, 2020 January 27, 2020
Miami's luxury condo market has been buyer-friendly for the past couple of years. And, with CondoBlackBook's year-end analysis of numbers coming in, it's easy to see that 2019 closed as a buyer's market, as well. Read on for details on how Miami luxury condo sales, prices, days on market, and inventory trended for quarter, year, as well as on a neighborhood basis.
This luxury condo market report only features properties priced $1 million and above, and covers the neighborhoods of Greater Downtown Miami (inclusive of Edgewater and Brickell), Miami Beach (inclusive of Surfside, Bal Harbour, Sunny Isles Beach and Fisher Island) as well as Coral Gables and Coconut Grove.
Overall Miami Luxury Condo Market Summary | ||
Annual sales up by 2.3% | Overall luxury condo prices increase | High levels of inventory continue to favor buyers |
Overall Miami Luxury Condo Market Highlights
- Q4 2019 reports highest year-over-year sales in at least five years
- Brickell leads annual sales growth in 2018-2019 comparison
- Mid/North Beach leads sales growth in Q4 year-over-year comparison
- 12-month trendline flat for Miami overall
- South Beach remains the most expensive with highest price per sq. ft. in annual, as well as Q4 year-over-year analysis
- Fisher Island reports highest percentage increase in sales price, as well as price per sq. ft. for the year
- Demand for buildings built 2000-2014 experience surge in demand with an increase in price per sq. ft.
- Days on market increased annually and year-over-year for Q4
- 2019 closed as a buyer's market
Table of Contents
- Overall Miami Luxury Condo Sales Trends
- Neighborhood Trends - Number of Sales
- Overall Miami Luxury Condo Price Trends - Sales Price, Price/Square Foot
- Neighborhood Trends - Sales Price, Price/Square Foot
- Miami Condo Sales Price Trends by Building Year
- Overall Miami Luxury Condo Days on Market Trends
- Neighborhood Trends - Days on Market
- Overall Inventory Trends (High Inventory Keeps Market Buyer-friendly)
- Conclusion
- Where Does the Miami Luxury Condo Market Go From Here?
Overall Luxury Condo Sales Up
Overall Miami Luxury Condo Annual Market Summary - Fig. 1.1
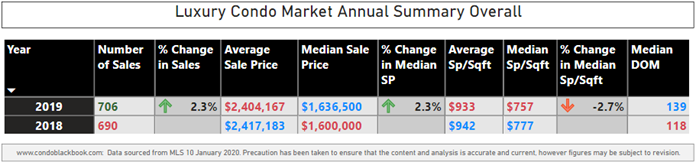
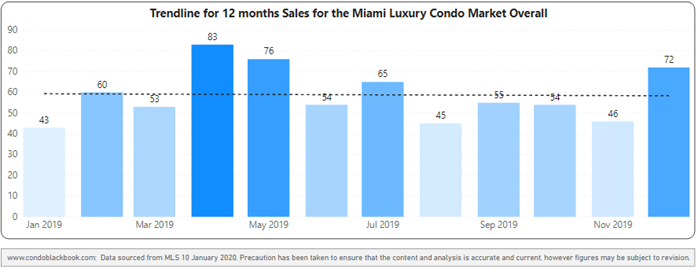
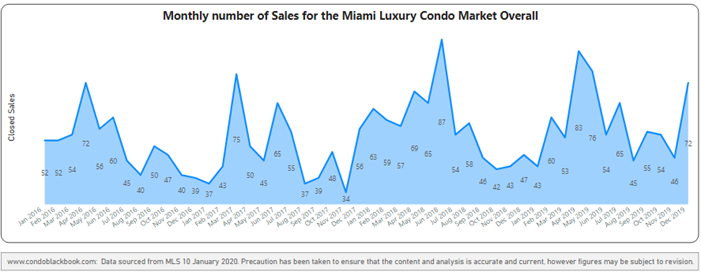
Annual sales increased by 2.3% with flat trendline. The luxury condo market in Miami closed 2019 on a positive note, up 2.3% over 2018 (fig. 1.1). Historically, the last quarter of the year typically records the lowest sales. However, in 2019, an exceptionally good Q3 and Q4 contributed towards a boost that pushed sales higher than 2018 (fig. 1.3). This improvement can also be traced in the 12-month trendline (fig. 1.2) that remains flat for the year, showing stability and room for growth ahead.
Miami Overall 12-Month Sales with Trendline - Fig. 1.2
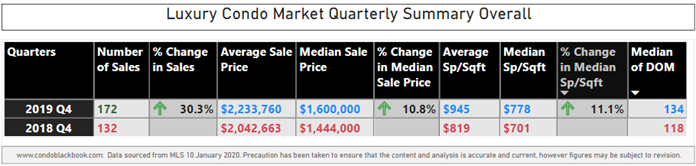
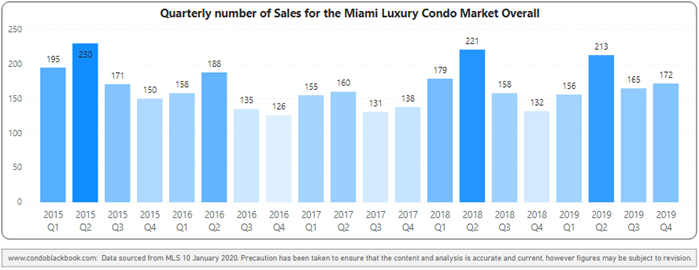
Q4 sales grow 30.3% year-over-year. Closing the year strongly, the 4Q19 outperformed Q4 2018 by 30.3% (fig. 1.3). This is also the highest overall luxury condo sales number we've seen in a fourth-quarter for at least five years (fig. 1.4).
Overall Miami Luxury Condo 4Q19 Market Summary - Fig. 1.3
Miami Overall Quarterly Sales 2015 - 2019 Heatmap - Fig. 1.4
Miami Luxury Condo Monthly sales from Jan. 2016 to Dec. 2019 - Fig. 1.5
Neighborhood Trends - Number of Sales
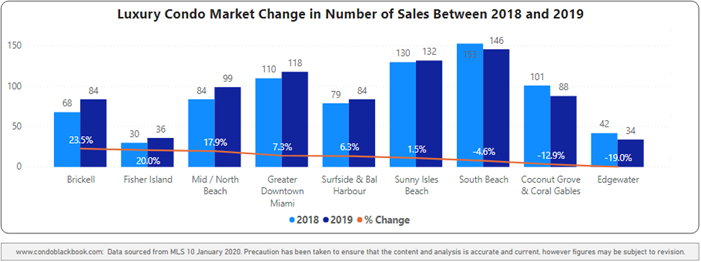
Annual 2018-2019 Sales Trends (fig. 2.2.1)
- Winner: Brickell reports highest percentage sales growth (23.5%) compared to 2018
- Up: Fisher Island (20%), Mid/North Beach (17.9%), Greater Downtown Miami (7.3%), Surfside & Bal Harbour (6.3%) plus Sunny Isles Beach (1.5%) also post sales growth
- Down: Only South Beach (-4.6%), Coral Gables & Coconut Grove (12.9%), and Edgewater (-19.0%) report a drop in annual condo sales numbers
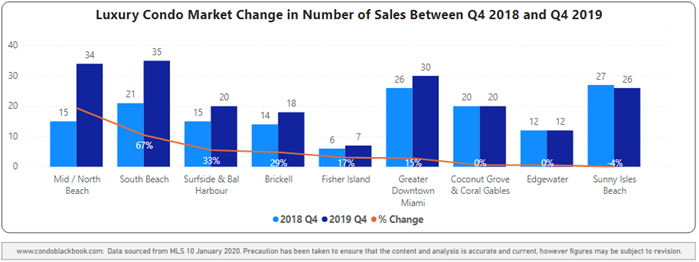
Q4 Year-over-Year Sales Trends (fig. 2.2.2)
- Winner: Mid/North Beach reports highest year-over-year growth, with more than double the sales (127%) compared to Q4 2018
- Up: South Beach (67%), Surfside & Bal Harbour (33%), Brickell (29%), Fisher Island (17%), and Greater Downtown Miami (15%) too report sales increases
- Flat: Edgewater, Coral Gables & Coconut Grove record the same level of sales as Q4 2018
- Down: Only Sunny Isles Beach posts a (4%) decline in year-over-year sales
More details available in the dedicated reports for Greater Downtown Miami, Miami Beach and the Barrier Islands, plus Coral Gables & Coconut Grove.
Miami Luxury Condo Neighborhood 2019 Year-over-Year Sales Comparison - Fig. 2.2.1
Miami Luxury Condo Neighborhood 4Q19-over-4Q18 Sales Comparison - Fig. 2.2.2
Overall Luxury Condo Prices Up - Sales Price, Price/Square Foot
Annual sales price increases, while price per sq. ft. drops to $757/sq. ft. Moving in opposite directions, the median sale price increased 2.3% compared to 2018, while the price per sq. ft. fell 2.7% (fig. 1.1). This difference in trends could be due to increased sales of larger luxury condos, so even as they commanded higher prices, the median price per sq. ft. got discounted for spreading thinly over the sheer size of the unit.
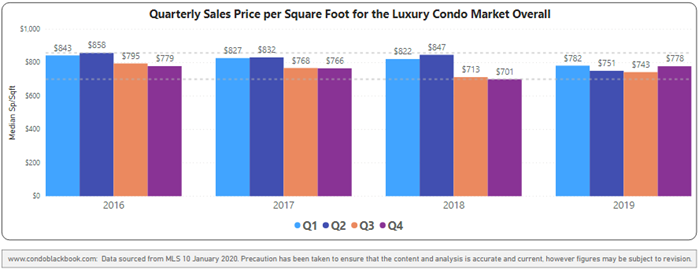
Q4 sales price and price per sq. ft. increase year-over-year. Both the median sale price and price per sq. ft. reported a year-over-year increase this fourth quarter. The median price went up 10.8%, while the price per sq. ft. increased by 11.1% (fig. 1.2). Looking at a four-year snapshot of quarterly prices per sq. ft. (fig. 3.1), it is also worth noting that Q4 2019 closed with a mid-range median of $778/sq. ft.
Quarterly price per sq. ft. 2016-2019 - Fig. 3.1
Neighborhood Trends - Sales Price, Price/Square Foot
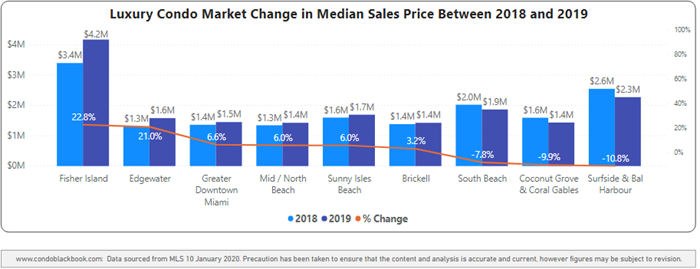
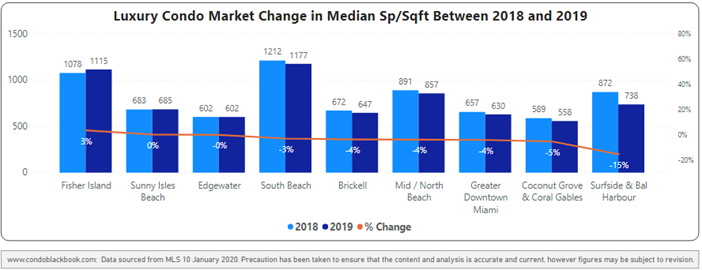
Annual 2018-2019 Price Trends (fig. 3.2.1 and 3.3.1)
- Winner: South Beach remains the most expensive with a median price of $1,177/sq. ft.
- Winner: Fisher Island reports the highest percentage growth in sales price (22.8%) as well as price per sq. ft. (3.0%) compared to 2018
- Up: Other neighborhoods reporting an increase in sales price - Edgewater (21%), Greater Downtown Miami (6.6%), Mid/North Beach (6.0%), Sunny Isles Beach (6.0%), Brickell (3.2%)
- Flat: Sunny Isles Beach and Edgewater report the same price per sq. ft. as 2018
- Down: Only South Beach (-7.8%), Coral Gables & Coconut Grove (-9.9%), plus Surfside & Bal Harbour (-10.8%) report a drop in median prices
- Down: Neighborhoods reporting a drop in price per sq. ft. - South Beach (-3.0%), Brickell (-4.0%), Mid/North Beach (-4.0%), Greater Downtown Miami (-4.0%), Coral Gables & Coconut Grove (-5.0%), Surfside & Bal Harbour (-15.0%)
Neighborhood Year-over-year Median sales price comparison - Fig. 3.2.1
Neighborhood Year-over-year Median price per sq. ft. comparison - Fig. 3.3.1
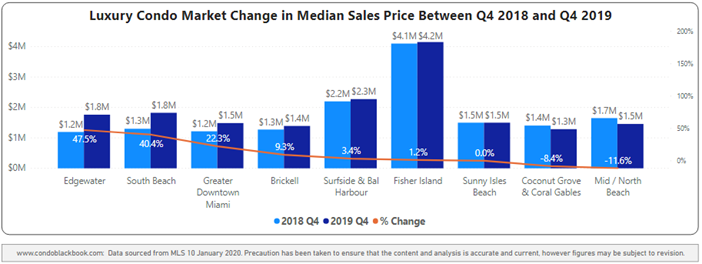
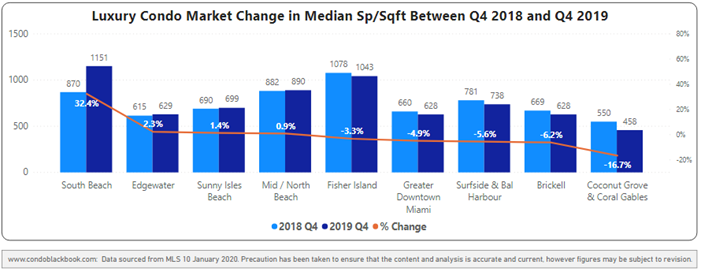
Q4 Year-over-Year Price Trends (fig. 3.2.2 and 3.3.2)
Sales Price
- Winner: Excluding Fisher Island, Sunny Isles reported the highest median sales price of $2.3 million, up from $2.2 million for the same quarter last year
- Winner: Edgewater reports the highest percentage growth in sale price (47.5%)
- Up: Other neighborhoods posting an increase in year-over-year prices – South Beach (40.4%), Greater Downtown Miami (22.3%), Brickell (9.3%), Surfside & Bal Harbour (3.4%), Fisher Island (1.2%)
- Flat: Sunny Isles Beach posts same median sales price as last year
- Down: Only Coral Gables & Coconut Grove (-8.4%) and Mid/North Beach (-11.6%) record a dip in year-over-year prices
Price per Square Foot
- Winner: South Beach has the highest median price per sq. ft. of $1,151 and the highest percentage increase in price per sq. ft. (32.4%) year-over-year
- Up: Neighborhoods reporting an increase in year-over-year price per sq. ft. - Edgewater (2.3%), Sunny Isles Beach (1.4%), Mid/North Beach (0.9%)
- Down: Neighborhoods reporting a drop in year-over-year price per sq. ft. – Fisher Island (-3.3%), Greater Downtown Miami (-4.9%), Surfside & Bal Harbour (-5.6%), Brickell (-6.2%), Coral Gables & Coconut Grove (-16.7%)
Neighborhood 4Q19-over-4Q18 median price comparison - Fig. 3.2.2
Neighborhood 4Q19-over-4Q18 median price per sq. ft. comparison - Fig. 3.3.2
Sales Price Trends by Building Year - Miami Market Overall
Below is a detailed analysis of how prices added up on the basis of age of construction for luxury condos in Miami, categorized as new construction (2015-2019), 2000-2014, and pre-2000.
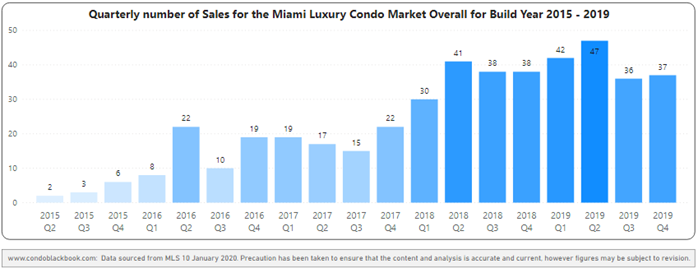
BUILDINGS BUILT: 2015-2019
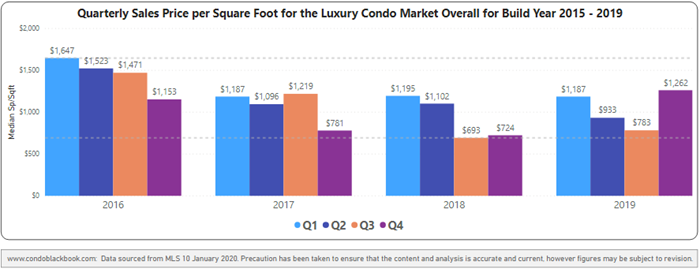
Q4 sales matched previous year numbers in this newly-built segment (fig. 3.4). Also, the aggregate sales for 2019 (162) hovered close to 2018's 159 sales. However, the median price per sq. ft. almost doubled from $724 in Q4 2018 to $1,262 in Q4 2019 (fig. 3.5). What's also worth noting is that this is the highest price per sq. ft. in a fourth quarter since 2016.
Overall sales heatmap for buildings dated 2015-2019 - Fig. 3.4
Overall price per sq. ft. for buildings dated 2015-2019 - Fig. 3.5
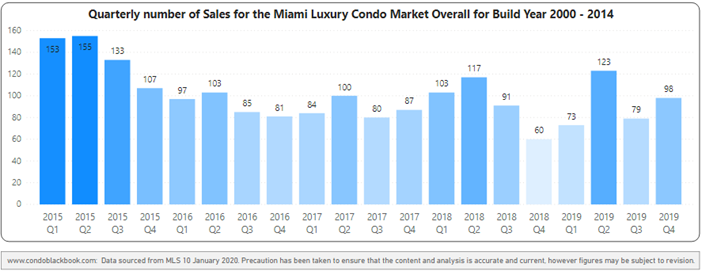
BUILDINGS BUILT: 2000-2014
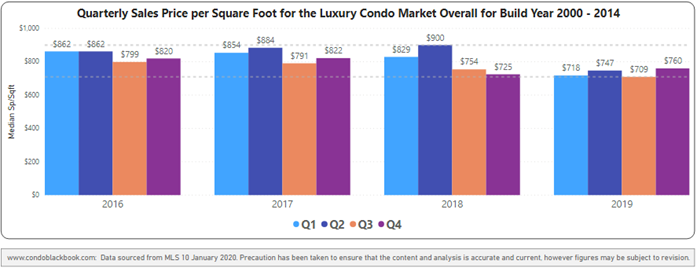
A surge in demand for the segment took Q4 sales (98) soaring past the previous year's 60 sales (fig. 3.6). However, the aggregate sales for 2019 (373) hovered close to 2018's 371 sales. Nonetheless, the popularity of this segment not only increased the price per sq. ft. from $725 in Q4 2018 to $760 in Q4 2019, but also made it trend at the highest level for the year (fig. 3.7).
Overall sales heatmap for buildings dated 2000-2014 - Fig. 3.6
Overall price per sq. ft. for buildings dated 2000-2014 - Fig. 3.7
BUILDINGS BUILT BEFORE YEAR 2000
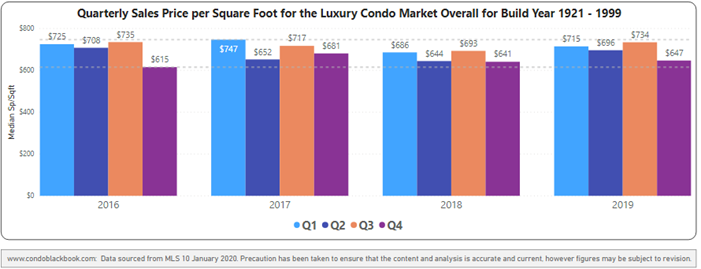
Q419 sales posted slight year-over-year increases in this seasoned segment (fig. 3.8), where those looking for mid-century modern or architecturally significant condos often buy. Also, the aggregate sales for 2019 (171) hovered close to 2018's 172 sales. Still, the price per sq. ft. closed at $647, trending at the lowest of all quarters in 2019 (fig. 3.9), indicating it may be a good time to buy into some of Miami's glamorous older condo buildings.
Overall sales heatmap for buildings dated 1921-1999 - Fig. 3.8
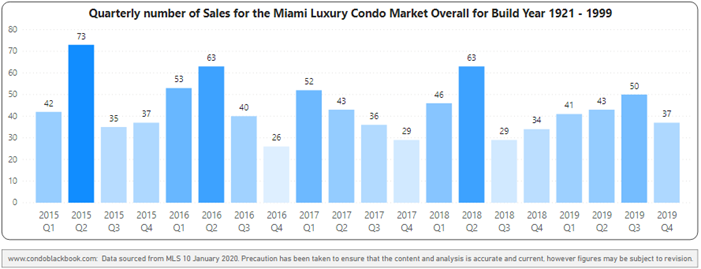
Overall price per sq. ft. for buildings dated 1921-1999 - Fig. 3.9
Overall Days on Market Increase
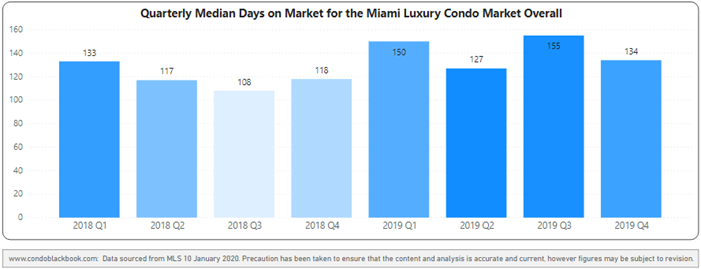
Days on market increased across all quarters compared to 2018. With the metric trending higher against all quarters in 2018, luxury condos sat 21 days longer on the market (on a median basis) in 2019 (fig. 1.1 & 4.1). Looking into the year-over-year change for Q4, luxury condos spent 16 more days on the market on a median basis (fig. 1.2). A higher days on market generally indicates that buyers and sellers took longer to come to a consensus, which in 2019, trended throughout the year.
Miami Overall Quarterly Days on Market 2018 - 2019 Heatmap - Fig. 4.1
Neighborhood Trends - Days on Market
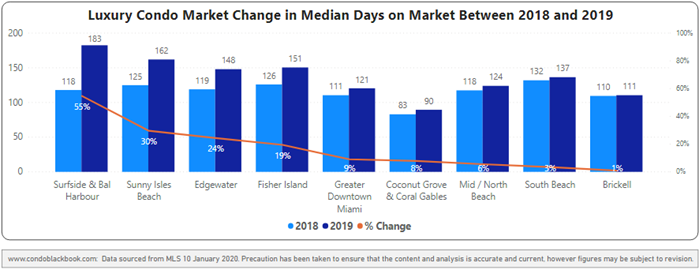
Annual 2018-2019 Days on Market Trends (fig. 4.2.1)
- The combined district of Surfside & Bal Harbour reported the highest percentage increase (55%) in days on market
- All other neighborhoods report an increase in days on market as well – Sunny Isles (30%), Edgewater (24%), Fisher Island (19%), Greater Downtown Miami (9%), Coral Gables & Coconut Grove (8%), Mid/North Beach (6%), South Beach (3%), Brickell (1%)
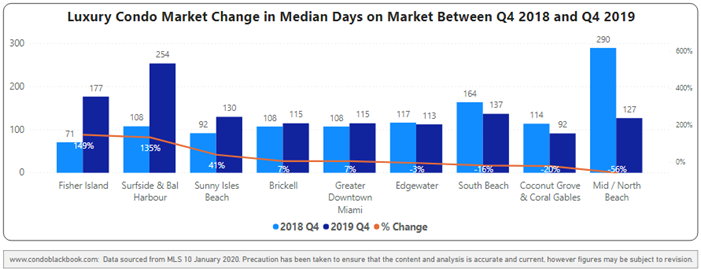
Q4 Year-over-Year Days on Market Trends (fig. 4.2.2)
- In what is a positive improvement, Edgewater (-3%), South Beach (-16%), Coral Gables & Coconut Grove (-20%), Mid/North Beach (-56%) all reported declines on days on market
- Neighborhoods with slight increases included Sunny Isles Beach (41%), Brickell (7%), Greater Downtown Miami (7%)
- Fisher Island reported a threefold (149%) increase in days on market, while Surfside & Bal Harbour condos also remained for sale longer in 2019 (135%)
Neighborhood Year-over-year Days on Market Comparison - Fig. 4.2.1
Neighborhood 4Q19-over-4Q18 Days on Market Comparison - Fig. 4.2.2
High Inventory Keeps Market Buyer-friendly
Inventory closes year with 44 months' surplus. Inventory followed its historic pattern of trending higher during the winter months, as the quarter and December closed with 44 months of inventory (figure 5.1). Even though inventory fell from November's 47 months, it was higher than September's 37. This puts buyers at a great advantage, since a balanced market carries only 9-12 months of inventory. With ample time and choices at their disposal, buyers should make the most of this favorable market.
Months of inventory from Mar. 2017 to Dec. 2019 - Fig. 5.1
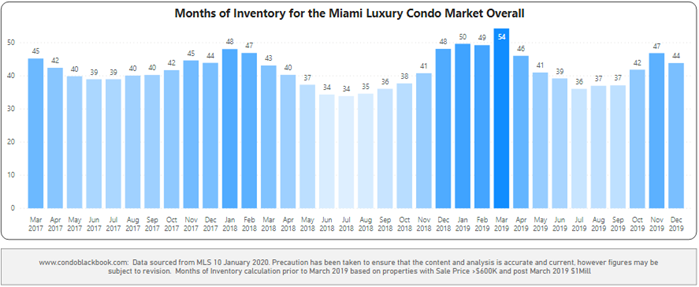
A balanced market has only 9-12 months of inventory. The months of inventory are calculated as – no. of active listings + no. of pending listings divided by the average number of deals in the last 6 months.
*Starting March 2019, we have only considered properties priced $1 million and upwards for our luxury condo study, instead of the previous $600K benchmark. This means, that while our historical data compares to condos priced $600K and higher, post March 2019, the numbers represent properties priced $1 million and higher only.
For an exact break-down of how inventory sits in each neighborhood, see our reports for Greater Downtown Miami, Miami Beach and the Barrier Islands, or Coral Gables & Coconut Grove.
Conclusion
Outlook is positive for 2020, with 2019 ending as a buyer's market. Even though the luxury condo market has largely favored buyers over the past couple of years, and inventory remained high at year end, 2020 still has quite a few factors working in its favor. For one, the market will be in a low cycle of deliveries, meaning most of Miami's new construction luxury condo product has already been delivered and only a handful of new projects will join the ranks this year. Secondly, sales picked up pace during the last two quarters of 2019, which generally tend to be slow, showing some significant growth in buyer interest.
Moving into the new year, if sales continue to grow at their current pace with only a slight increase in inventory, 2020 could finally see the shift sellers have been waiting for. Until then, buyers can enjoy the favorable mix of trends and continue leading negotiations for the best deals possible.
Luxury Market Predictions and Analysis: Where Does the Market Go From Here?
In our opinion, the following factors could turn out to be real game-changers, paving the way for a market bounce in 2020:
- With these tax-savings available to Miami residents, high-tax states could keep pushing new prospects our way
- With prices dropping for luxury condos built before 2000, buyers could find the motivation they need to get off the fence and make a purchase
- Inventory could continue to drop with fewer pre-construction deliveries scheduled this year, as well as deep-pocketed sellers taking their condos off the market until a more balanced position is reached
- Lower mortgage rates could act as the perfect nudge for more buyers to take the plunge
Love what you see? Don't forget to share our blog and subscribe (see the subscribe link on the top menu) to receive the latest market news in your inbox.
Have any questions? Or see something wrong with the stats? Please contact Sep at sniakan (at) hbroswell.com or call 305-725-0566.
Share your thoughts with us

Your Miami Condo Awaits
Recent Posts


 (305) 697-7667
 (786) 321-7233
  contact@condoblackbook.com

