Luxury Miami Condo Report : August 2017

Sep 23, 2017 September 23, 2017
Miami Luxury Condo Report Overall Market Summary
City and Neighborhood Luxury Condo Reports
Miami Beach Luxury Condo Report
South Beach Luxury Condo Report
Bal Harbour Luxury Condo Report
Sunny Isles Beach Luxury Condo Report
Greater Downtown Miami Luxury Condo Report
Edgewater / Midtown / A&E District Luxury Condo Report
Coconut Grove Luxury Condo Report
Coral Gables Luxury Condo Report
Miami Luxury Condo Market Report: Summary back to top
The uptick enjoyed by Miami’s luxury condo market in recent months seems to have come to a standstill this August. While the overall market reported very sluggish sales, only the beach enjoyed decent sales. Read our in-depth report to know how far the ripple effect of sluggish sales made its impact.
Only condos priced $600,000 and above have been considered for the purposes of this luxury market report.
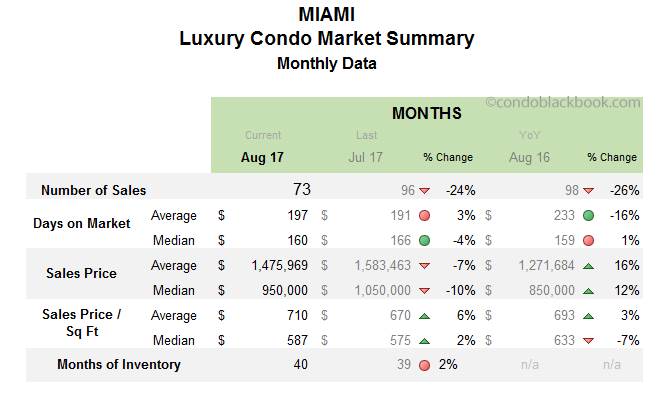
Overall Market Highlights:
- Overall monthly sales down 24%, drop year-over-year too and generally indicative of typical August behavior
- Slower sales leave 12-month sales trend line on a small uptick, with only the Edgewater and Coral Gables reporting a negative
- Biggest losers last month, turn up with biggest sales in August - Miami Beach (20%), South Beach ( 46%) and Mid-Beach (40%)
- Overall average days on market increase, indicating possible change of trends
- Median sales prices decrease 10%, though price/sq ft continues ascent
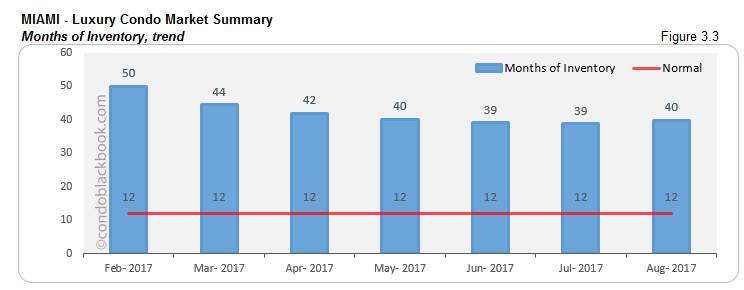
- Months of inventory increase first time in six months (negative trend for market, see fig. 3.3)
- Market largely in favor of buyers with higher inventory and days on market, recent price drop could motivate buyers
An expected sales slowdown. Barring Miami Beach, South Beach and Mid-Beach, almost every neighborhood in our study reports a decline in sales numbers. However, this shouldn't be cause for alarm, since July and August are generally slower months.
August represents the peak of the summer season and heat, and thus, a low season for real estate. With the mercury rising, it is but natural to experience a sales slowdown this time of year. However, it is not unusual for European buyers on vacation and those south of the equator (i.e., Argentinians and Brazilians) to come shopping (for homes) to Miami. (We've seen a lot of Turkish buyers as of late, which is a newer phenomenon). Perhaps that’s the reason, why sales on the beach have still been able to keep their head up.
Also, with a great sales run these past few months, a breather was due.
Days on market rear up their head again. Miami’s luxury condo market has enjoyed a good run of sales over the past couple of months. However, July and August’s seasonal adjustment ended up making a visible impact on the days on market, pushing trends up overall (fig. 2.1) and for most neighborhoods in our study.
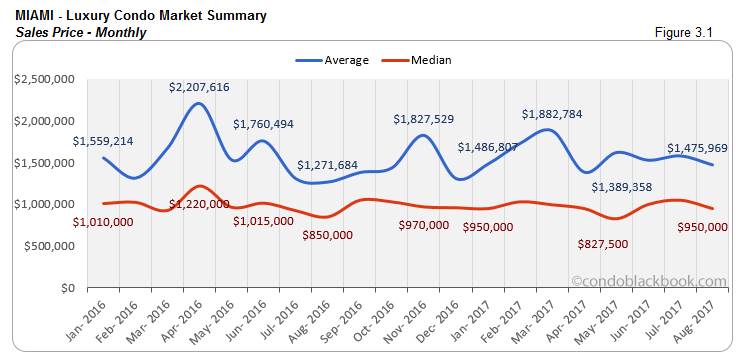
Prices undecided. On one hand, we have a strong buyer’s market pushing down on prices. On the other, we have ultra-luxury sales (over $3 million) in neighborhoods like Bal Harbour and Brickell pushing numbers up. This could be one of the reasons we’re seeing a bit of inconsistency in the overall prices (fig. 3.1 and 3.2). However, buyers still have the time to take advantage of the market and turn around prices in their favor.
Inventory leaps up for first time in six months. Since March, we had grown accustomed to see months of inventory decline consistently (fig. 3.3). However, the luxury market’s sluggishness finally overtook metrics, posting a 2% increase in inventory this month. This is the first time inventory has gone up since March. It's not out of the question that these numbers will improve as we head into the high season. With hurricane Irma’s impact on the market still pending, we’ll be keeping a close watch on where this trend is headed.
If the market does not pick up significant pace in the following months, sellers will have to rethink their strategy and come up with new ways to evoke buyer motivation. However, if anyone was looking to buy their first home, vacation condo or simply upgrade to a better space in Miami, NOW is a good time!
Where Does the Market Go From Here? back to top
In previous reports, we’ve discussed in-depth how a strengthening U.S. dollar, strong stock market, the 2016 Zika scare, shaky start to the presidency and a desire for tax breaks by the wealthy have been holding back sales numbers and brought the condo market to favor buyers. However, if we want to move out of this rut, the following corrections are suggested, if not absolutely necessary:
- Downward adjustment of prices. This one is clearly in the hands of the sellers. If increasing prices to match boom time market rates is common sense, so is vice versa. Sellers will need to reconsider their budgets and see if they can offer buyers any kind of discounts as incentive. With ample inventory on the market, it is always recommended to adjust pricing or have a unique product in order to gain an edge in a highly competitive market like ours.
- Tax breaks for the wealthy. If the Republican-controlled government comes through on its expectations for tax breaks, the luxury market surely stands to gain.
- Weakening US dollar. Fact is, our friends down south have always been the biggest shoppers of condos in Miami. With the dollar going down against certain currencies, such as the Colombian Peso and Brazilian Real, we can expect to gain back a major chunk of our foreign buyers.
- Sellers retreat. For those who are not willing to sell their properties at lower prices, there is another option. Patience! Getting your property off the market till the time it regains its balance will be better for those who are hoping to gain big from their sales.
In addition, Miami’s real estate should also start bracing for hurricane Irma’s aftermath. With cancelled flights and shocking sights trending on social media sites, a loss of buyer confidence/interest is but natural. This impact will likely show up in October’s numbers, but I suspect that those memories will be short-lived and the allure of Miami's sunny and warm winters will prevail.
Below is an insight into Miami’s overall and neighborhood-level luxury condo trends for August 2017:
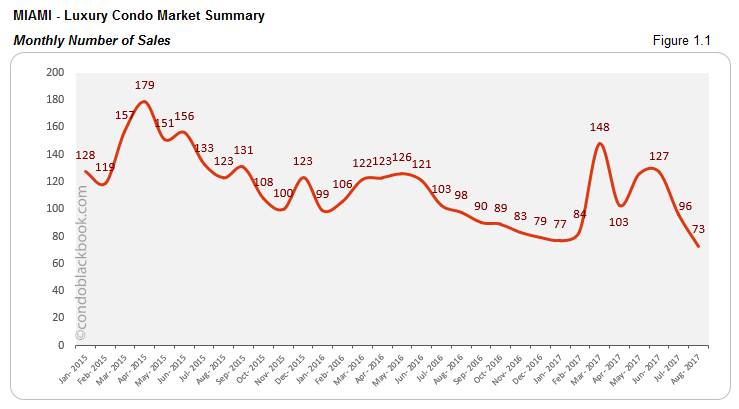
Monthly Number of Sales - Miami Luxury Condo Market Overall back to top
- Slow August curve hits sales. After months of sales action, Miami’s luxury condo market seems to be slamming on the brakes. Historically, July and August are slower months, so this comes as no surprise. But we are slower historically as well. August’s overall sales were 24% lower than July and 26% lower than last year (fig. 1.1).
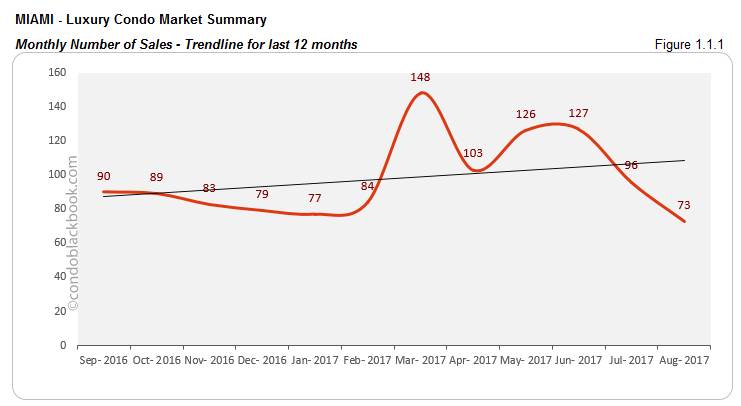
- Yearly trend still positive. Though there has hardly been any follow through of big numbers after March’s sales spike, the trend line for the last 12 months still looks positive (fig. 1.1.1). This means that even with the last two months of decreasing sales, the signs of recovery are still there. However, with hurricane Irma hitting our shores in September, it’s quite possible that we could have to wait until November for sales to pick up pace.
Days on Market - Miami Luxury Condo Market Overall back to top
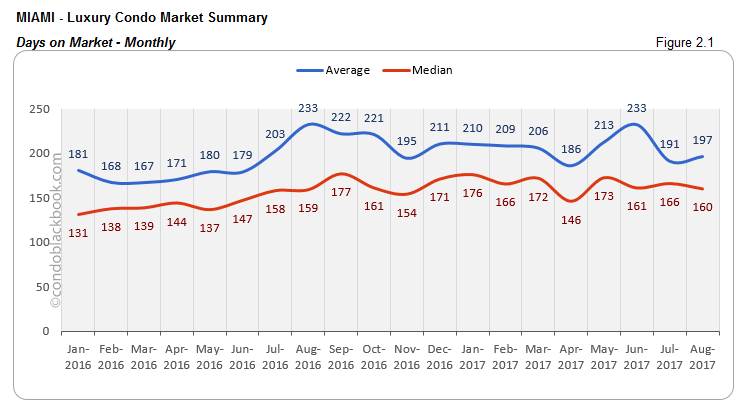
“Days on market” are the total number of days from when a property is active to the day it goes under contract.
- Days on market start crawling back up. The sales momentum gained in the previous months seems to be losing its touch, and August too had less than mediocre sales to report. Both of these have the average days on market move up 3% month-on-month, while the median still held its ground with a 4% drop (fig. 2.1). Considering hurricane Irma’s impact, it is quite possible that the days on market will continue their upward trend through September (at least).
Sales Price Trends - Miami Luxury Condo Market Overall back to top
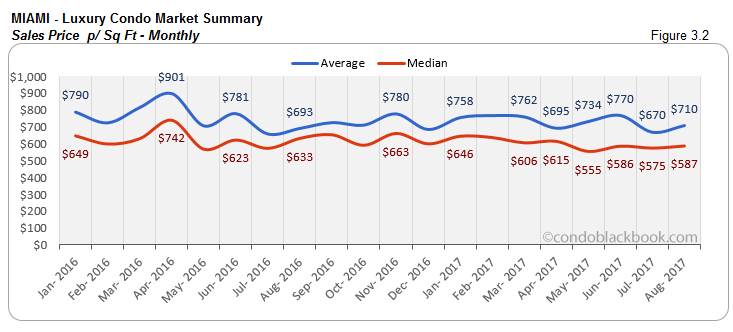
- Median sales price adjusts -10%, though price per sq ft hovers higher. These past two months, luxury condo prices have been trying to climb back up. But, considering we are in a strong buyer’s market, the trend seemed out of place. Perhaps that is why we see the overall luxury condo sales price medians drop 10% (fig. 3.1). The price per sq. ft. is yet to follow suit, as the median jumped 2% since July to settle at $587 per sq ft. However, this is still 7% lower than last year’s $633 per sq ft (fig. 3.2).
Inventory Trends - Miami Luxury Condo Market Overall back to top
A balanced market will only have 9-12 months of inventory.
- 40 months of inventory. August saw 3.8k active luxury condo listings on the market overall, with another 189 pending. Considering inventory moves at an average (last 6 months) of 100 deals a month, there are still 40 months of inventory to get through.
- Inventory goes up first time in six months; buyers have the pick of the litter. With March’s sales momentum running out of juice, we see the months of inventory increase for the first time in six months (fig. 3.3). August posts a 2% increase in the overall trend. We’ll be keeping a close eye on this, but so far it looks like the good streak we’ve enjoyed over the past couple of months is now coming to a halt for now. (At least for whole Miami, let’s see what happens in each neighborhood.)
City and Neighborhood Market Reports back to top
Miami Beach Luxury Condo Market Summary back to top
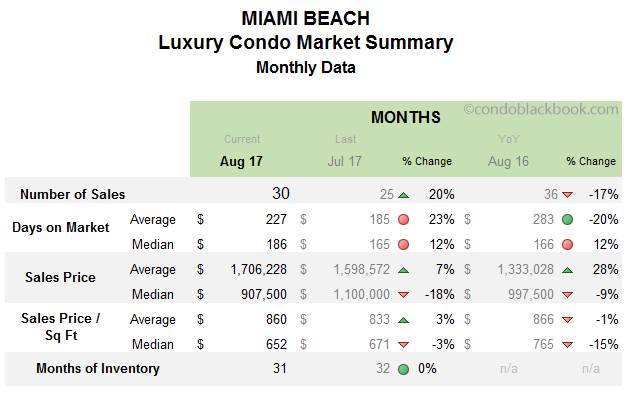
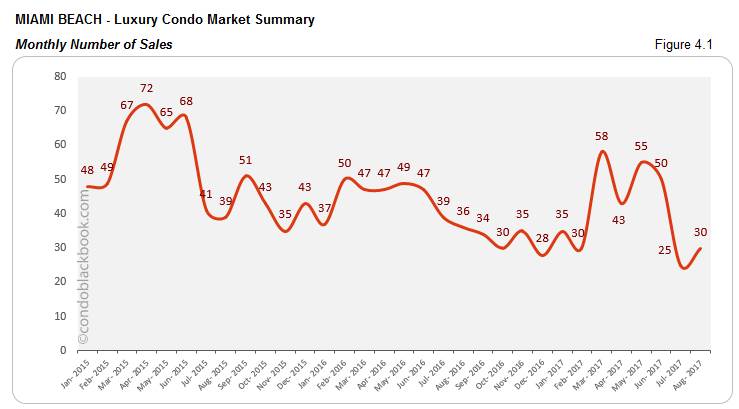
- 20% increase in sales. Sales in August have not been great overall (see fig. 1.1). However, Miami Beach has managed to escape this downward spiral (if only by a margin, see fig. 4.1) by posting a 20% increase in sales volume. Still, compared to last year, the beach comes up 17% short.
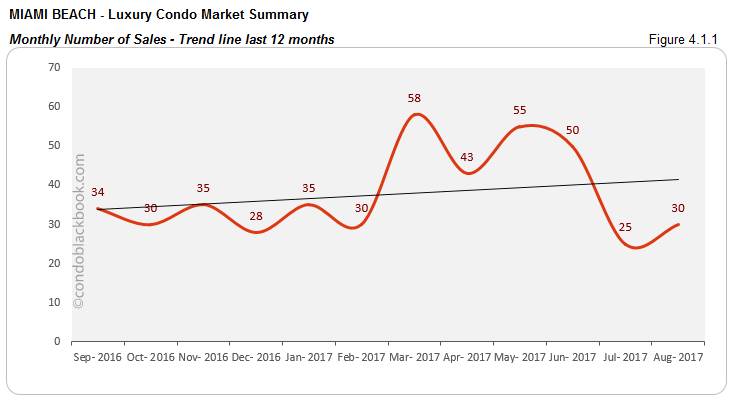
- Sales trend remains positive. If we glance over at the sales trend line for the last 12 months in fig. 4.1.1, it shows an uptick. This points to the fact that since July and August are usually slow months, maybe the market is just taking a break before picking up pace. However, unfortunately, there’s also hurricane Irma’s aftermath that needs to be considered, which could end up slowing the market recovery.
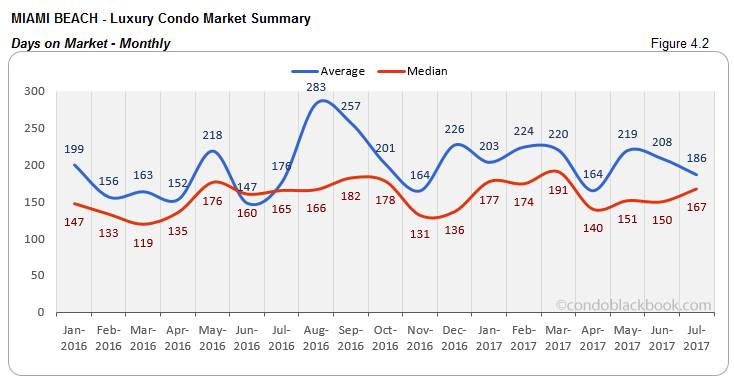
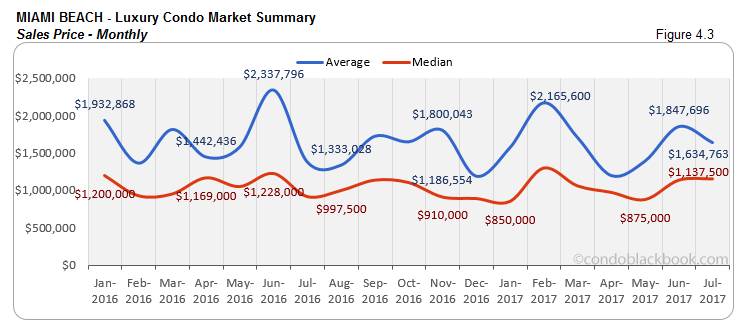
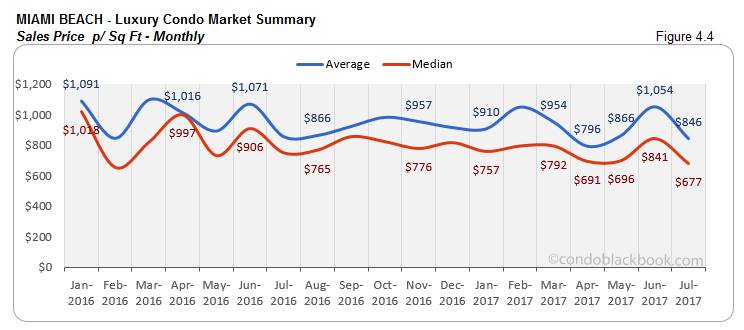
- Days on market increase, while median prices decline. The sales momentum from March has finally run out, as we see a 12% increase in the median days on market (fig. 4.2). With not much of a (sales) respite expected in September either, we expect to see the days on market continue to increase for luxury condos in Miami Beach. On the other hand, both the median price (fig. 4.2) and price per sq ft (fig. 4.3) have posted a decrease, bringing down the median price in Miami Beach below a million and the price per sq ft to $652.
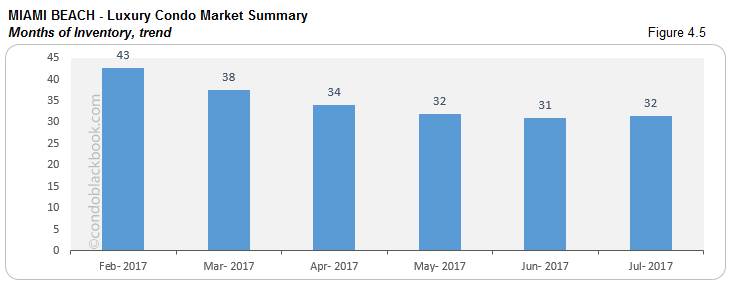
- 31 months of inventory, market still favors buyers. Miami Beach reported 1159 active listings for August, with another 65 pending. Considering inventory moves at an average (last 6 months) pace of 39 deals a month, there are still 31 months of inventory to get through. This is way higher than the 9-12 months of a balanced market (fig. 4.5). Since inventory has been dropping at snail’s pace, buyers can use this to their advantage. With plenty of choices on the market and a buyer-friendly mood, we suggest prospective buyers to look at Miami Beach condos for sale here.
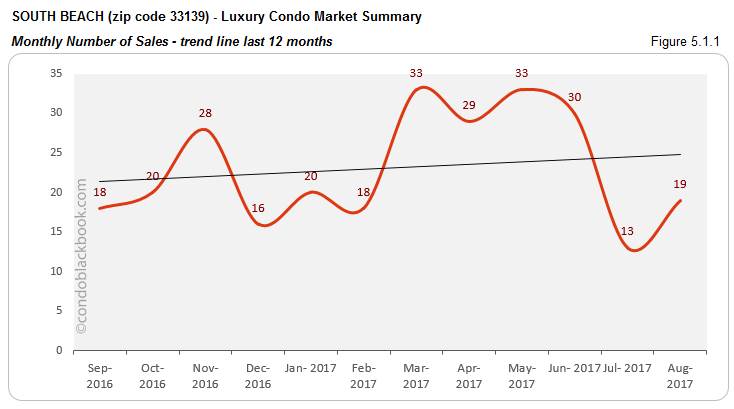
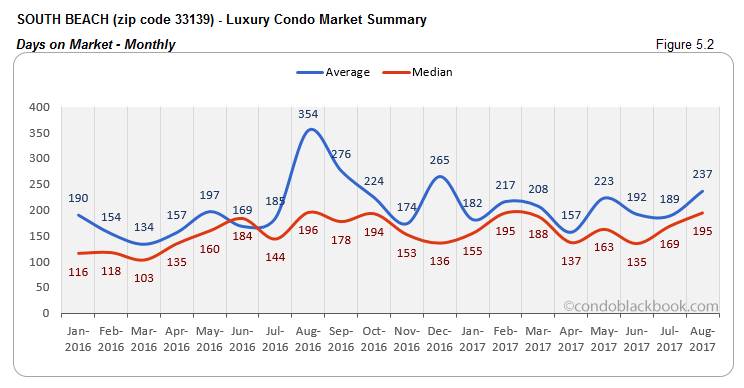
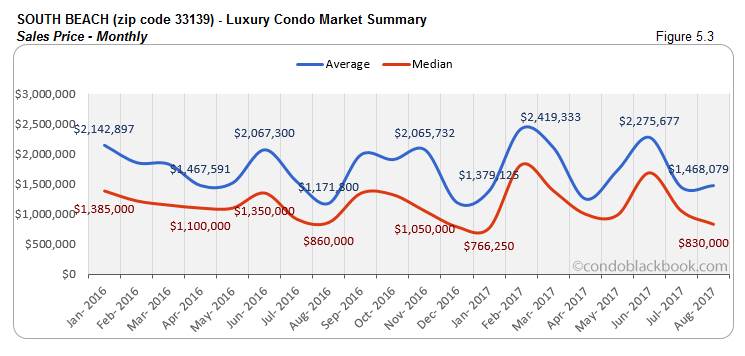
South Beach Luxury Condo Market Summary (33139 zip) back to top
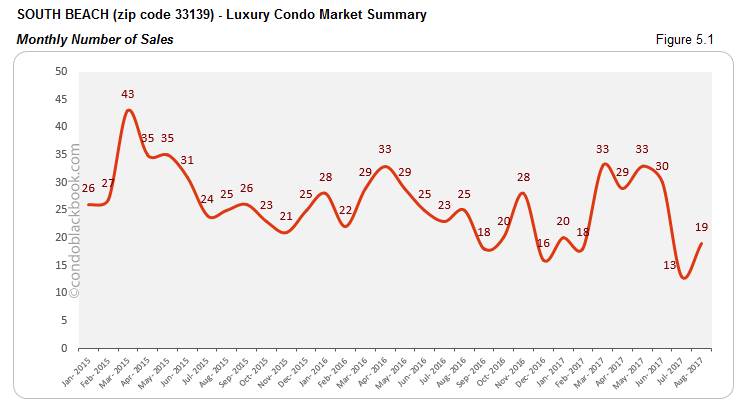
- 46% uptick in sales, trend line stays positive. We see South Beach going against the overall sales trend (fig. 1.1) and posting a 46% increase this August. Though, looking at last year’s numbers, there is a drop of 24% (fig. 5.1). However, when we follow the trend line for the last 12 months (fig. 5.1.1), it’s easy to see this vacationer’s paradise has managed to retain a positive sales streak for the past one year.
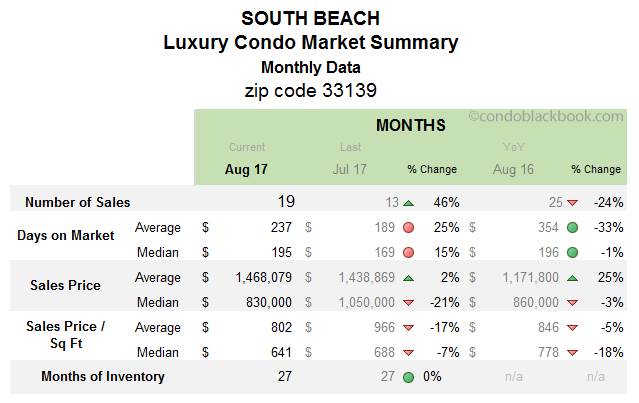
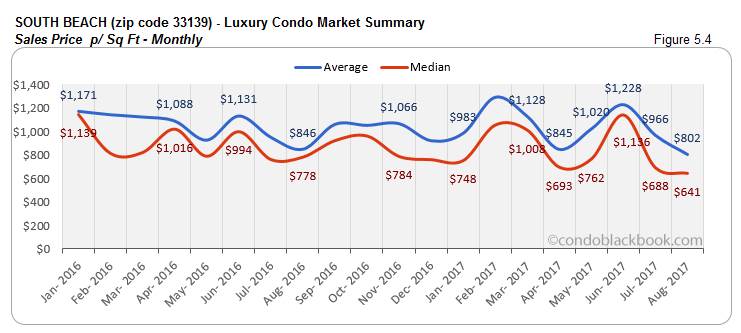
- Days on market inch up with lower prices. We have both the average and median days on market increase in South Beach, despite sales going up and prices dropping down. While the average days are up 25%, the median is up by 15% (fig. 5.2). Giving buyers some incentive is the drop in prices. While the median sales price is down 21% from July (fig. 5.3), the median price per sq ft has come down 7% to settle at $641/sq ft in South Beach’s luxury condo market (fig. 5.4).
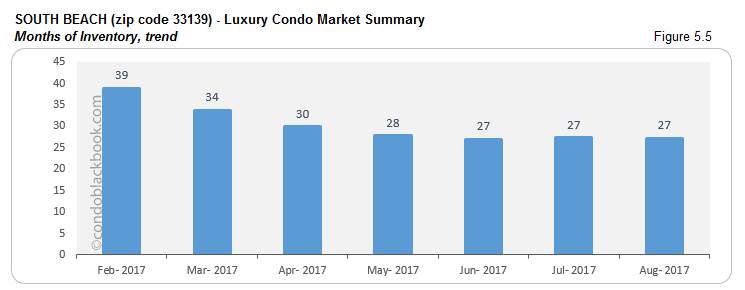
- Static months of inventory to boost buyer motivation. August had 630 active luxury condo listings in South Beach, with another 25 pending. Considering inventory moves at an average (last 6 months) of 24 deals a month, there are still 27 months of inventory pending on the market. This is higher than the 9-12 months of a normal market and the figure hasn’t budged since last month (fig. 5.5). This gives buyers a lot of leverage, since having the upper hand in negotiations is a definite plus as you go shopping for South Beach condos for sale here, or check out this beach paradise here.
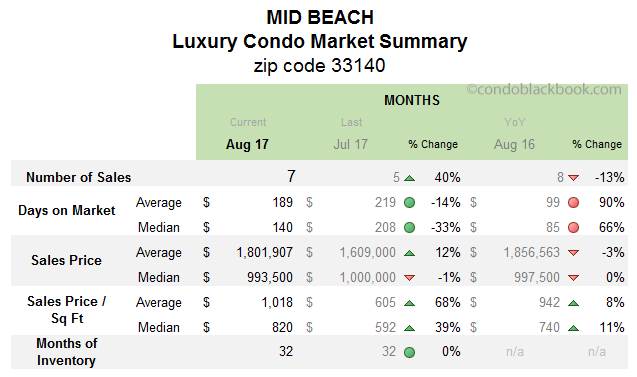
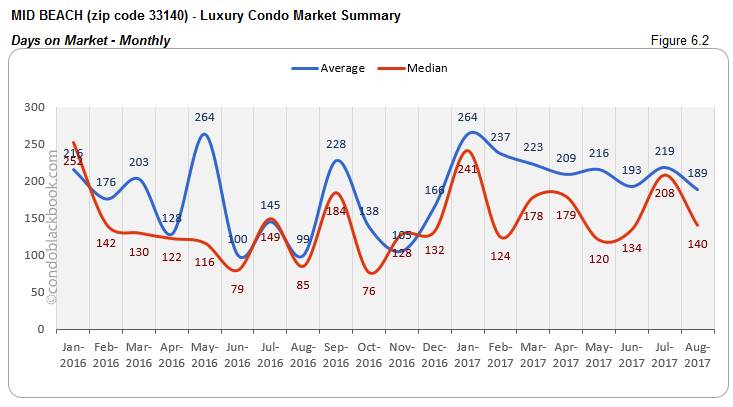
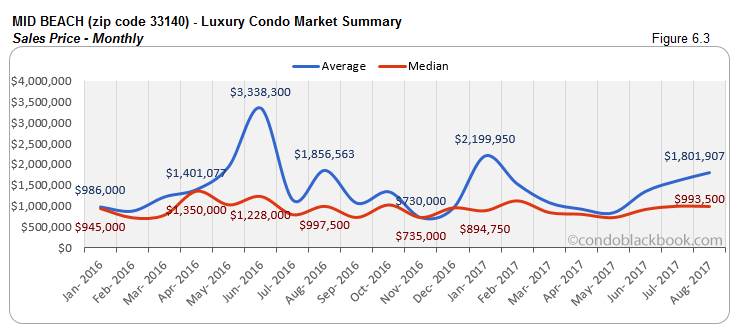
Mid-Beach Luxury Condo Market Summary (33140 zip) back to top
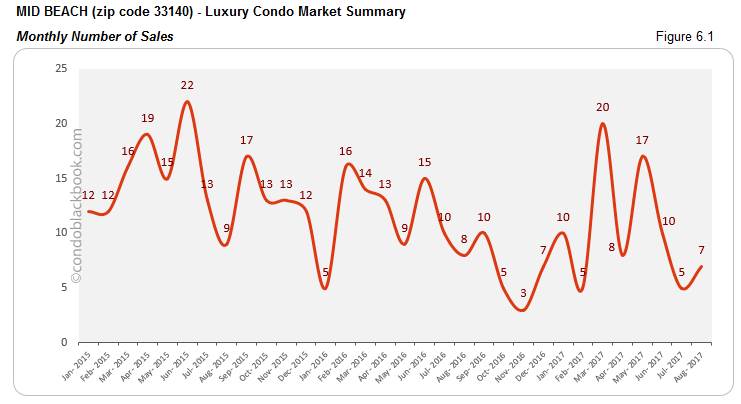
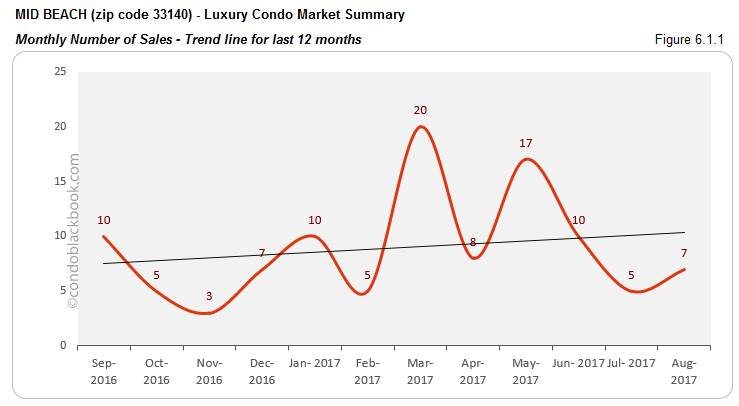
- Sales up 40%, 12-month trend too stays positive. Moving against market odds (fig. 1.1), the luxury condo market in Mid-Beach has reported a 40% increase in monthly sales. However, this is still 13% lower than last year’s numbers (fig. 6.1). But, as we trace sales over the last 12 months (fig. 6.1.1), the trend reveals an upward shift meaning Mid-Beach has been making real progress. Hopefully this positive streak is retained long enough to get the market back into balance.
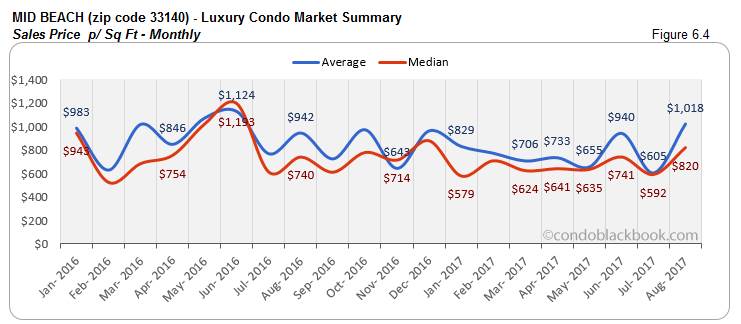
- Days on market reduce significantly, while prices inflate. Again, in contrast with overall trends (fig. 2.1), we see the median days on market drop by a good 33% in this chic neighborhood. On the other hand, the median price per sq ft goes up 39% to reach $820/sq ft (fig. 6.4). This is because last month’s ultra-luxury sales along with August’s $9.6 million sale (listed for $11.4 million) pushed prices up.
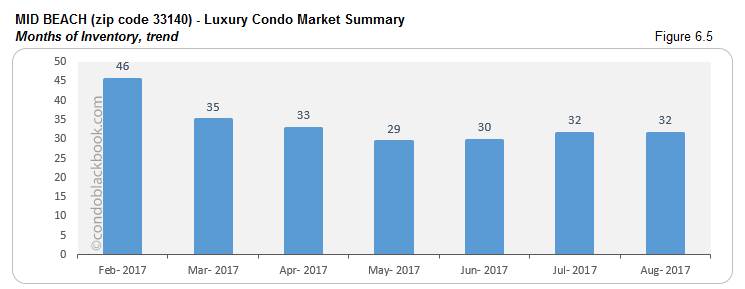
- Stagnant months of inventory add to buyer confidence. Mid-Beach had 271 active condo listings in August, with another 19 pending. Considering inventory moves at an average (last 6 months) pace of 9 deals a month, there are still 32 months of inventory to get through. This is way off the 9-12 months mark of a balanced market. Just 4 months ago the neighborhood was sitting with 29 months of inventory (fig. 6.5). Buyers definitely have an edge here as inventory seems to be moving out at snail’s pace. This is the right time to search Mid-Beach condos on sale here or take a tour around the neighborhood here.
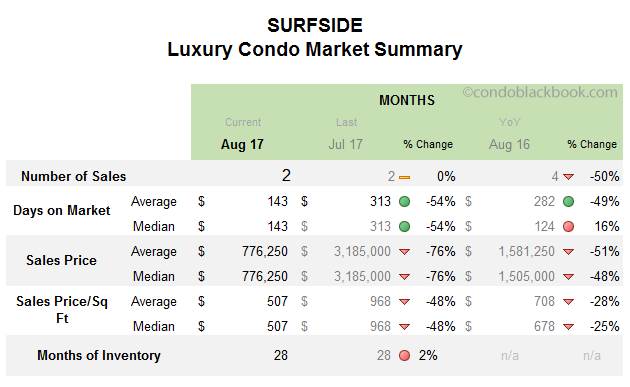
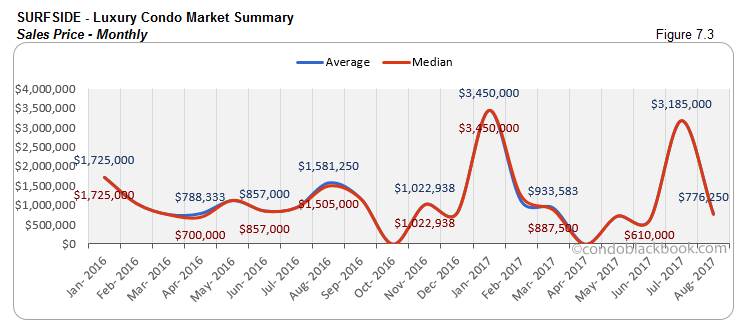
Surfside Luxury Condo Market Summary back to top
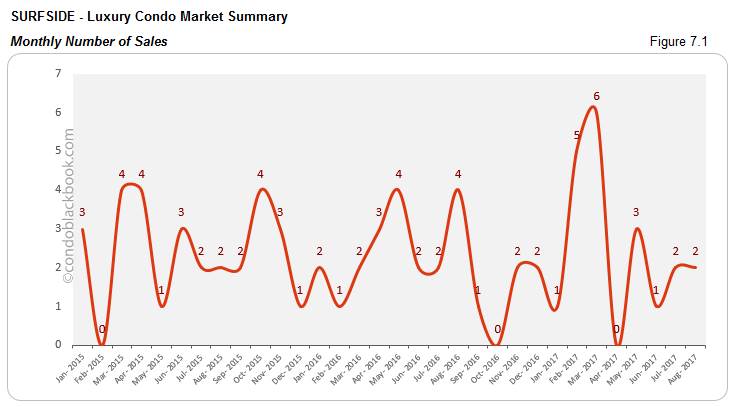
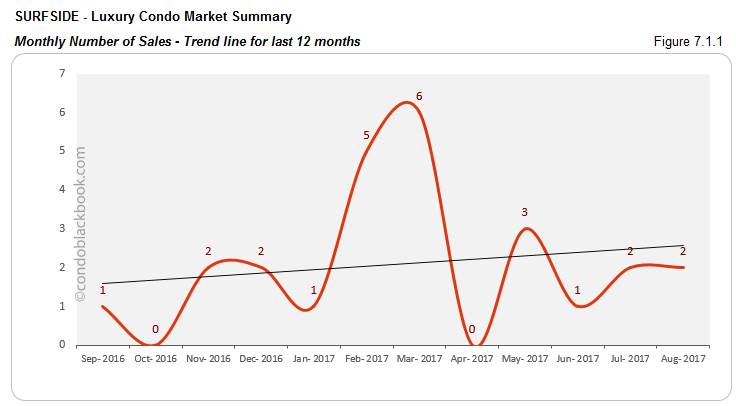
- Sales hardly reflective of market, trend line positive. Surfside’s luxury condo market is quite modest, so maintaining 2 sales a month wasn’t quite difficult for this seaside community (fig. 7.1). As we look into last year’s numbers, there is a whopping 50% drop in numbers to report. However, following the sales trend line in fig. 7.1.1, we notice that even though sales in Surfside have been highly volatile this last year, real progress has still been made.
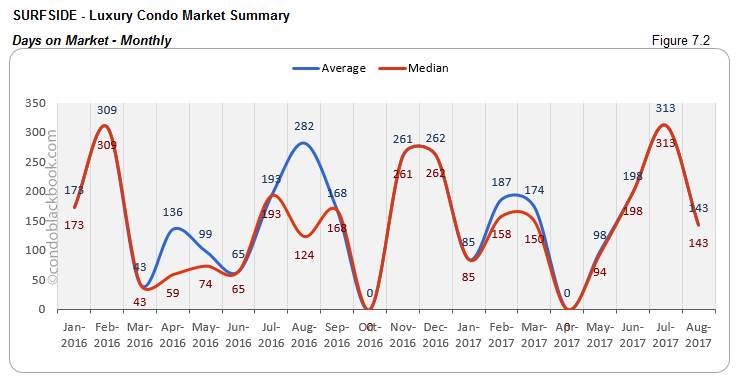
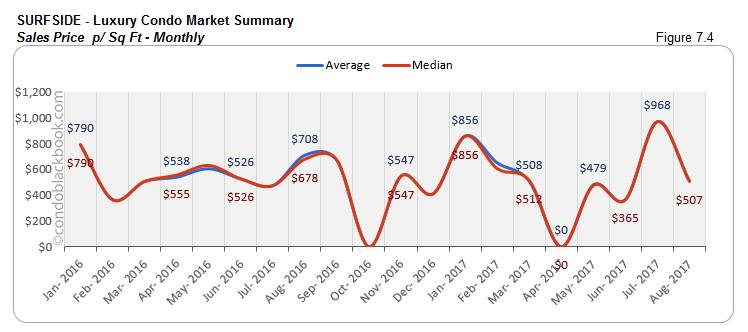
- July’s expensive sale skewed metrics. Considering Surfside is a small market for luxury condos, a single ultra-luxury sale can make a huge impact. We can see the ripple effect of July’s expensive sales with prices adjusting back this August (fig. 7.3 and 7.4). The median price deflated down 76%, while the price per sq ft has come down by 48% to $507 per sq ft.
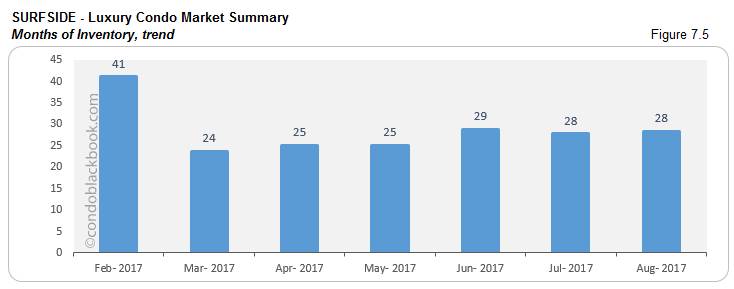
- Months of inventory stagnate, giving buyers upper hand. August had 61 active luxury condo listings in this coastal neighborhood, with another 5 pending. Considering inventory here moves at an average (last 6 months) of 2 deals a month, this beach community still has 28 months of pending inventory (fig. 7.5). This is way higher than the 9-12 months of a normal market and March’s 24 months. With ample choices at hand, buyers can easily dictate negotiations. Search a Surfside condo for sale here, or see what lifestyle makes up the chic community of Surfside.
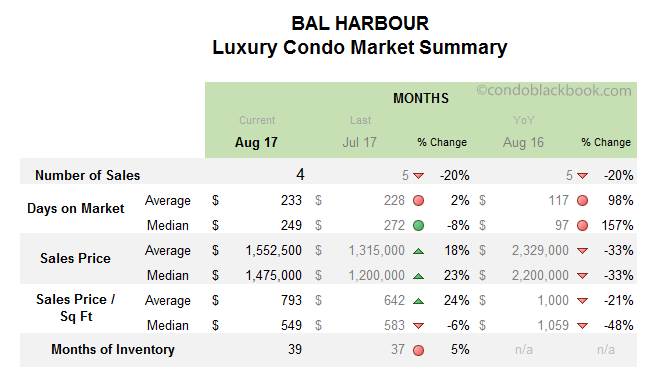
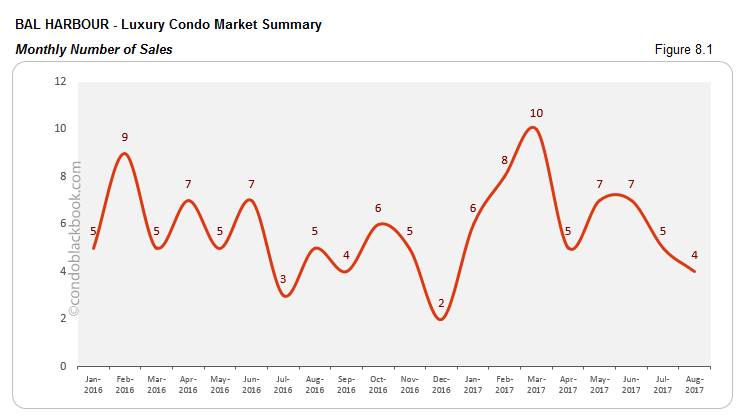
Bal Harbour Luxury Condo Market Summary back to top
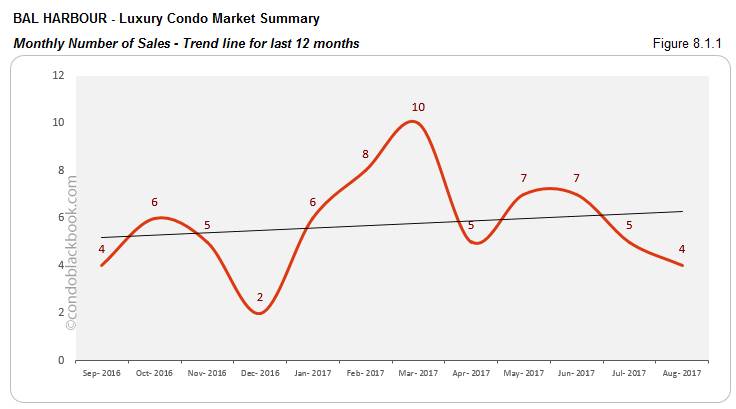
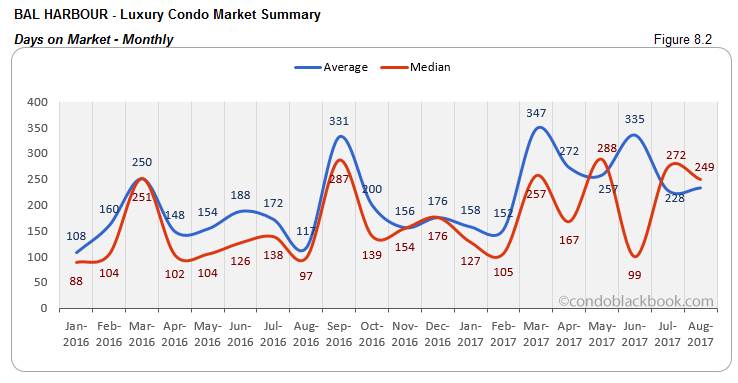
- Sales drop, but no reason for alarm as trend stays positive. Bal Harbour is another small market for luxury condos. This August, the upscale neighborhood registers a 20% drop in month-on-month plus year-over-year sales. However, looking closely (fig. 8.1) it’s just a difference of a single sale, which is anyhow expected of a sleepy real estate market in August. The good news is that Bal Harbour has been able to maintain a positive sales streak (fig. 8.1.1), despite quite a few ups and downs. This means progress is being made and recovery is definitely in the cards.
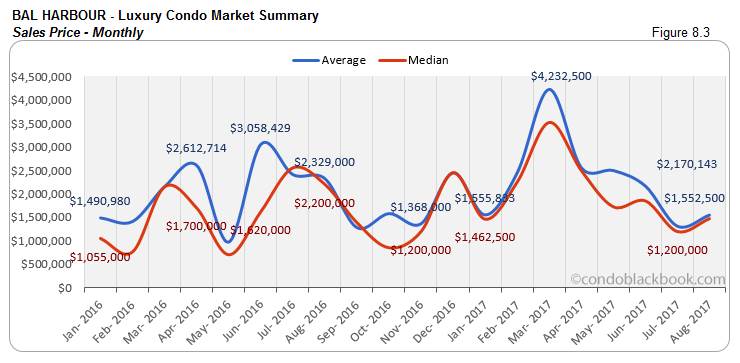
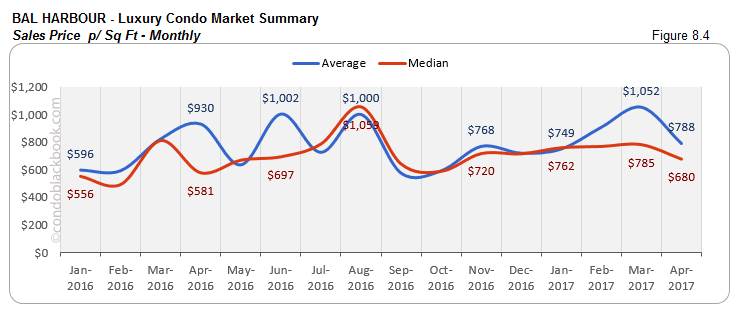
- The highest median sales prices in Miami. Bal Harbour might be a small luxury condo market, but it sure is significant. It boasts of one of the highest median sales prices in our study. This is because even though it has few sales, most of them are ultra-luxury, hovering around the $5 million price mark. The median price in Bal Harbour is currently at $1,475,000 (fig. 8.3), while the median price per sq ft is $549 (fig. 8.4).
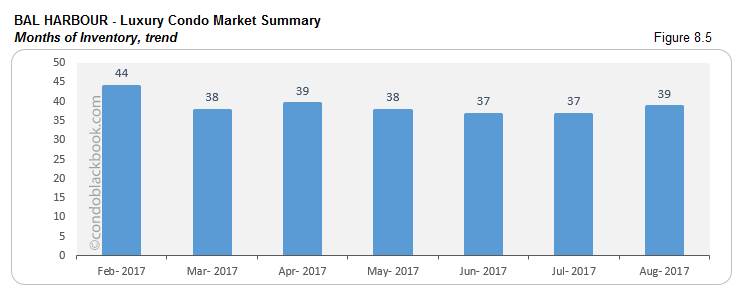
- Higher months of inventory, buyers should cash in. Bal Harbour had 215 active luxury condo listings in the market, plus another 13 pending in August. As inventory moves at an average (last 6 months) pace of 6 deals a month, there are now 39 months of inventory pending. This is way higher than the 9-12 months typical of a balanced market. Buyers can definitely cash in on the situation, as months of inventory post a 5% increase since July (fig. 8.5). Make the most of the market by searching Bal Harbour condos for sale here or, simply check out this upscale neighborhood first over here.
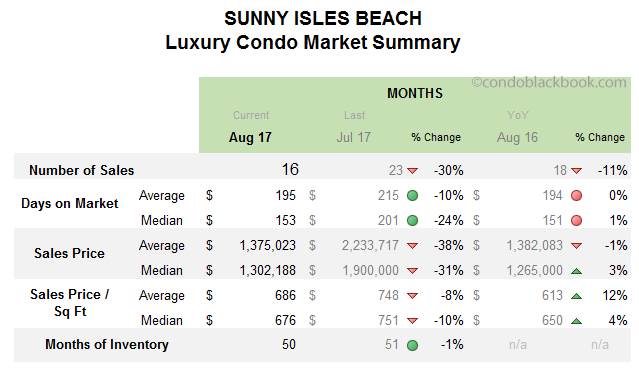
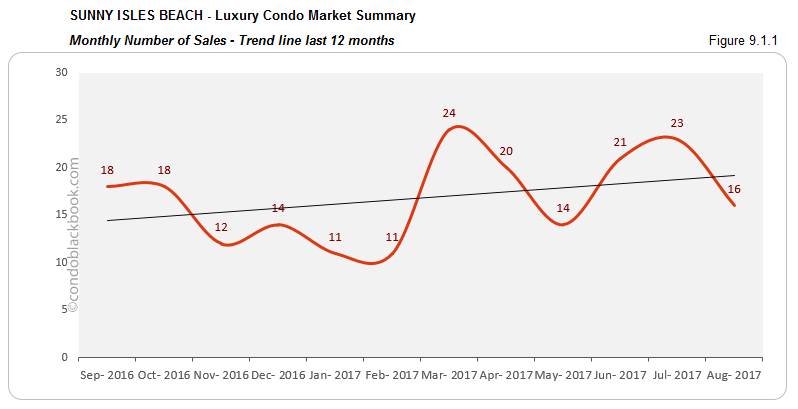
Sunny Isles Beach Luxury Condo Market Summary back to top
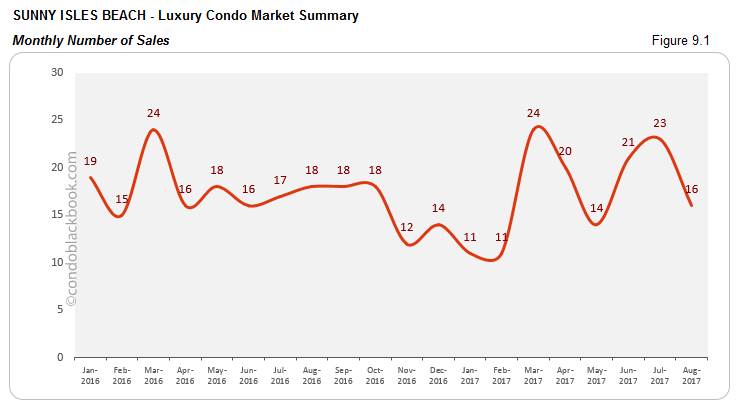
- Sales drop typical of August, but trend line stays up. After a good run these past few months, Sunny Isles Beach reports a 30% month-on-month drop and 11% year-over-year decline in sales (fig. 9.1). This isn’t something new, since August is usually a slow month for real estate in Miami. However, the good news is that the sales trend for this brand-friendly neighborhood has remained positive over the last one year (fig. 9.1.1).
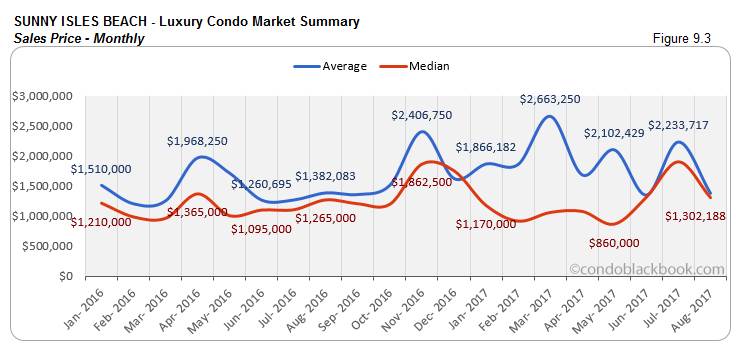
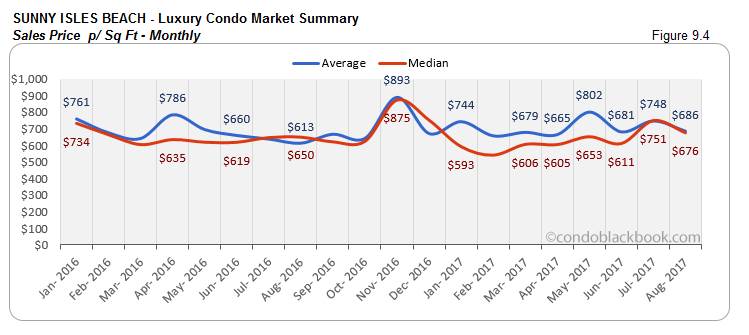
- Third highest median sales price in Miami. Slowly becoming the designer condo hub of Miami, Sunny Isles Beach now also boasts of some of the highest prices. Even after a 31% drop in prices, the median luxury sales price in this beach town is at $1,302,188 (fig. 9.3). This is due to a high number of ultra-luxury sales in the neighborhood, mostly above $3 million. The current price per sq ft in Sunny Isles Beach is $676 (fig. 9.4), 10% lower than July.
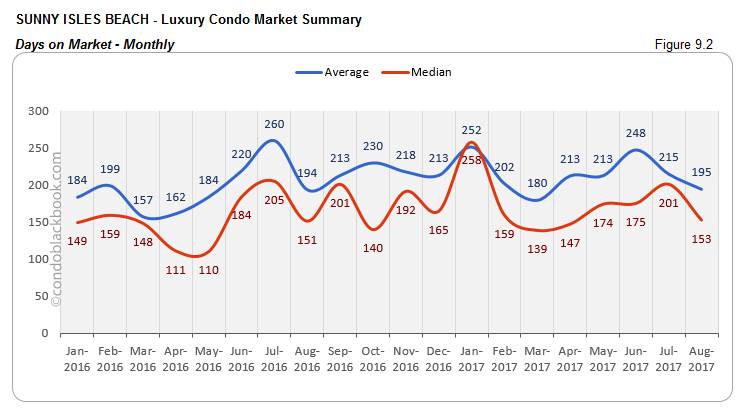
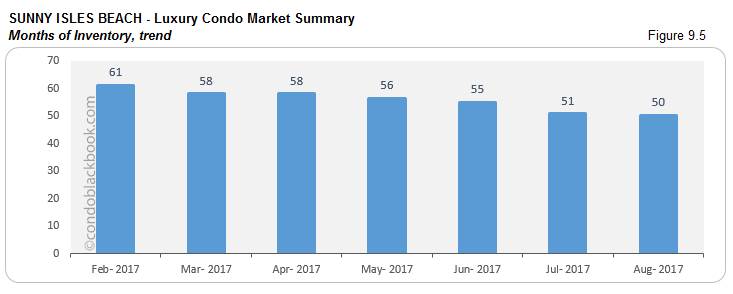
- Months of inventory increase, days on market still high. August saw 804 active luxury condo listings in Sunny Isles Beach, plus another 28 pending. As inventory moves at an average (last 6 months) pace of 17 deals a month, there are still 50 months of inventory on the market. Though inventory has decreased, it is now moving out at a much slower pace (fig. 9.5) and way off the 9-12 months normal. The median days on market are also lower by 24% month-on-month, but historically high (fig. 9.2). With such high levels of inventory moving at snail’s pace, buyers can use this to their advantage by searching Sunny Isles Beach condos for sale here, or explore the lifestyle first here.
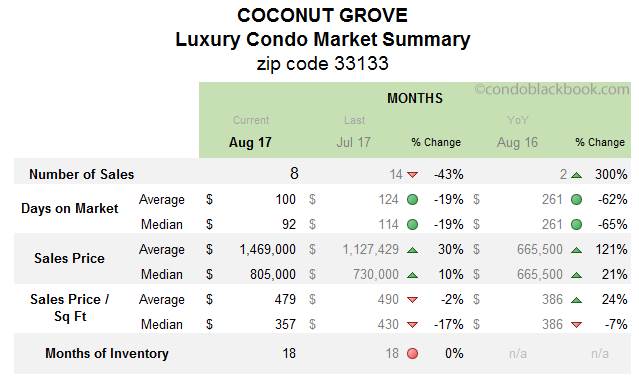
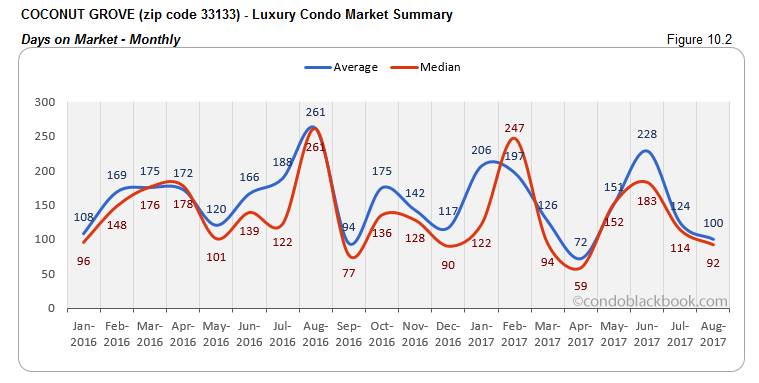
Coconut Grove Luxury Condo Market Summary (33133 zip) back to top
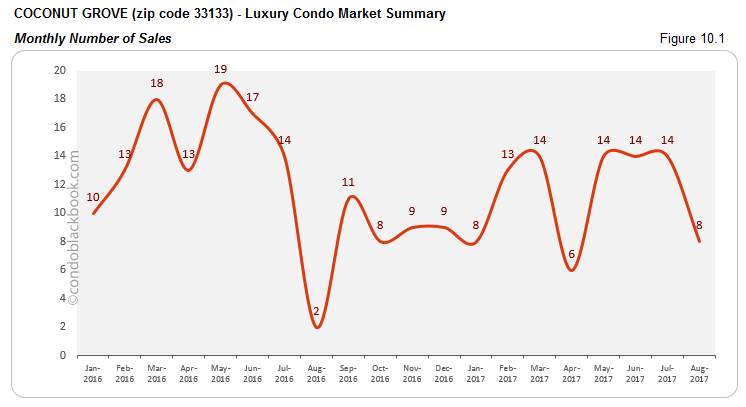
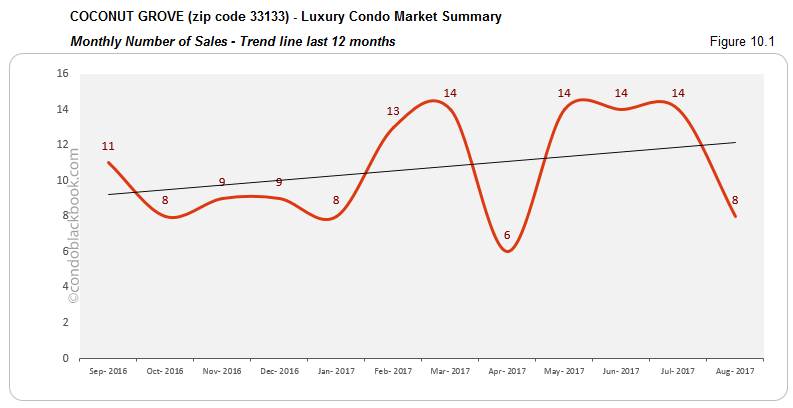
- Sales take a break after months of good numbers, but trend still positive. Even Coconut Grove couldn’t hold its ground in the face of August’s usual slowdown. There is a 43% decline in numbers (fig. 10.1), but this is still three times better than last year’s stats. Furthermore, looking at the sales trend for the past 12 months (fig. 10.1.1), Coconut Grove has been maintaining its progress with mostly positive sales.
- Previous momentum keeps days on market down. In spite of August’s cool-off, we see a 19% drop in the median days on market (fig. 10.2) for the partially coastal neighborhood. Hopefully upcoming months will be able to follow through and keep the trend positive here.
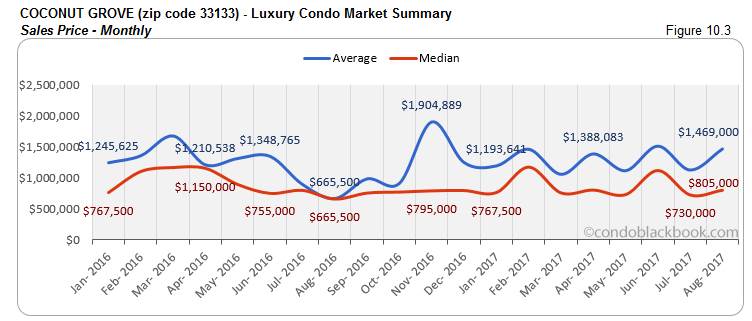
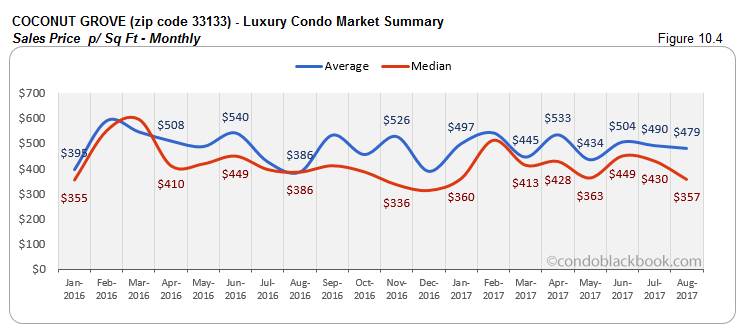
- Sales prices higher, but price per sq ft lower. It seems like the previous months’ positive response nudged median prices to move up 10% (fig. 10.3) in Coconut Grove. However, oddly, the median price per sq ft dropped 17%, touching $357/sq ft (fig. 10.4) in this vibrant neighborhood.
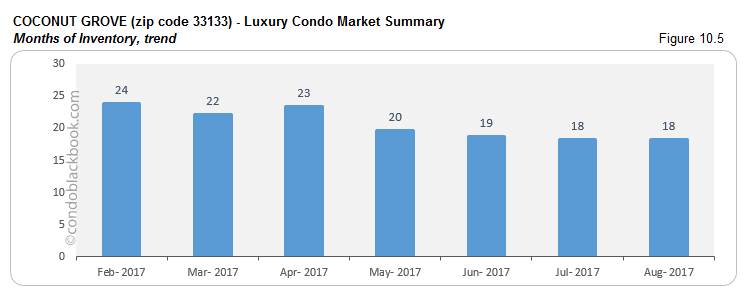
- Months of inventory closest to recovery. Coconut Grove reported 182 active luxury condo listings this August, with another 18 pending. Considering inventory moves at an average (last 6 months) pace of 11 deals a month, there are still 18 months of inventory left on the market. Even as inventory hasn’t budged since last month (fig. 10.5), it is still under 20. This has been the fastest selling market of our study, and the closest to reaching the 9-12 months of a balanced market. Nonetheless, buyers still have time to search Coconut Grove condos for sale here, or begin by exploring the neighborhood here.
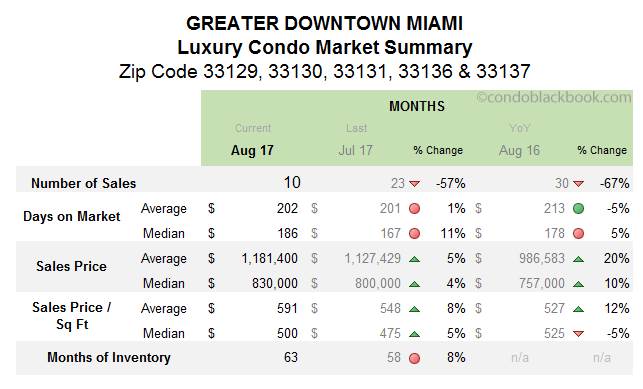
Greater Downtown Miami Luxury Condo Market Summary (33129, 33130, 33131, 33136, 33137 zips) back to top
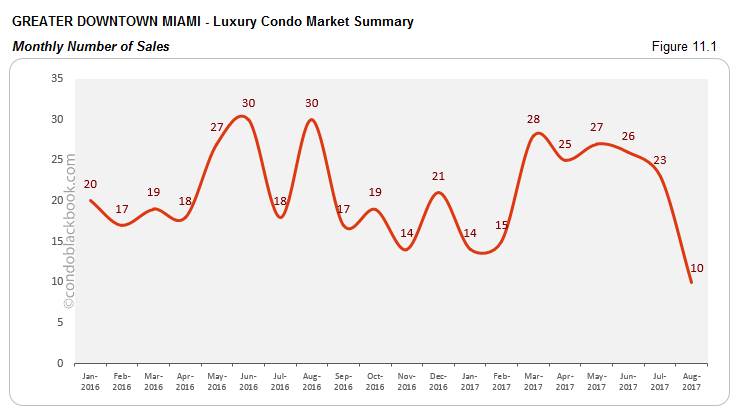
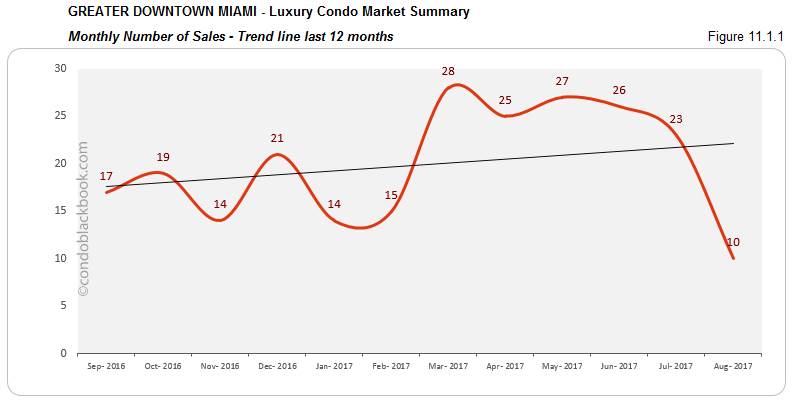
- Slower August causes steep decline in sales, but 12-month trend maintains positivity. The Greater Downtown Miami area reports a steep 57% decline in monthly sales this August (fig. 11.1). Even the year-over-year dropped 67%. It’s quite a sudden stop for the neighborhood, as it had been posting a row of good sales these past few months. But, this should not be taken as a disappointment, since such variations are typical for this time of year, and the trend line for the last 12 months (fig. 11.1.1) has been able to stay positive.
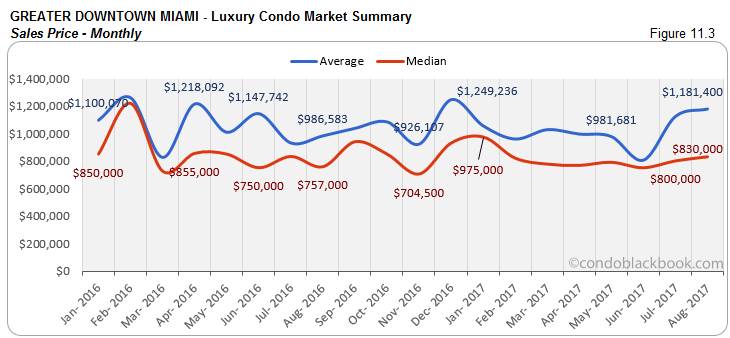
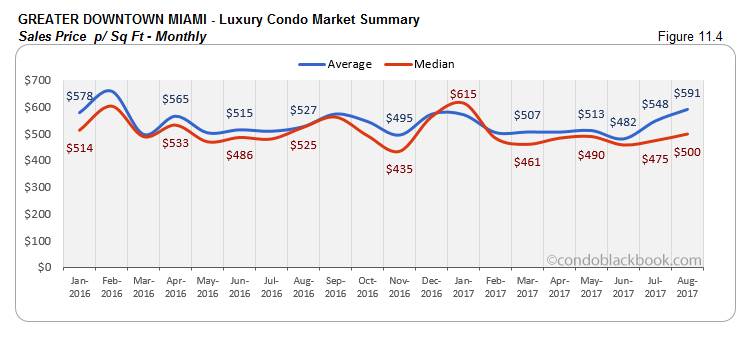
- Prices crawl up. It’s easy to see in fig. 11.3 and 11.4 that the prices are pushing up in spite of a buyer’s market. While the median sale price is 4% higher, the price per sq ft is 5% more than July, now at $500/sq ft. It’s also worth noting that the median sales price is 10% higher than August 2016.
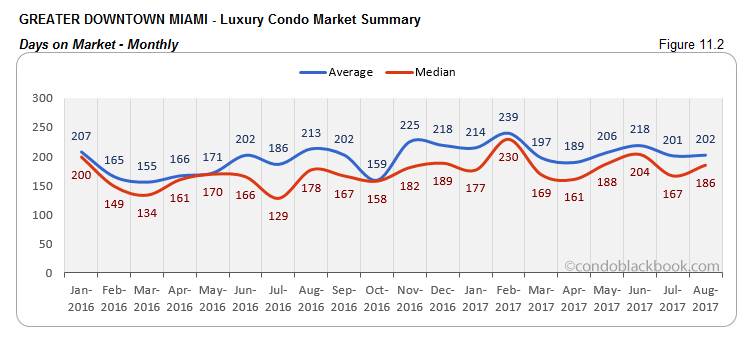
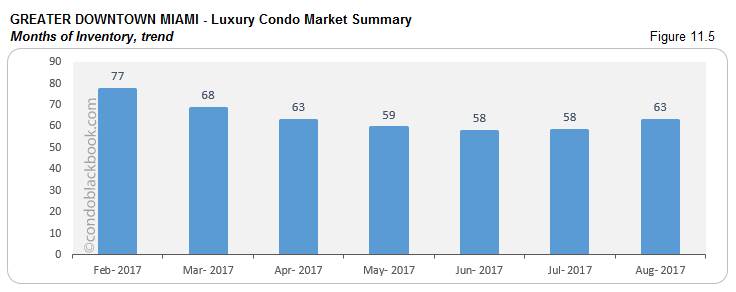
- Days on market and inventory climb up, giving buyers the edge. In fig. 11.2, we see the days on market increase 11%. Also, talking about inventory - August had 1233 active luxury condo listings on the market, plus another 42 pending. Considering inventory moves at an average (last 6 months) pace of 20 deals a month, Greater Downtown is still looking at 63 months of inventory to deal with. This is 8% higher than July (fig. 11.5) and the 9-12 months of a balanced market. With such a plethora of choices, buyers should be looking to grab the best deals by exploring the Greater Downtown Miami area here.
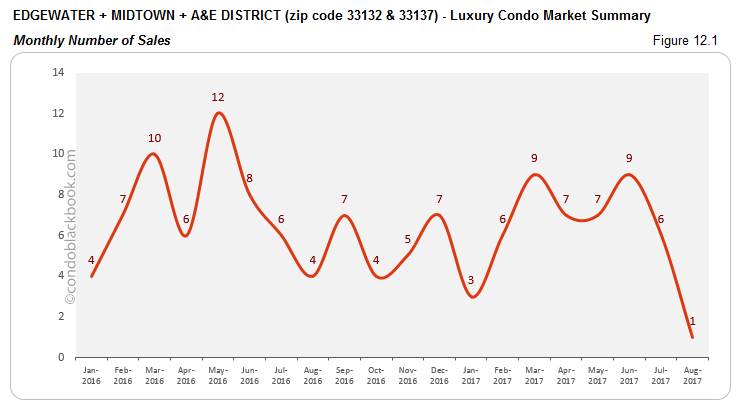
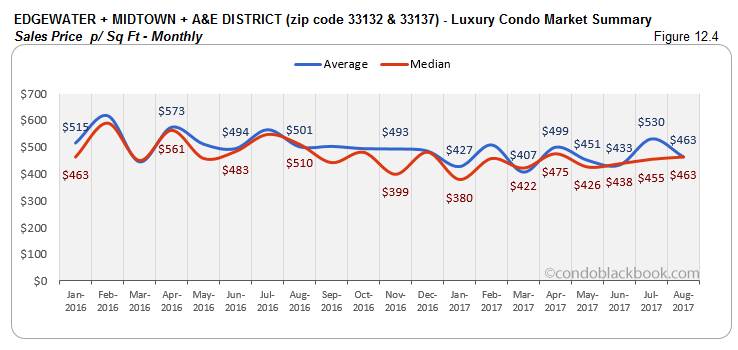
Edgewater + Midtown + A&E District Luxury Condo Market Summary (33132 + 33137 zip) back to top
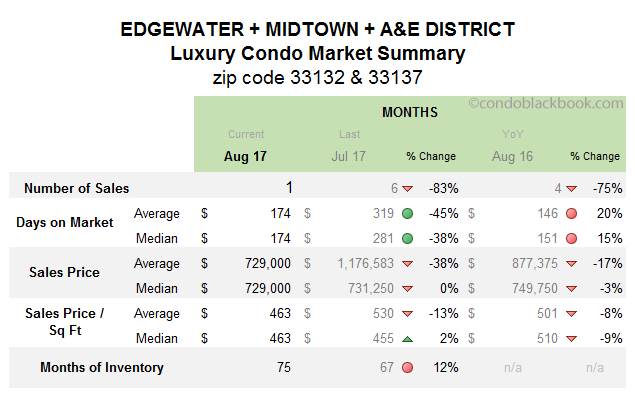
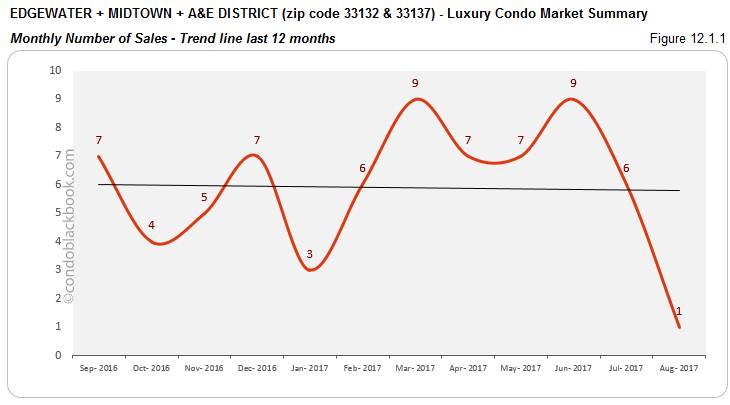
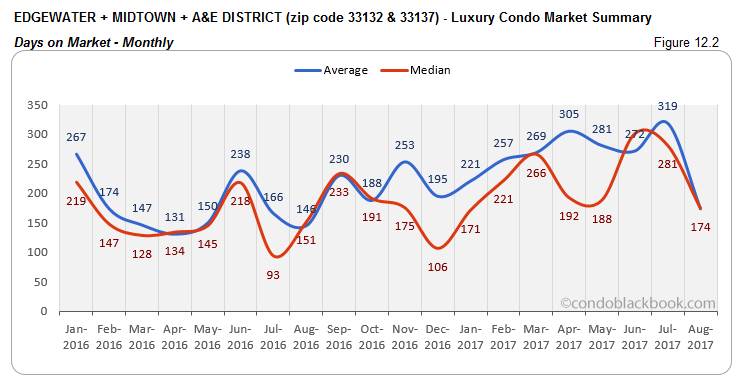
- Sales slam on the brakes, driving down the trend-line and days on market. This grouping has only 1 sale to report for the entire month of August. This is a whopping 83% lower (fig. 12.1) than the positive numbers we’ve had in the past couple of months, and 75% lower year-over-year. Although we’ve witnessed such variations in the past during August, this sets a brand new minimum. This low has also made a major impact on the trend line tracing sales over the past 12 months (fig. 12.1.1), pushing it down. Thankfully, the momentum gathered over the past few months pulled the median days on market down by 38% when compared to July (fig. 12.2).
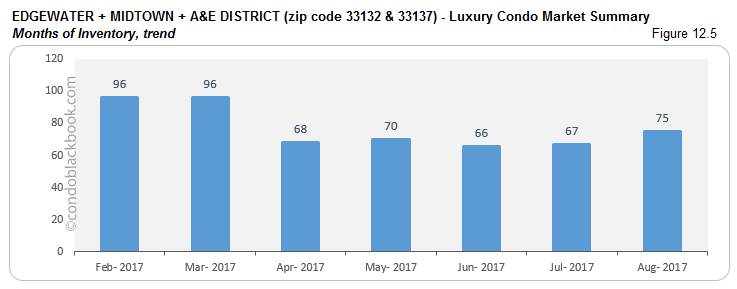
- Months of inventory jump 12%, giving buyers control. August had 439 active luxury condos listed from this grouping, with another 11 pending. Considering inventory moves out at an average (last 6 months) pace of 6 deals a month, there are still 75 months of inventory left on the market (fig. 12.5). This is significantly higher than the 9-12 months of a balanced market. As the scales are clearly tipped in favor of buyers, it won’t hurt to check out the individual lifestyle and condo options in Edgewater, Midtown and Arts & Entertainment District, or directly search Edgewater condos for sale here.
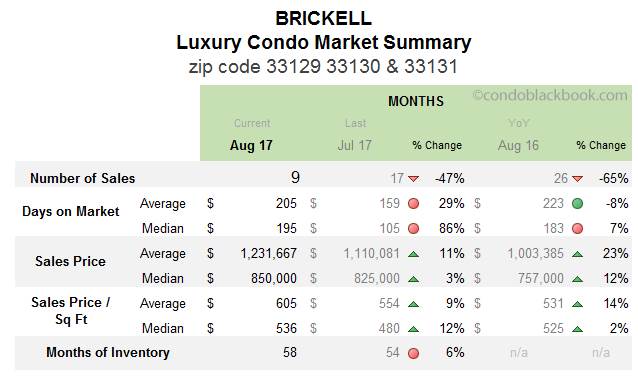
Brickell Luxury Condo Market Summary (33129, 33130, 33131 zip) back to top
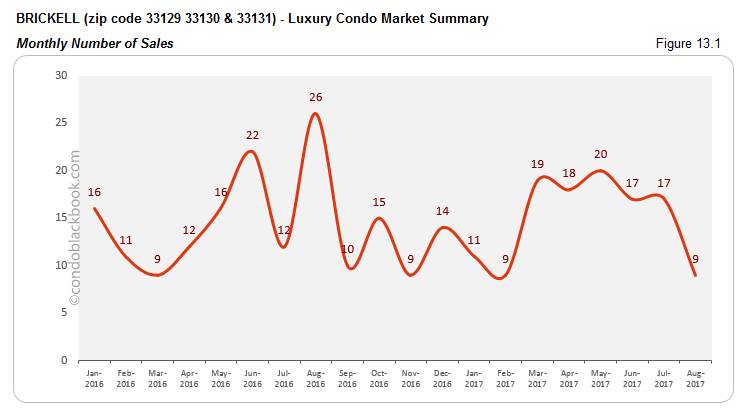
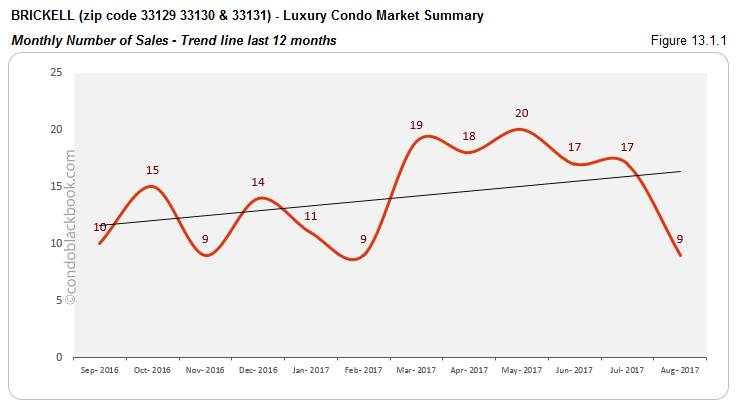
- Sales post steep decline, though trend-line stays positive. Brickell’s sales picture goes bleak like the rest of the mainland neighborhoods, posting a sharp 47% month-on-month decline and 65% year-over-year decrease (fig. 13.1). The positive streak may look like it has come to a screeching halt, but tracing sales over the last 12 months (fig. 13.1.1) makes it clear that the financial district is still going strong. Again, this suggests that this sudden drop is simply part of a seasonal adjustment.
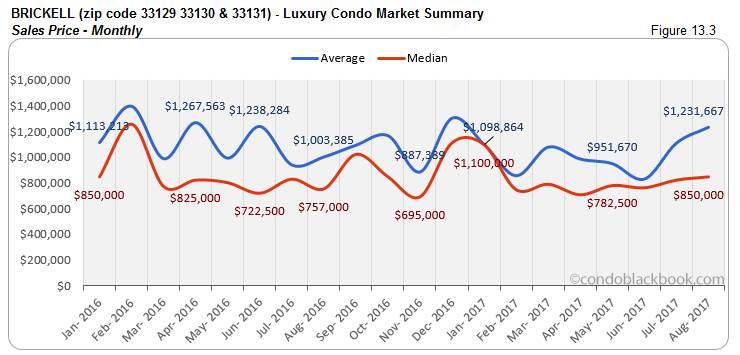
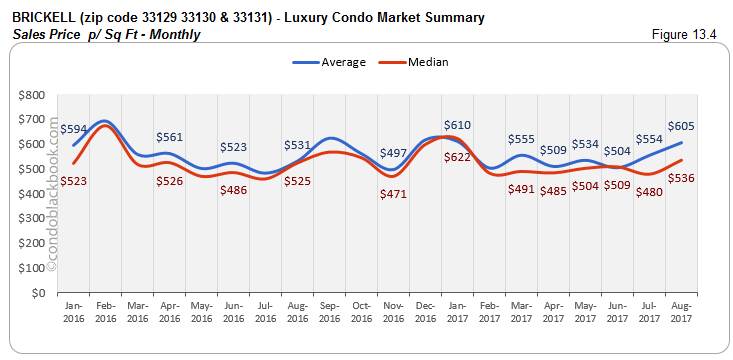
- Prices inch up. The rumble we see in the price charts (fig. 13.3 and 13.4) can be blamed on a handful of ultra-luxury sales in the neighborhood. This has pushed up the median sales price per sq ft to $536, which is 12% higher than July. Also, the median sales price went up 3% since July and posted a 12% year-over-year increase.
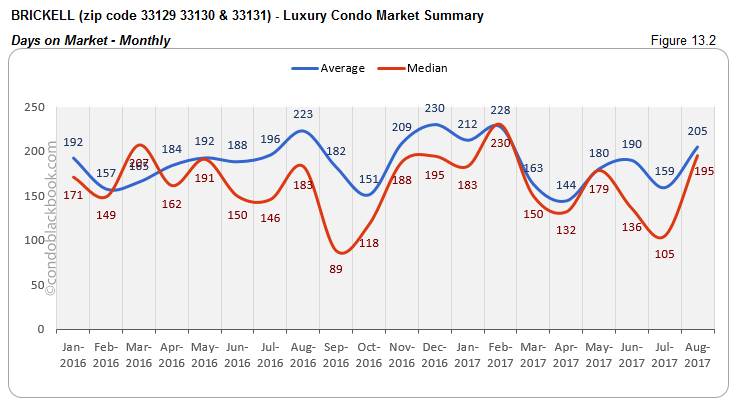
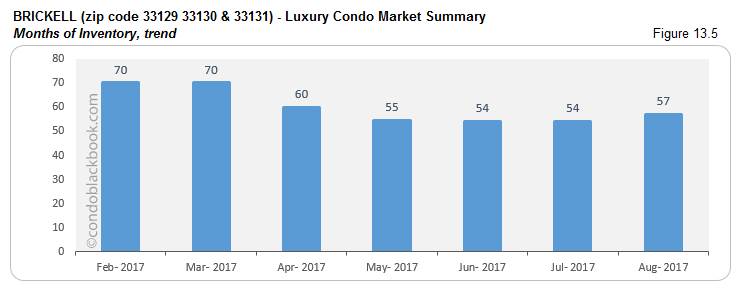
- Days on market and months of inventory increase, buyers retain edge. In August, Brickell saw 794 active listings, with another 31 pending. Considering inventory moves at an average (last 6 months) of 14 deals a month, the financial hub still has 58 months of inventory to deal with (fig. 13.5). This is way higher than the 9-12 months of a balanced market and 6% higher than July. Even the median days on market have increased by 86% (fig. 13.2). Such high inventory can only mean that buyers have plenty of room to play with negotiations. So, click to see Brickell’s lifestyle options or directly search Brickell condos for sale here.
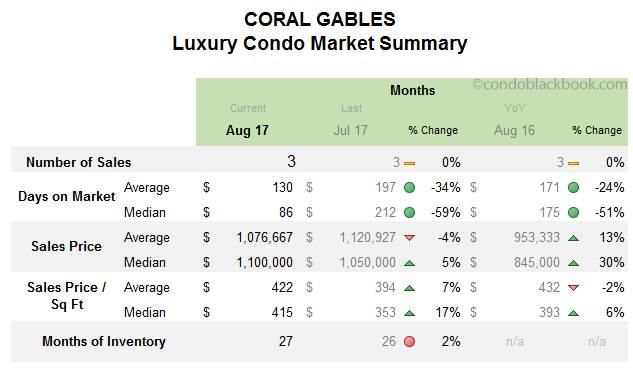
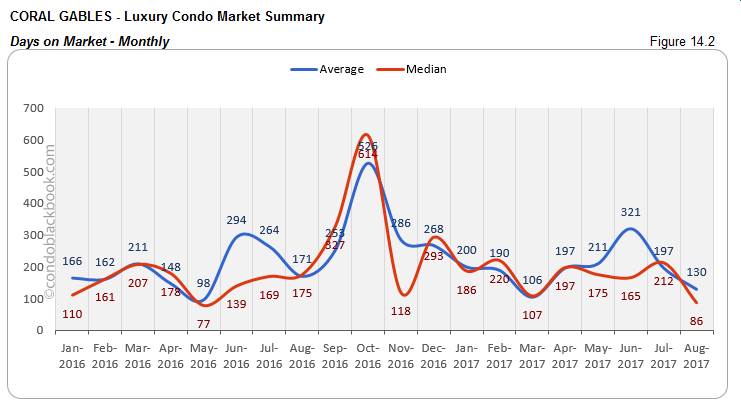
Coral Gables Luxury Condo Market Summary back to top
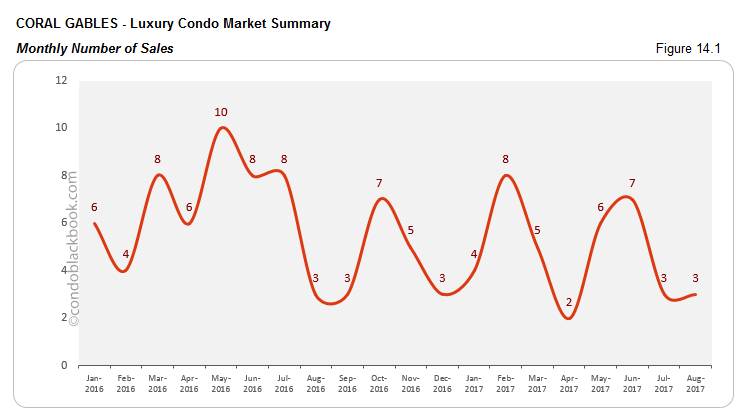
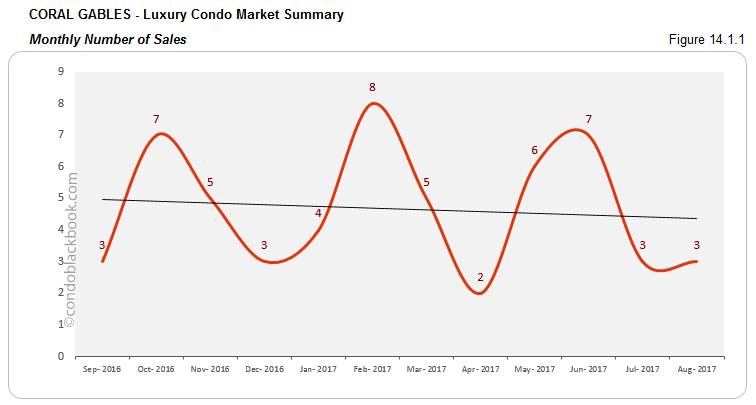
- Sales maintain curve, enough to keep days on market down, but not trend line. Though there is no change to report in the sales numbers in Coral Gables, you will notice that the curve has dropped significantly since May (fig. 14.1). This becomes even clearer when we trace the sales progress over the past 12 months in fig. 14.1.1. Thankfully, the neighborhood had gathered enough momentum to post a 59% month-on-month decrease in its median days on market, and 51% decline year-over-year (fig. 14.2) this August.
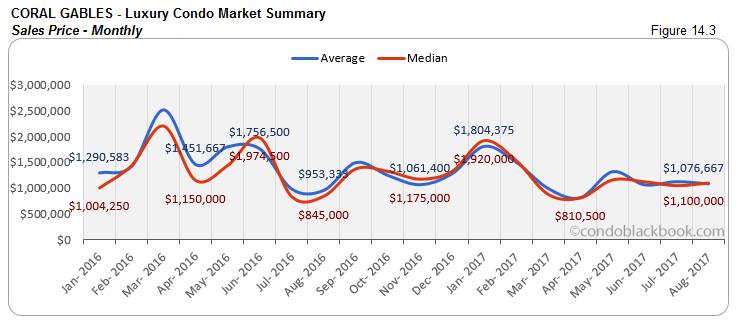
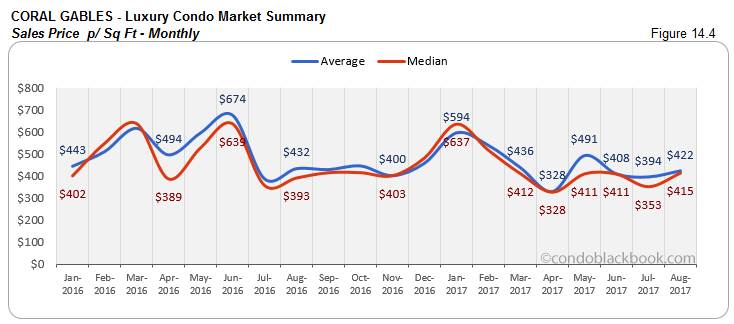
- Luxury sales push median prices up to second highest in Miami. Even with few sales to report, the prices have moved higher in Coral Gables. This is mainly due to a good number of luxury sales in the neighborhood (and very little influence from ultra-luxury sales, those typically above $2 million). We see the median price per sq ft increase 17% to reach $415 (fig. 14.4), while the median sale price soars 30% compared to August 2016 (fig. 14.3).
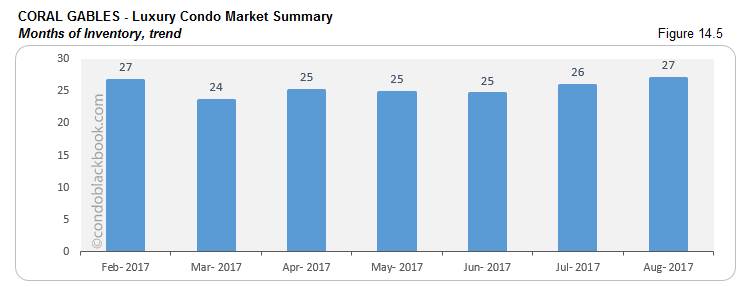
- 27 months of inventory, buyers get advantage. Coral Gables posted 107 active luxury condo listings, with another 15 pending. Considering inventory moves at an average (last 6 months) pace of 5 deals a month, there are still 27 months of inventory left of the market. This figure is much higher than the 9-12 months of a balanced market and March’s 24 months (fig. 14.5). Again, buyers have ample options to choose from and the luxury to drive negotiations. Click to see lifestyle options available in Coral Gables, or search Coral Gables condos for sale here.
Conclusion back to top
Buyers market holds strong. Again, August’s (usual) cool-off puts the ball in the buyer’s court. Miami’s luxury condo market is dealing with higher inventory and increased days on market in general. This gives buyers ample leverage to drive negotiations and make the best of the situations while it lasts. We expect this slowdown to continue well into October, considering hurricane Irma’s impact. In the meanwhile, if sellers want their properties sold sooner, it would be best to stay flexible with terms and pricing.
Love what you see? Don’t forget to share our blog and subscribe (see the subscribe link on the top menu) to receive the latest market news in your inbox.
Have any questions? Or see something wrong with the stats? Please contact Sep at sniakan (at) hbroswell.com or call 305-725-0566.
Share your thoughts with us

Your Miami Condo Awaits
Recent Posts


 (305) 697-7667
 (786) 321-7233
  contact@condoblackbook.com

