Luxury Miami Condo Market Trends: May 2018 Report
Jun 30, 2018 June 30, 2018
Learn the latest market trends for the luxury condo market in Miami, with detailed monthly and yearly statistics and accurate analysis you can't find anywhere else.
Miami Luxury Condo Report Overall Market Summary
City and Neighborhood Luxury Condo Reports
Miami Beach Luxury Condo Report
South Beach Luxury Condo Report
Bal Harbour Luxury Condo Report
Sunny Isles Beach Luxury Condo Report
Greater Downtown Miami Luxury Condo Report
Edgewater / Midtown / A&E District Luxury Condo Report
Coconut Grove Luxury Condo Report
Coral Gables Luxury Condo Report
Miami Luxury Condo Market Report: Summary back to top
We see the sales picture continue on the positive note it started last month. Months of inventory report a significant relief as well. Read on to see if the prices and general market conditions continue to favor buyers or not….
For the purpose of this luxury condo report, we have only considered properties priced $600,000 and above. Also, properties priced $5 million and higher have been referred to as ultra-luxury.
Overall Market Highlights:
- Sales post a positive for most neighborhoods, overall reporting a boost
- Overall days on market shift higher
- Ultra-luxury sales and newer, more expensive product keeps price trends up
- Inventory dips in all neighborhoods (which is a good thing), except Surfside
- Market picks up pace, but buyers still retain edge
Sales continue with healthy upswing. May comes in with a better summer boost than last year. Perhaps it’s the SALT tax laws pushing new residents our way or lower pricing on the luxury segment ($600K to $5 million) working their wonder. Whatever the reason might be, we hope to see this positivity continue in upcoming months.
Days on market nudge up again. Overall, we see an increase in the median days on market, suggesting that perhaps buyers and sellers have been finding it tougher to find a middle ground and settle on each other’s terms, OR maybe just maybe sellers that have been sticking to their guns for a very long time finally came to reality and are settling to today's prices and moving on. That sometimes brings a temporary uptick in days on market.
Prices push higher, but not the complete picture. Although we see an increase in the prices trends below, we are certain that prices in the luxury segment ($600K to $5 million) are either the same or lower compared to last year. This upward shift could be a mix of ultra-luxury sales (above $5 million) and newer (inherently) higher priced condos selling on the market. In a future report, we will analyze apples to apples products to get a better sense of the price trends without the newest construction included.
Inventory at lowest since 2017. With most neighborhoods reporting a reduction in inventory, we see levels coming down to a new low in over a year. What’s most interesting to note here is that the months of inventory are based on the performance of sales over the past 6 months, which indicates that the market dynamic has been on the positive side for the last 6 months.
Overall, the market continues to tread on the positive side this May. However, trends would need to keep in order to bring the luxury condo market back in balance. Until then, buyers can enjoy the luxuries a favorable market brings with it.
Where Does the Market Go From Here? back to top
Even as we see buyers retaining their hold on the luxury condo market for over a year, the following could (and some have even started to) take effect to help the market find its footing:
- New tax laws continue pushing residents our way. The impact of the SALT tax laws is now coming through (as predicted), as we see a fresh wave of residents headed towards Miami. The numbers speak for the trend as well, with a continuation on positive sales this month. Check out which taxes you get to save being a resident of Florida.
- Discounted pricing should lure in buyers. We have been noticing lower prices on luxury condos ($600k to $5 million) for the past couple of months. The inflation in charts below is mostly due to ultra-luxury sales (above $5 million) and newer product which is inherently more expensive. Nonetheless, lower prices from the luxury segment are sure to capture buyer’s attention.
Below is an insight into Miami’s overall and neighborhood-level luxury condo trends for May 2018:
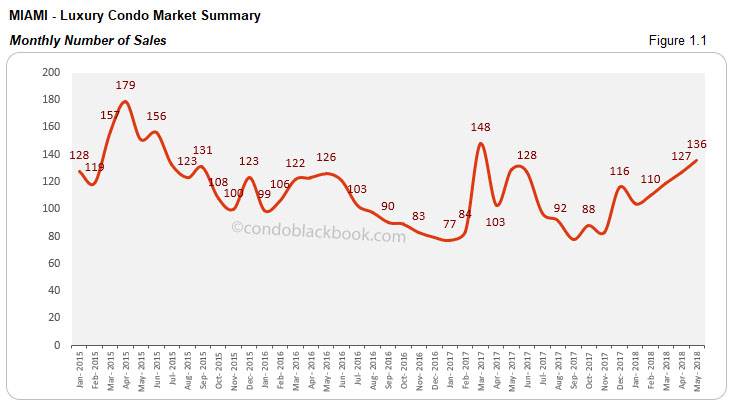
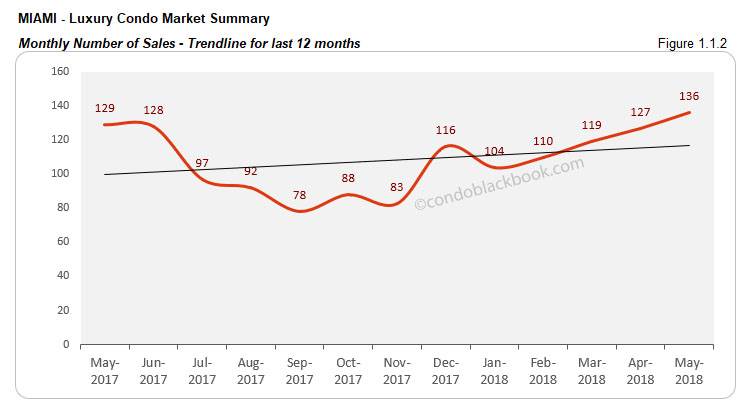
Monthly Number of Sales - Miami Luxury Condo Market Overall back to top
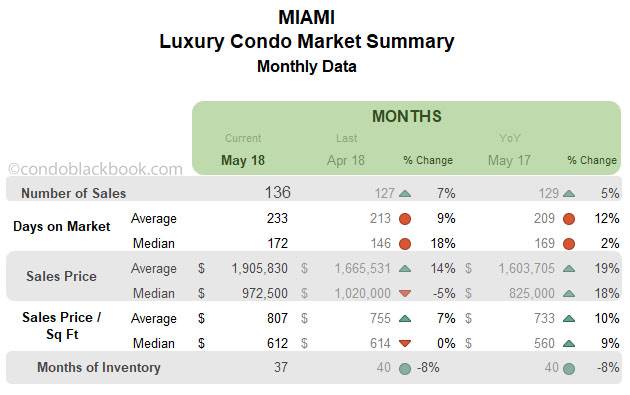
Sales and trend line get definite boost. We see the usual summertime boost kick in with May’s sales numbers (fig. 1.1). There is an increase of 7% month-on-month and 5% year-over-year to report. Even though this positivity is powered by only a handful of districts in our study, it still finds its way into the trend line below, making it soar in fig. 1.1.2.
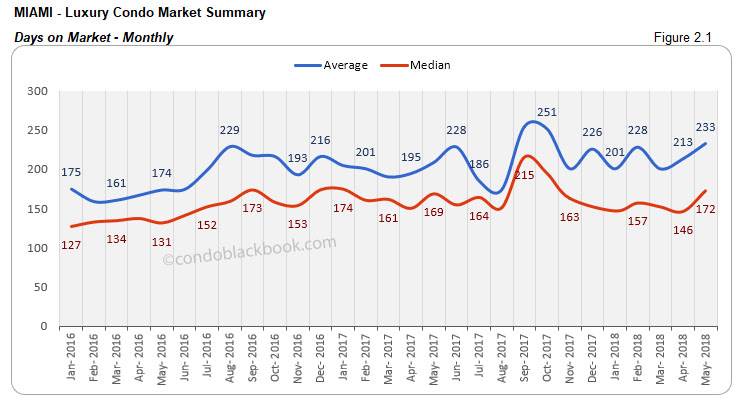
Days on Market - Miami Luxury Condo Market Overall back to top
“Days on market” are the total number of days from when a property is active to the day it goes under contract.
Median days on market move up. We’ve seen the days on market fluctuate over the past few months. This May, we again see an upward trend of 18% in the medians compared to last month. This could probably mean that buyers and sellers are finding it tougher to come to a consensus. (see fig 2.1 below)
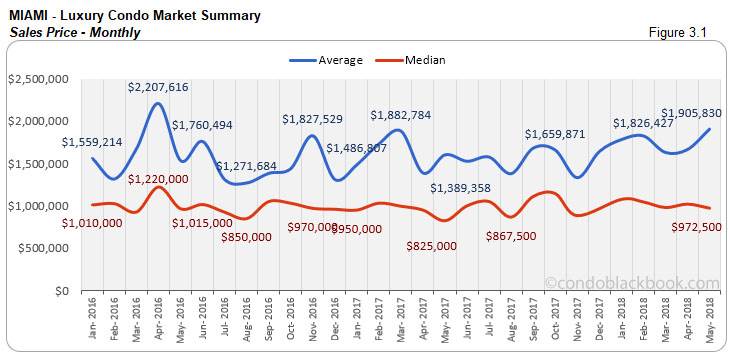
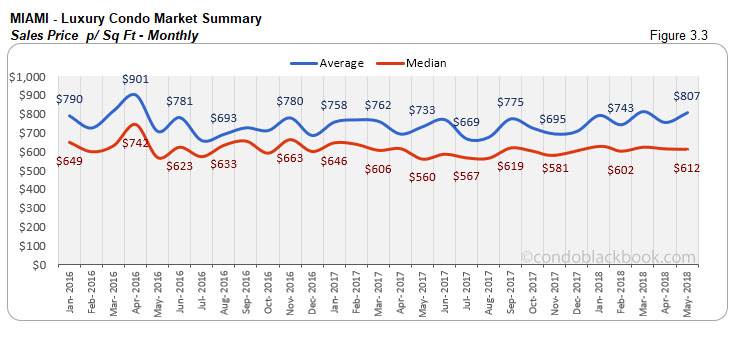
Sales Price Trends - Miami Luxury Condo Market Overall back to top
Prices settle month-on-month, but move higher from last year. This May, prices report mixed trends. While the median price (fig. 3.1) is 5% lower compared to last month, it is 18% higher compared to last year (fig. 3.3). This increase could be because of brand new condo product hitting the market and ultra-luxury sales keeping up inflation, rather than prices shooting up for existing properties.
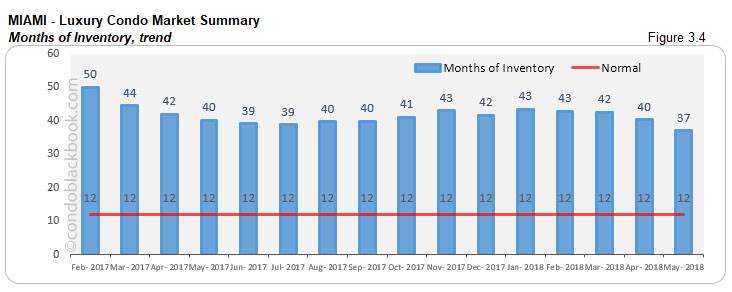
Inventory Trends - Miami Luxury Condo Market Overall
A balanced market will only have 9-12 months of inventory. The months of inventory are calculated as – no. of active listings + no. of pending listings divided by the average number of deals in the last 6 months.
Inventory dives 8% to lowest in over a year. In a very positive move, we see the months of inventory decline 8% compared to the previous month and year. At 37 months, inventory makes a new low, which it hasn’t in over a year. Still, 37 months is way off the ideal 9-12-month mark, giving buyers ample room to play and dictate negotiations. And the question is, will the trend continue as we head into the dog days of summer.
City and Neighborhood Market Reports back to top
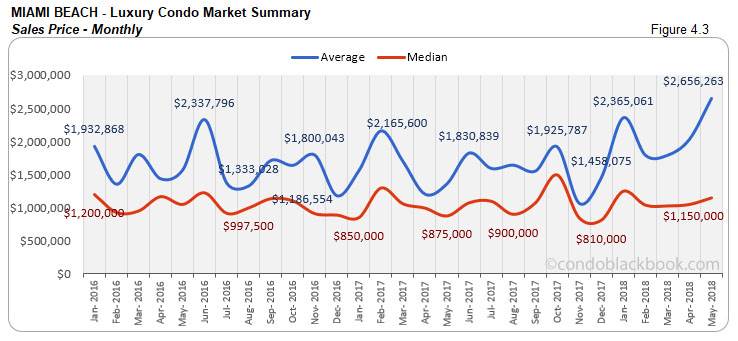
Miami Beach Luxury Condo Market Summary back to top
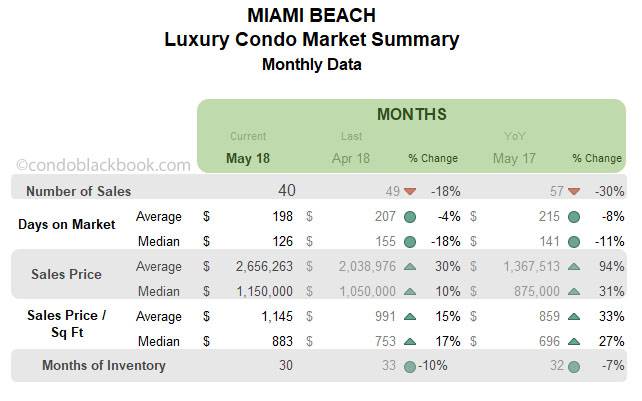
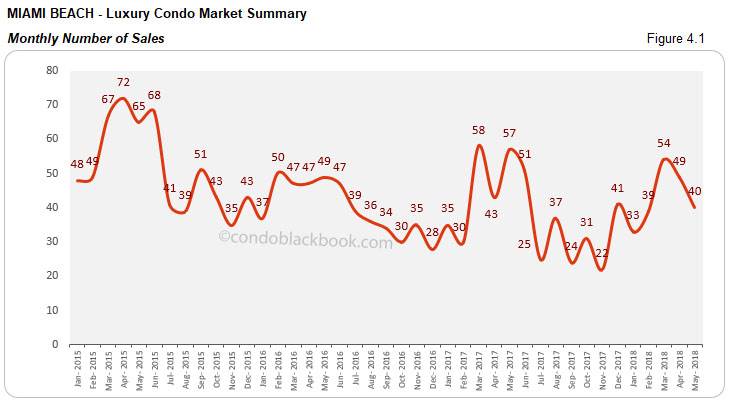
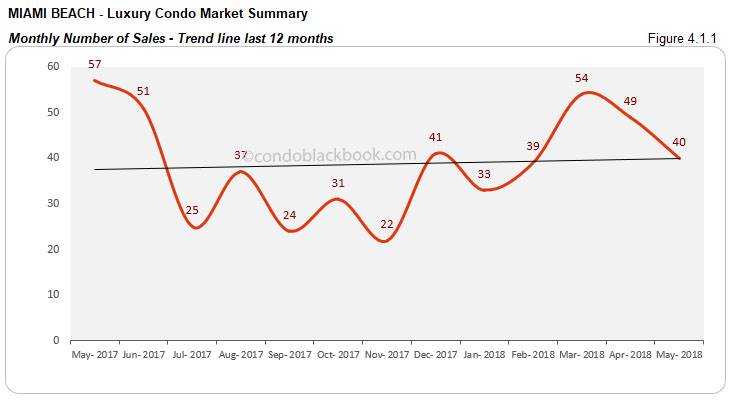
Sales decline, though trend line manages to stay positive. The market in Miami Beach goes out of step from the overall sales trend in Miami. We see an 18% decline compared to April and 30% decline in sales year-over-year (fig. 4.1). However, the trend line reports a positive trend, suggesting that the market hasn’t lost its steam here yet (fig. 4.1.1).
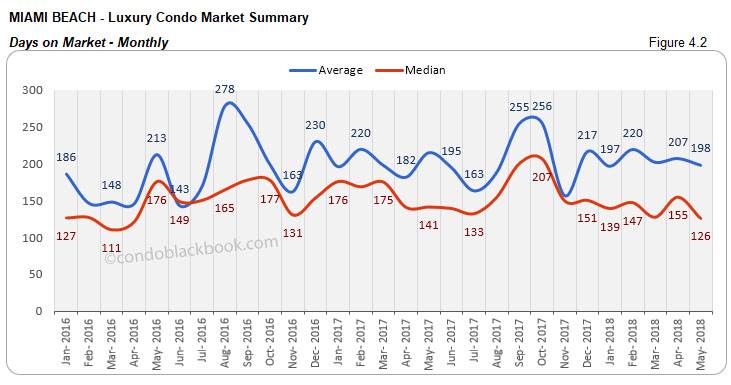
Days on market decline 18%. A positive marker for luxury condos in Miami Beach, the median days on market dropped 18% month-to-month and 11% year-over-year. (see fig. 4.2 below)
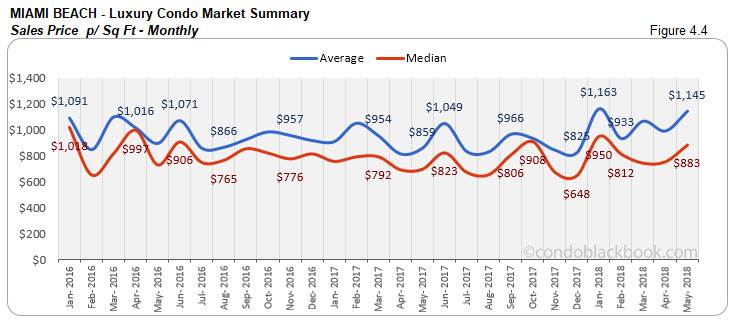
Ultra-luxury deals fuel uptick in prices. Bigger price tags on ultra-luxury (above $5 million) sales make their presence felt in the charts below. The upticks in fig. 4.3 and 4.4 below come fueled by a $26 million sale of a 321 Ocean condo, $13.5 million deal on an Apogee condo and $9.5 million sale of a Setai property this May.
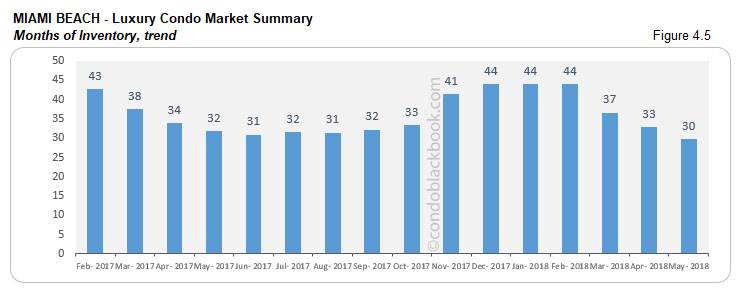
Inventory down 10%. Keeping its positive trend, we see the months of inventory decline 10% compared to last month and 7% against last year. At 30 months, inventory is now lower than it has been in over a year. Still ways off the 9-12 months of a balanced market, buyers still have the opportunity to look into great deals by searching Miami Beach condos for sale here.
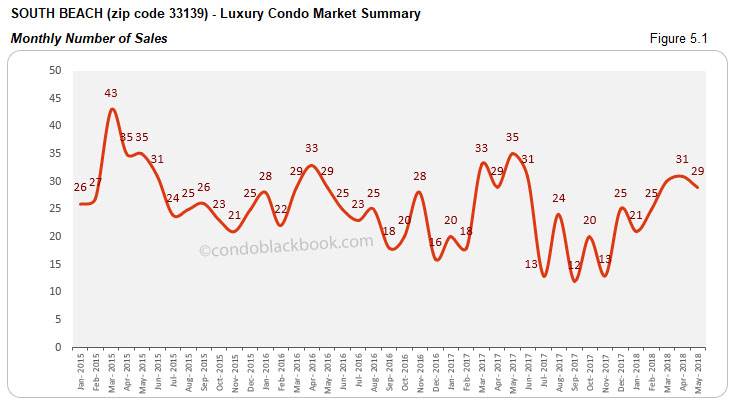
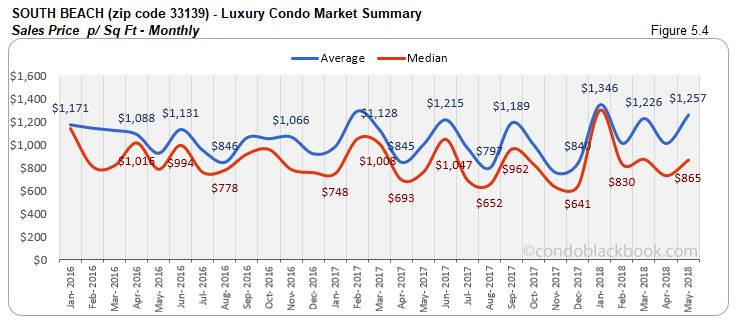
South Beach Luxury Condo Market Summary (33139 zip) back to top
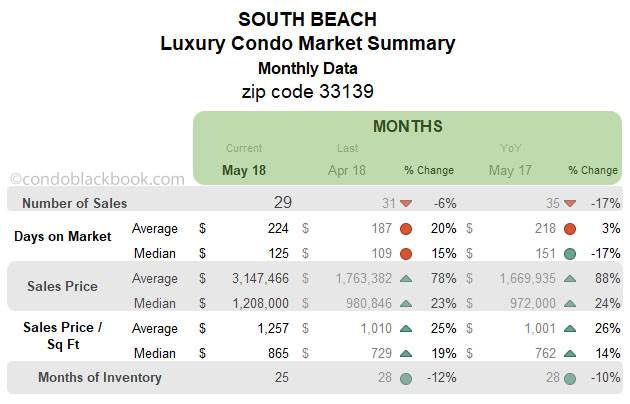
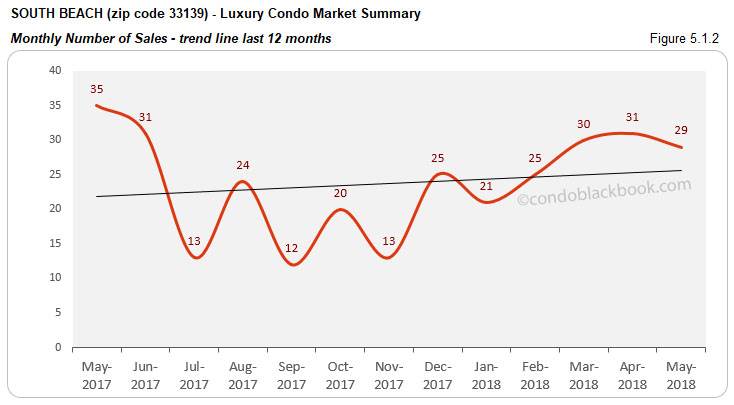
Sales post decline, but trend line stays positive. Contributing to the negative sales trend in Miami Beach, we see a 6% decline in sales compared to April and 17% drop against same month last year in South Beach. This, however, has no impact on the trend line below in fig. 5.1.2, suggesting that the market dynamic is still positive.
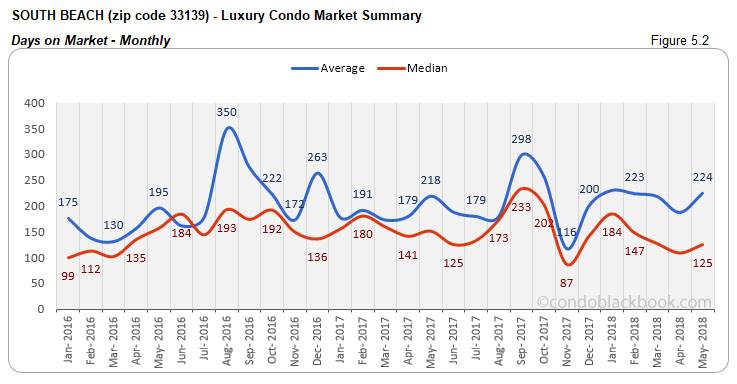
Days on market increase 15%. This month too, South Beach reports an increase in its monthly median days on market, suggesting that sellers and buyers find it tougher to find middle ground.
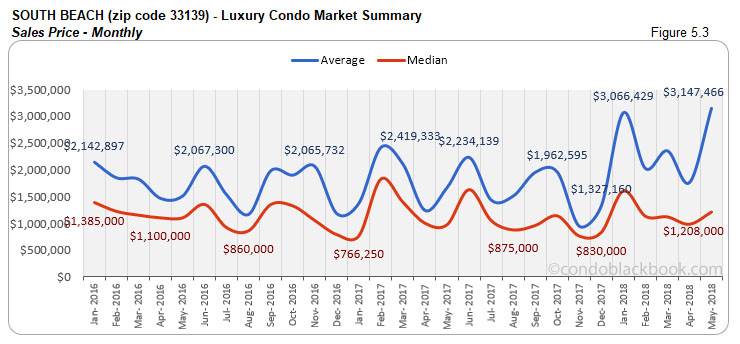
Ultra-luxury sales keep inflation on prices. As mentioned above, ultra-luxury sales like a 321 Ocean condo’s $26 million deal, Apogee’s $13.5 million price tag and Setai’s $9.5 million sale are keeping price metrics high in fig. 5.3 and 5.4 below. The median price per sq. ft. in South Beach closed at $865 this May.
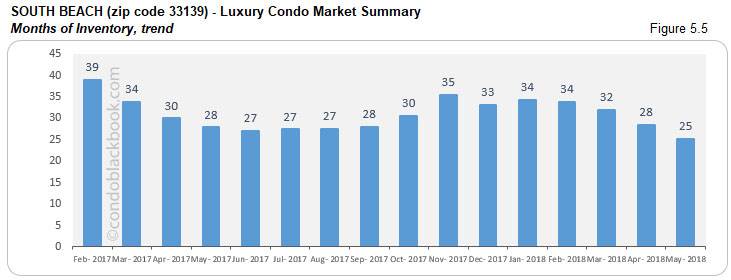
Inventory drops 12%. We see a significant drop in the months of inventory in South Beach. Reaching 25 months, there is a 12% drop against April and 10% decline compared to last year. With the trend dropping to a new low in over a year, buyers are advised to grab the opportunity by searching South Beach condos for sale here, or taking a tour here before the ideal 9-12-month mark is reached.
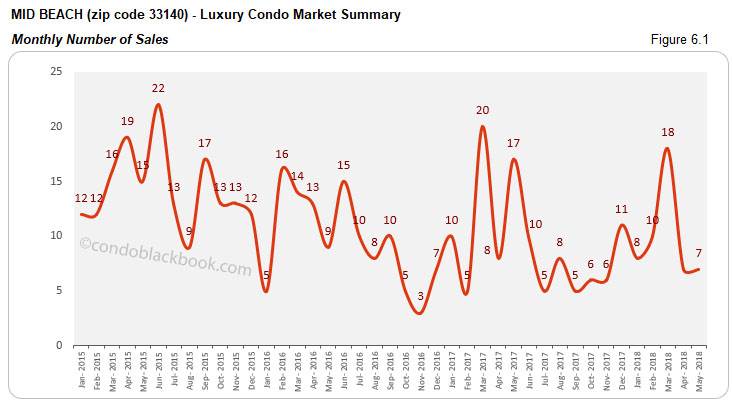
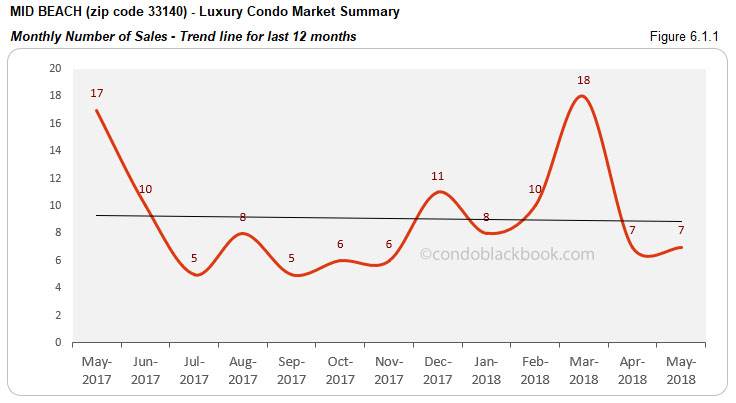
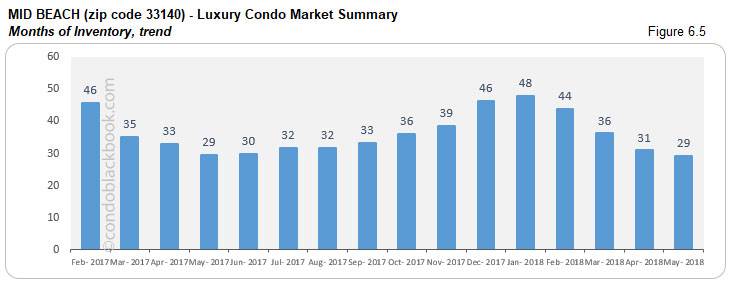
Mid-Beach Luxury Condo Market Summary (33140 zip) back to top
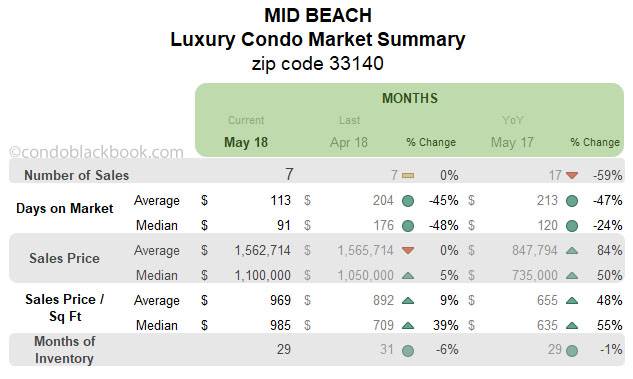
Sales stay flat with negative trend line. With the same number of sales as April, we see a decline of 59% from last year’s numbers in Mid-Beach. This goes on to impact the 12-month trend line in fig. 6.1.1., giving it a negative tilt this month.
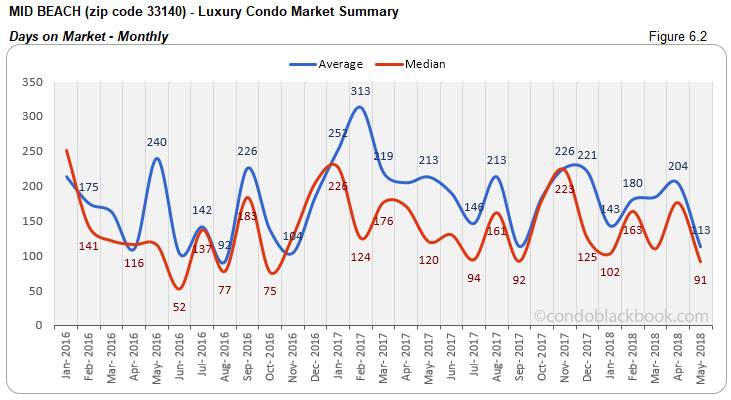
Days on market post sharp decline. A positive indicator for this upscale neighborhood, we see a significant decline in the median days on market. Luxury condos spent 48% less time on the market compared to April and 24% less time compared to same month last year.
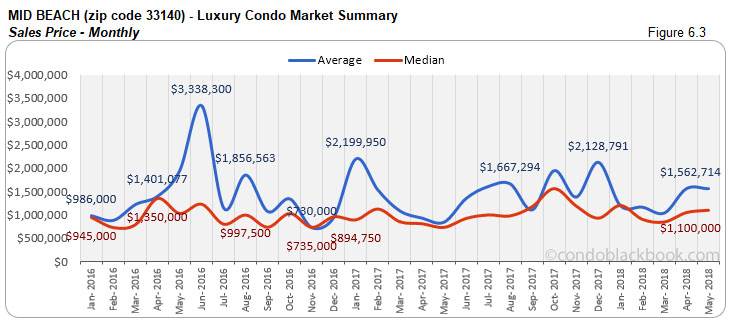
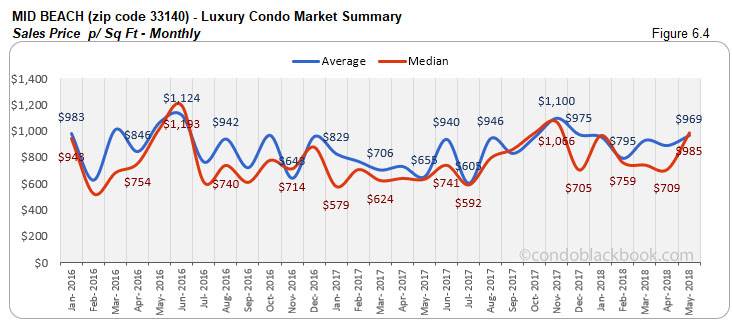
Prices post uptick. We see a 5% increase in median prices over April and 50% increase over last year (fig. 6.3). With no clear indication for this upsurge, Mid-Beach closed May with a 39% higher price per sq. ft. of $985 in May (fig. 6.4).
Inventory reports 6% decline. Continuing on its positive streak, we see the months of inventory decline 6% against April and 1% against same month last year. However, since 29 is still off the 9-12-month mark of a balanced market, buyers can expect to grab some phenomenal deals by searching Mid-Beach condos for sale here, or starting out with a tour here.
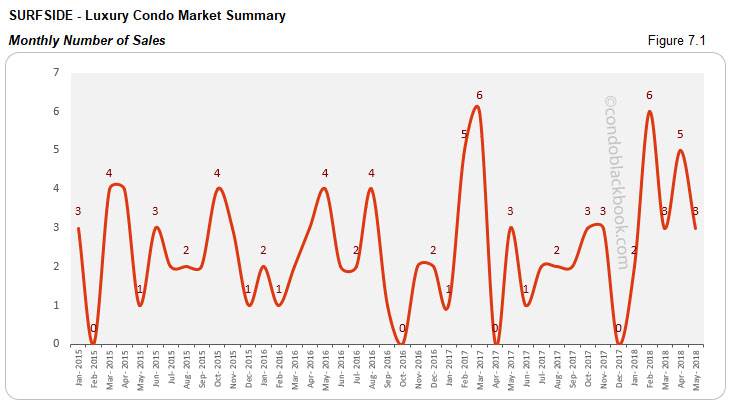
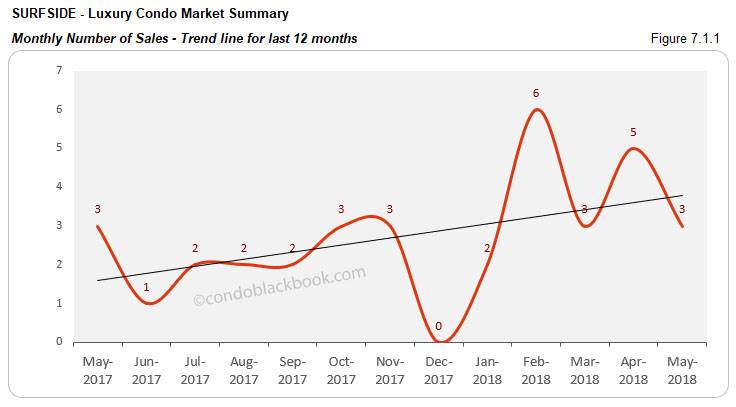
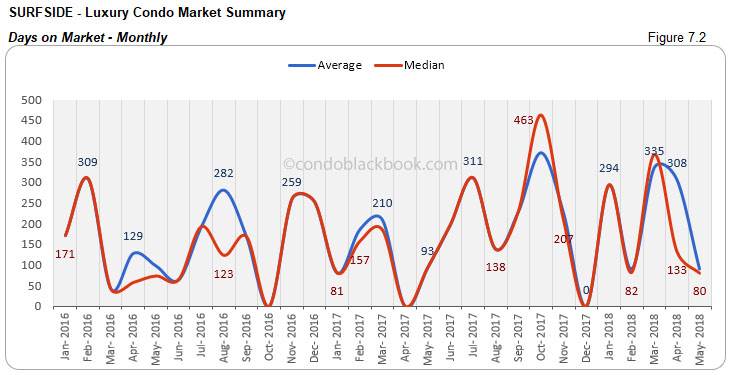
Surfside Luxury Condo Market Summary back to top
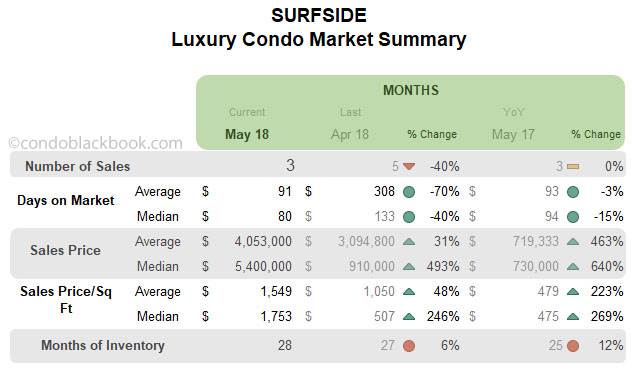
Sales slack slightly, but trend line stays positive. May couldn’t follow through April’s sales spike in Surfside. Nonetheless, this small market for luxury condos matched 2017’s performance with its 3 sales. This keeps the trend line in fig. 7.1.1. still soaring upwards.
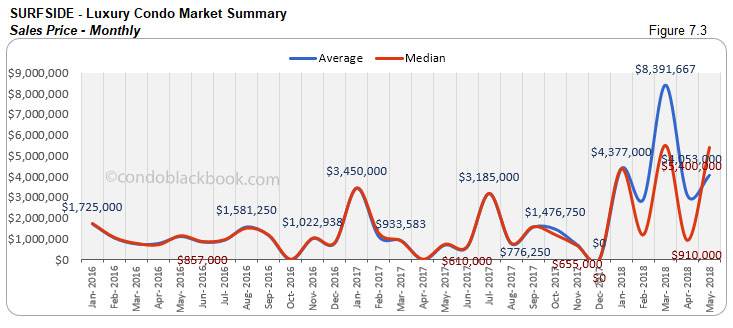
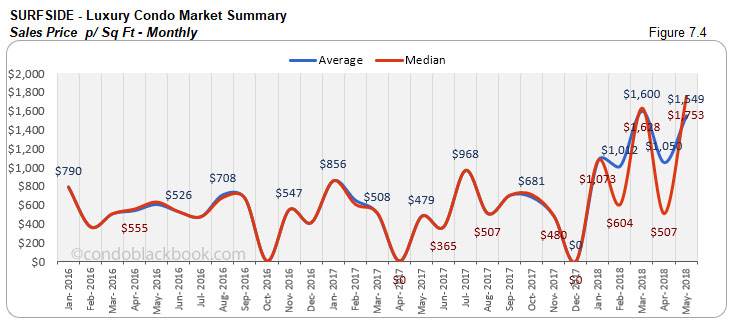
Ultra-luxury sales continue adding volatility to price metrics. We see very high volatility in prices for this small luxury condo market mostly due to ultra-luxury sales (above $5 million). March bagged an $18 million deal, April saw two sales around $6 million and May came in with another two sales of around $5 million. These have shot up the prices in fig. 7.3 and 7.4 below.
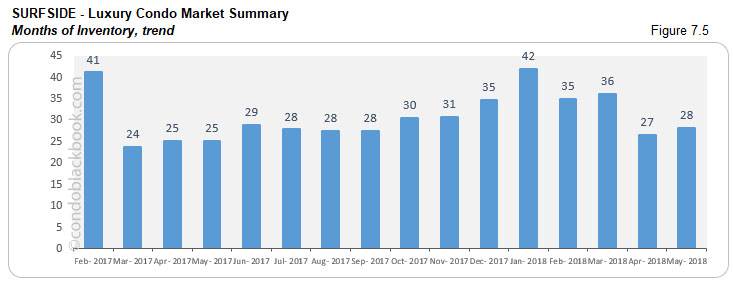
Inventory up 6%. We see a negative trend reversal in May’s inventory numbers. At 28, it is 6% higher than April and 12% more than May last year. A step back on recovery, this is again off the 9-12-month mark of a balanced market. This gives buyers ample opportunity to control negotiations and make them work in their favor, as they search for a Surfside condo for sale here, or see what lifestyle makes up Surfside here.
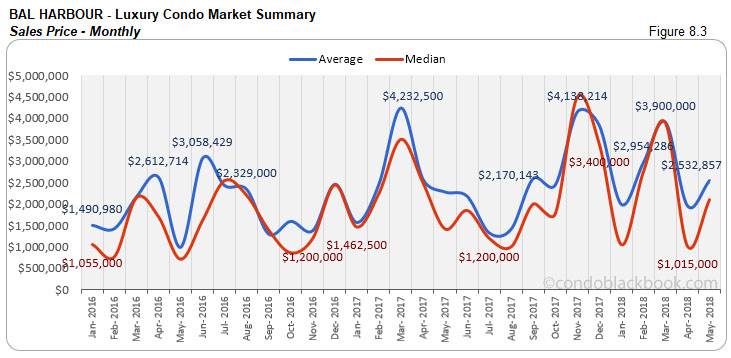
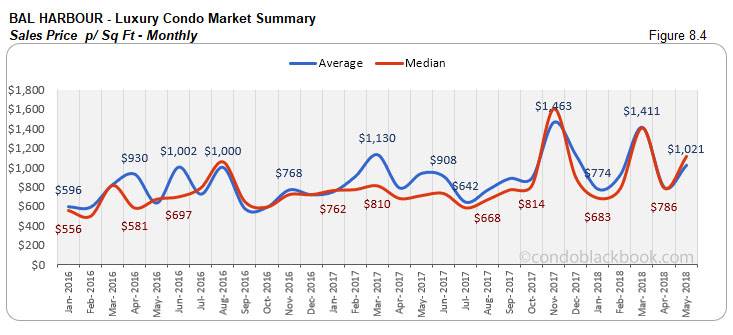
Bal Harbour Luxury Condo Market Summary back to top
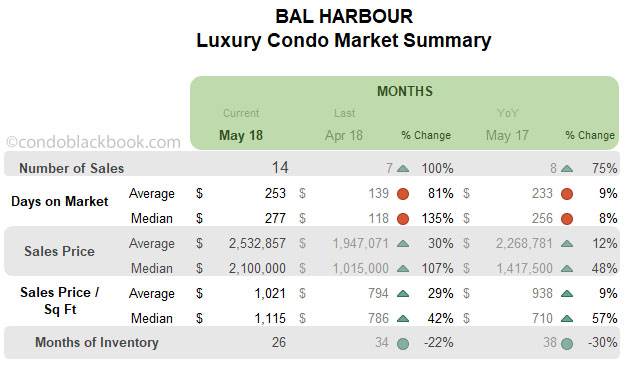
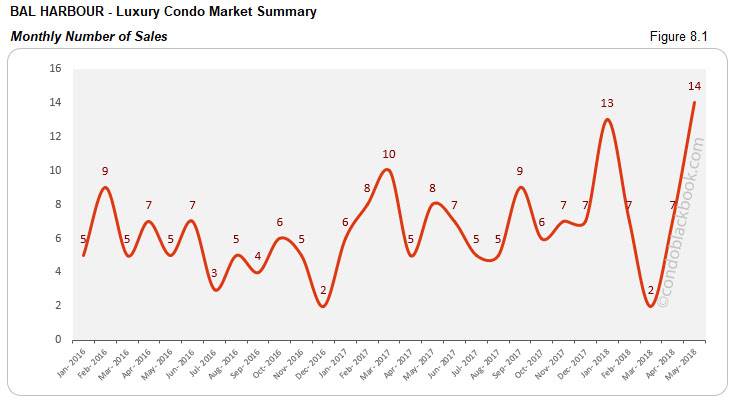
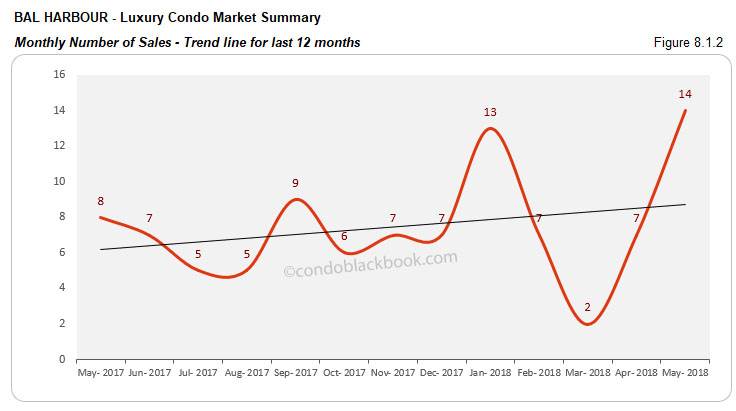
Sales double up to make trend line soar. In sync with the overall market trend, we see the sales for May double up over April and increase 75% over last year. With such great numbers in tow, having a soaring trend line (fig. 8.1.2) was inevitable.
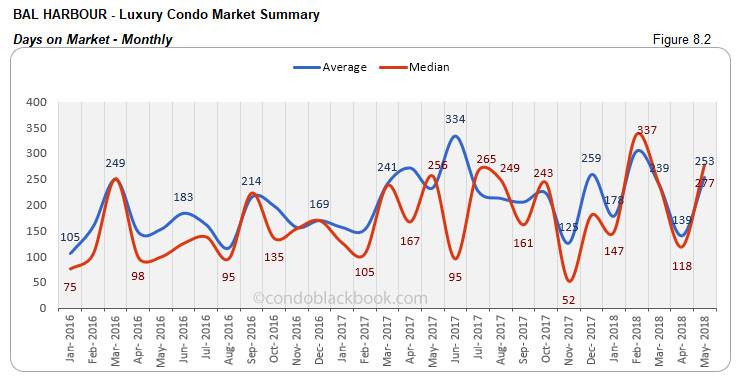
Considering Bal Harbour is a rather small market for luxury condos, metrics are usually very volatile and even a handful of sales can make a huge impact, as can be seen in the days on market and price charts below (see fig. 8.2, 8.3 and 8.4).
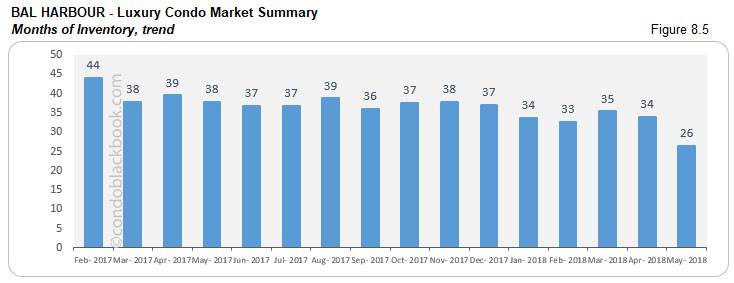
Inventory reduces 22%. Taking a cue from last month’s positivity, we see a major decline in inventory in Bal Harbour. At 26, months of inventory is down 22% against April and 30% compared to last year. With the ideal 9-12 months of inventory now looking achievable, buyers should make haste by searching for Bal Harbour condos for sale here, or check out the upscale neighborhood here.
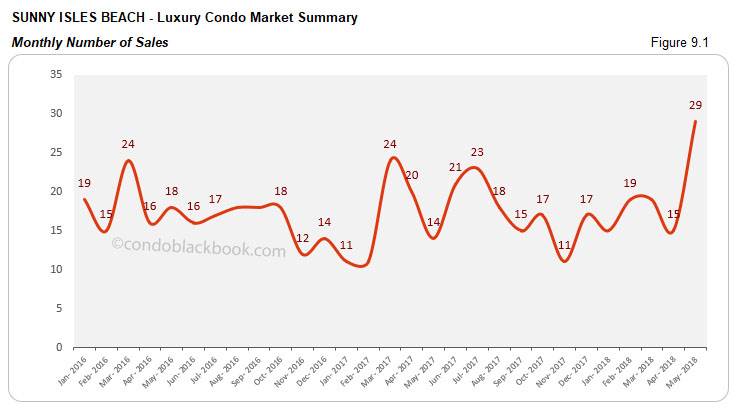
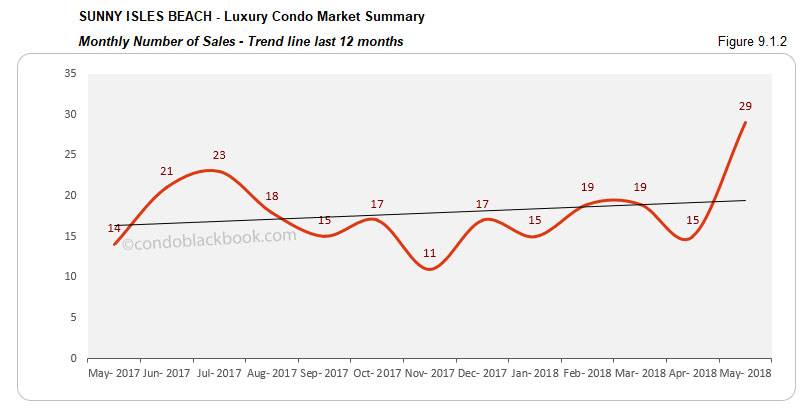
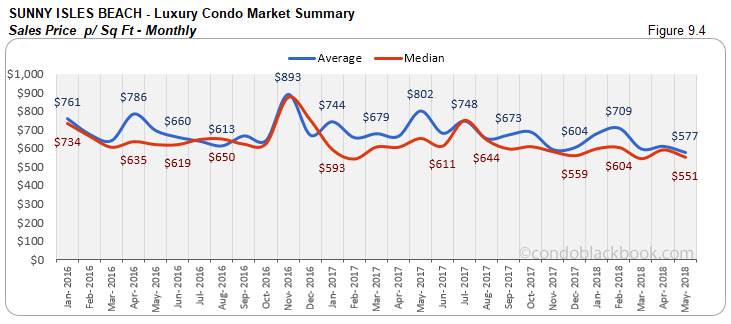
Sunny Isles Beach Luxury Condo Market Summary back to top
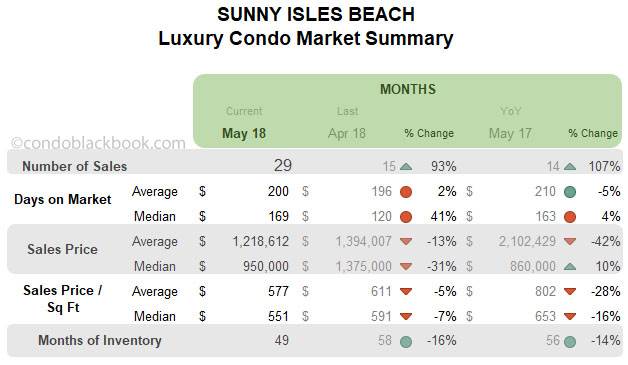
Sunny sales push trend line upwards. After posting negative sales last month, Sunny Isles Beach makes quite the recovery in May. We see an increase of 93% over April and 107% against same month last year. This gives the trend line in fig. 9.1.2 an upward nudge, suggesting positive sales momentum for the district.
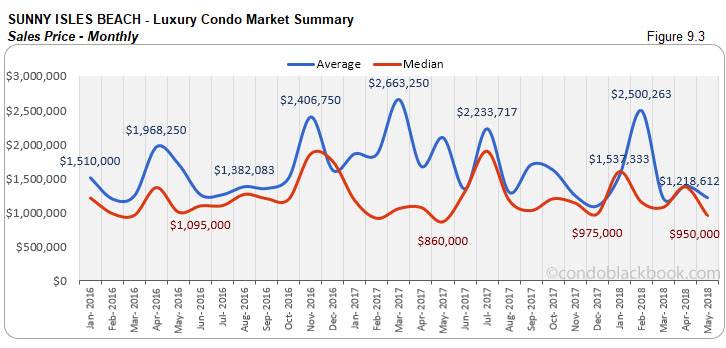
Prices deflate month-on-month. We see a 31% decline in the median price in Sunny Isles Beach compared to April. Even the price per sq. ft. is down 7%, closing at $551 in May. This deflation comes as previous months had ultra-luxury sales (above $5 million), but not May. This brings the charts closer to reflecting the actual sentiment of the luxury market ($600K to $5 million). (see fig. 9.3 and 9.4 below)
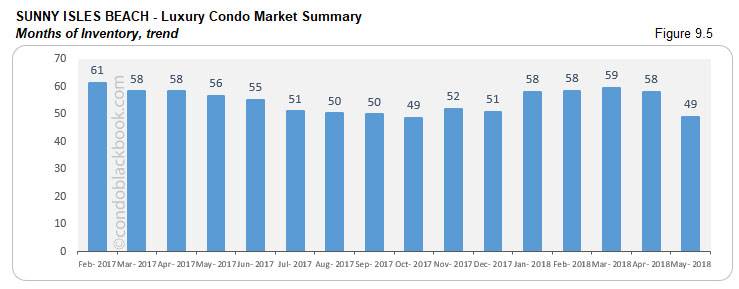
16% reduction in inventory. May comes in with quite an improvement as inventory reduces 16% over April and 14% year-over-year. At 49, the months of inventory match the lowest that they’ve been in over a year. However, with numbers way beyond the 9-12-month mark of an ideal market, we see plenty of opportunities for buyers to strike an advantageous deal. Begin by exploring the lifestyle options here or you can search Sunny Isles Beach condos for sale here.
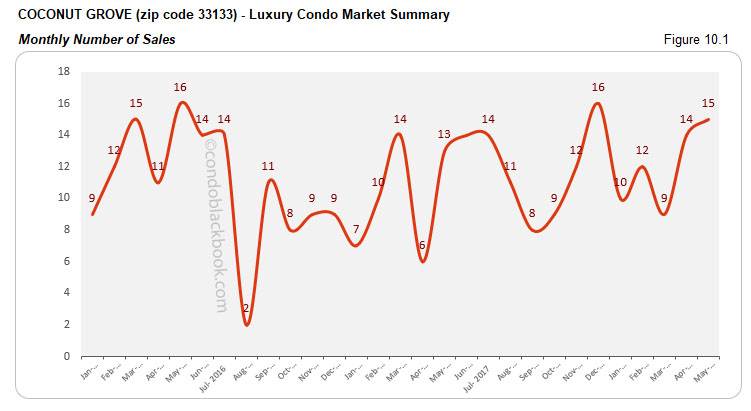
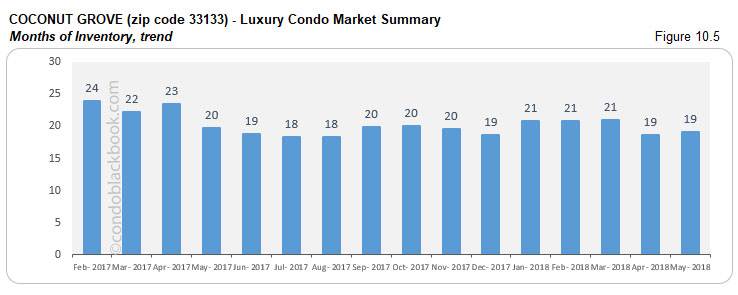
Coconut Grove Luxury Condo Market Summary (33133 zip) back to top
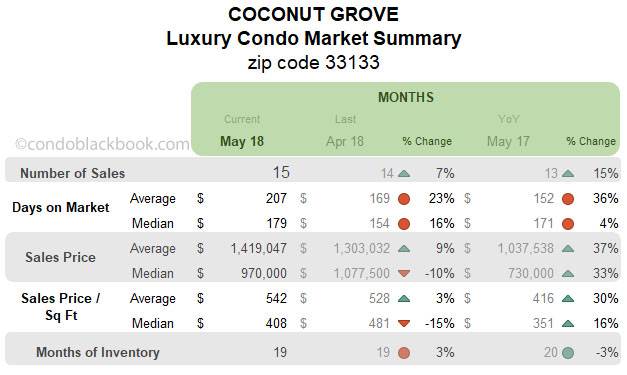
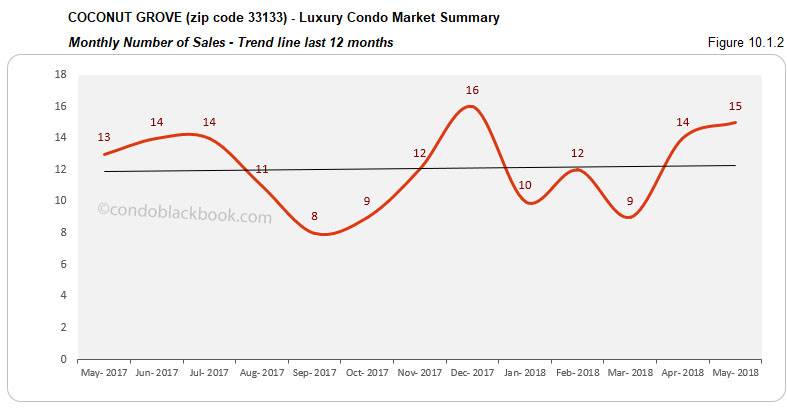
Sales continue upward trek with positive trend line. Coconut Grove is one of the most dynamic districts in our study. Posting another positive, we see a 7% increase in sales against April and 15% improvement year-over-year. This helps the 12-month trend line tracing sales in fig. 10.1.2 maintain its positive curve.
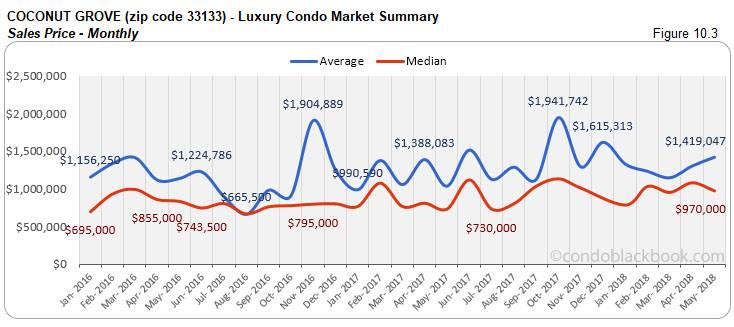
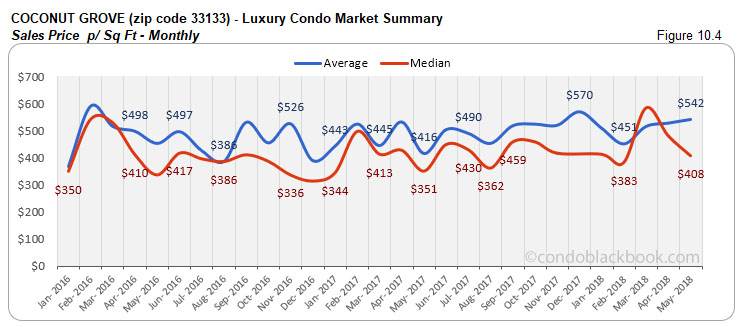
Prices decline month-on-month. We see the prices adjust lower on the monthly charts. There is a 10% reduction in the median sales price and 15% reduction in the median price per sq. ft. in Coconut Grove. The price per sq. ft. closed at $408 in May. (see fig. 10.3 and 10.4 below)
Inventory hovers. There is only a miniscule change to the months of inventory this May over last month. But, there is a 3% drop year-over-year. With such low levels of inventory, Coconut Grove is one of the closest to reaching the ideal 9-12 months (fig. 10.5) in our study. Buyers should make their move now to grab deals by searching Coconut Grove condos for sale here, or check out what lifestyle makes this vibrant neighborhood so dynamic here.
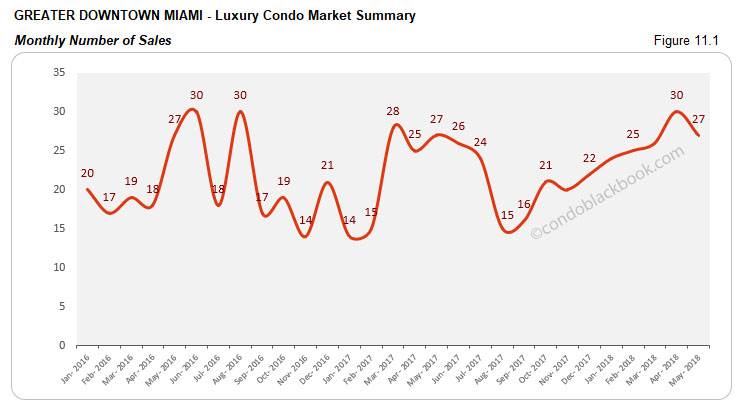
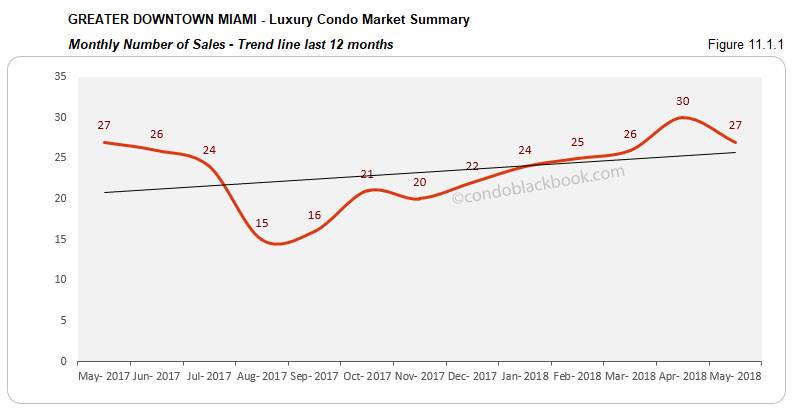
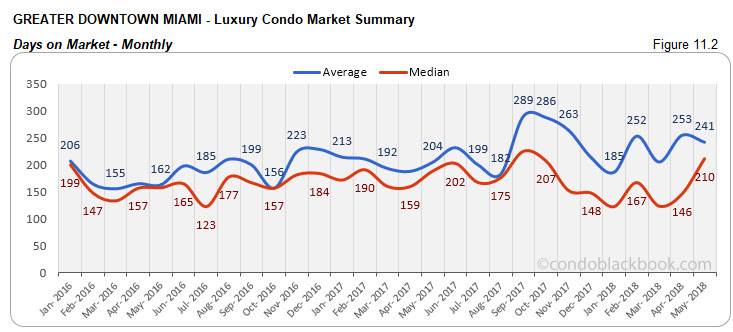
Greater Downtown Miami Luxury Condo Market Summary (33129, 33130, 33131, 33136, 33137 zips) back to top
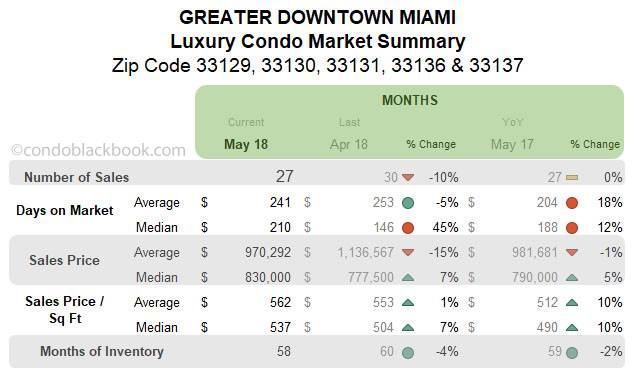
Slight decline in numbers, but sales hold up year-over-year. Even as sales post a 10% decline over April, they manage to match 2017 levels. This points towards a positive trend for the district, which is further evidenced in the upward moving trend line of fig. 11.1.1 below.
Days on market continue rising. Luxury condos took 45% longer to get off the market this May compared to April and 12% longer compared to same month last year.
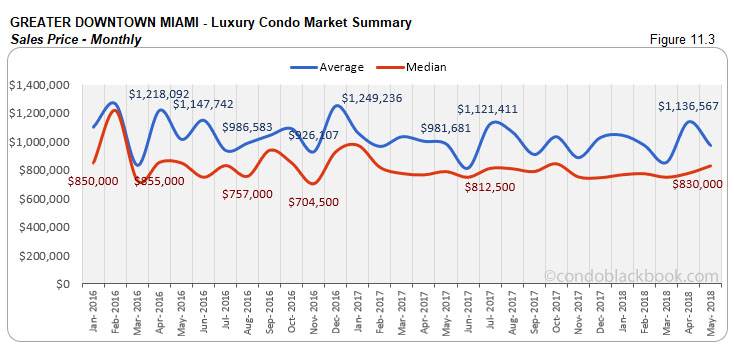
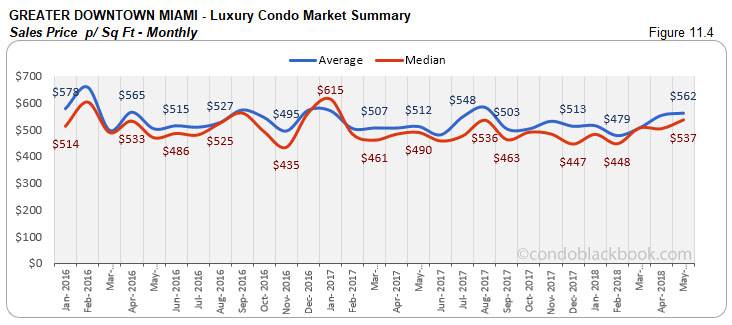
Prices post uptrend. We see a positive move in the prices for this district. There is a 7% increase in the median prices over April and 5% increase year-over-year. The price per sq. ft. too went up 7%, closing at $537 in May. (see fig. 11.3 and 11.4)
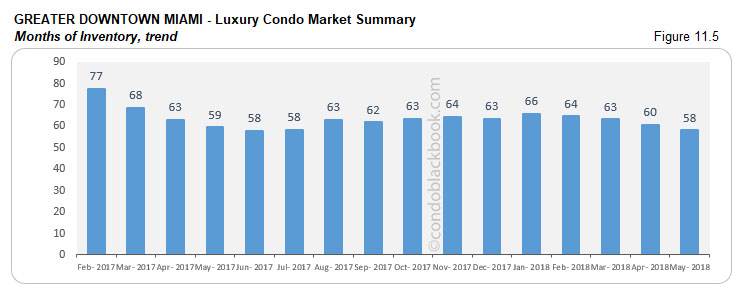
Another 4% reduction in months of inventory. We continue to see a positive downtrend in the months of inventory. There is a 4% decline over April and 2% decline year-over-year. However, at 58 months, inventory is still way off the 9-12-month mark of a balanced market. This gives buyers a big window of opportunity to search the Greater Downtown Miami area here for some spectacular deals.
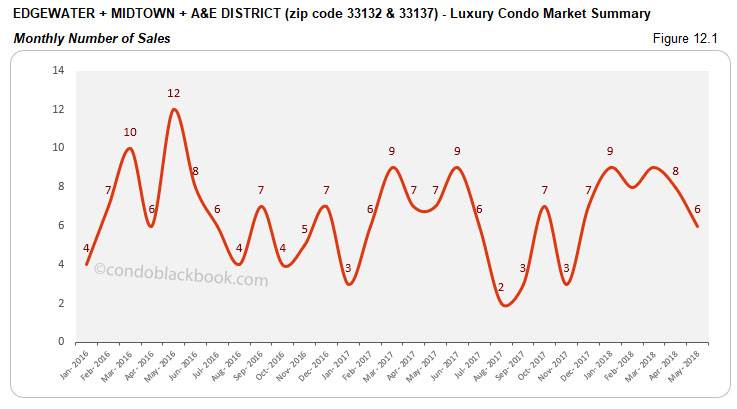
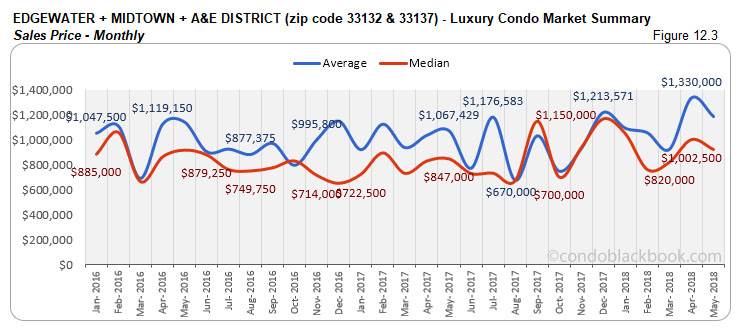
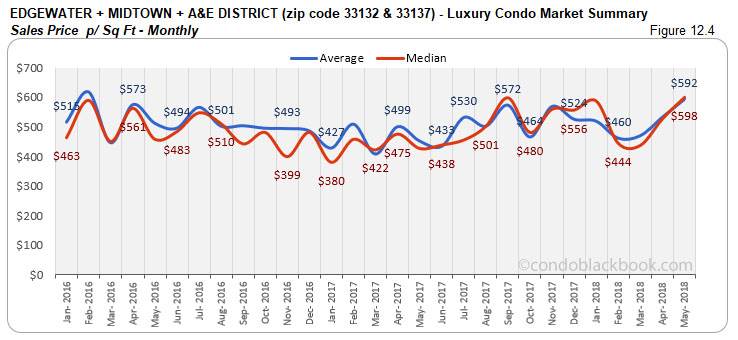
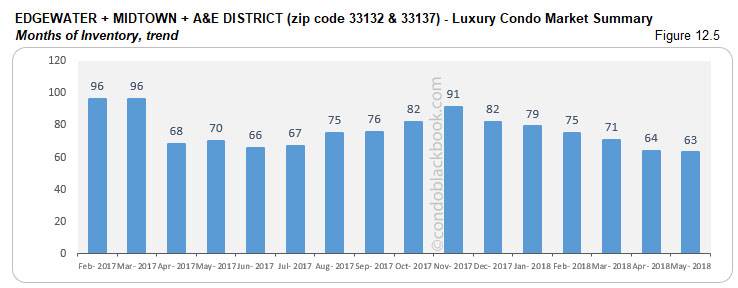
Edgewater + Midtown + A&E District Luxury Condo Market Summary (33132 + 33137 zip) back to top
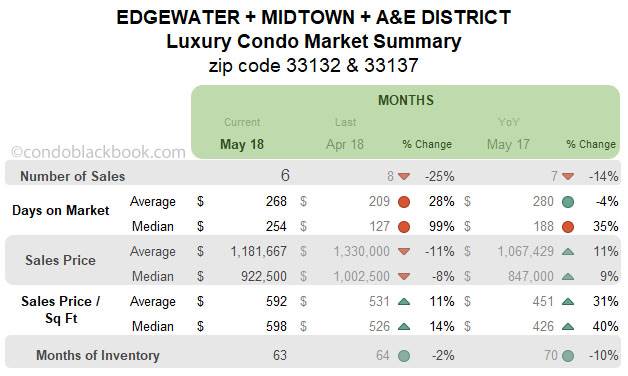
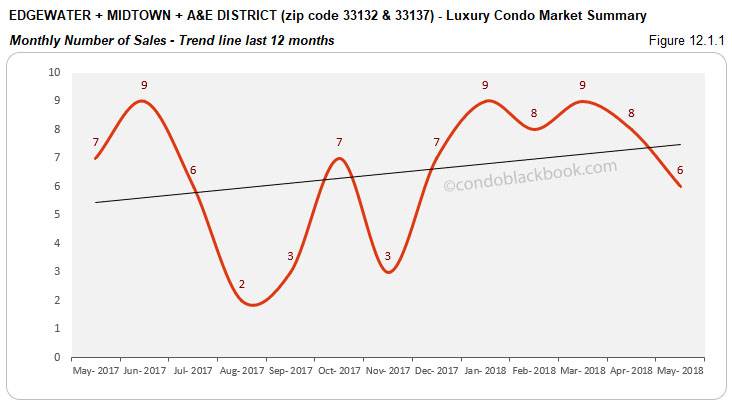
Slight slack in sales, but trend line remains positive. We see sales decline 25% against April and 14% year-over-year in this grouping. However, this slight reduction is only a marginal loss in the overall momentum, as the 12-month trend line stays positive in fig. 12.1.1.
Prices post mixed trends. We see the median sales price reduce 8% against April, but the price per sq. ft. increases 14%. Also, both the median price and price per sq. ft. trend higher than last year. (See fig. 12.3 and 12.4 below)
Inventory down 2%. We see a 2% reduction in inventory over April, and a 10% reduction year-over-year. However, at 63 months, this is one of the slowest moving markets in our study, and furthest from reaching the 9-12-month ideal of a balanced market. Buyers definitely retain the upper hand in negotiations and should browse through Edgewater condos for sale here or begin by exploring the individual lifestyle and condo options in Edgewater, Midtown and Arts & Entertainment District for a suitable pick.
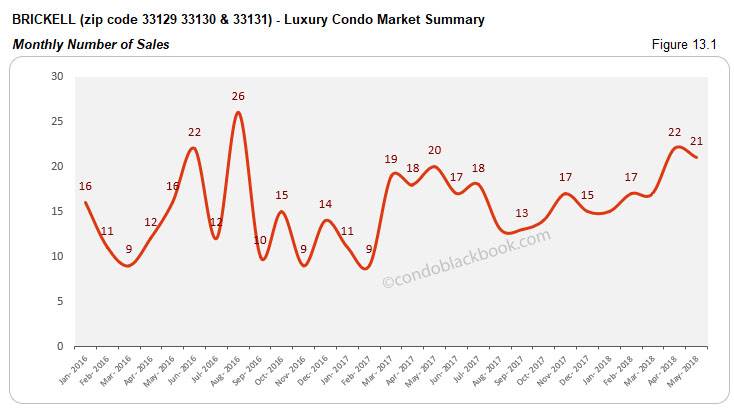
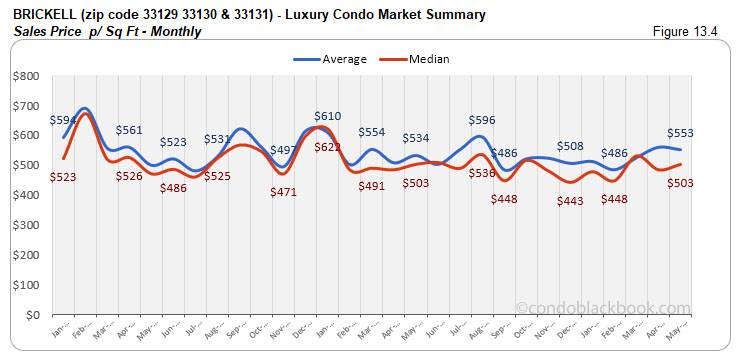
Brickell Luxury Condo Market Summary (33129, 33130, 33131 zip) back to top
.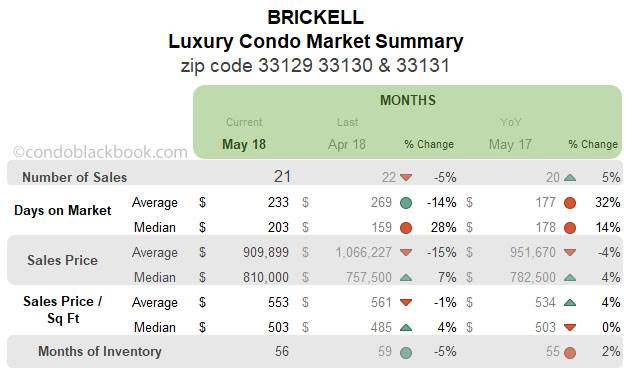
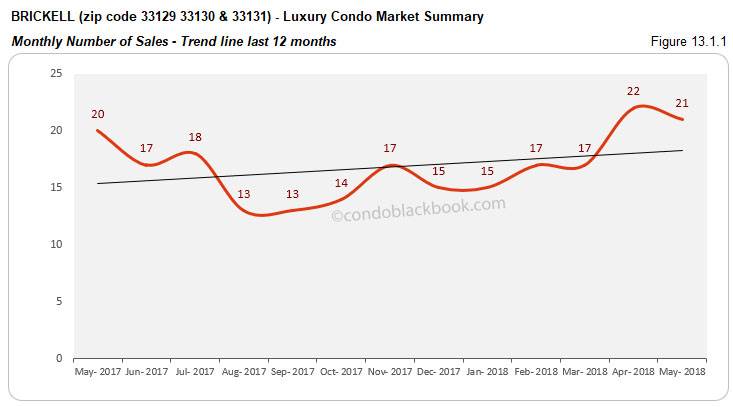
Sales hover with positive trend line. While there might be a 5% decrease in the month-to-month sales in Brickell, there is a 5% increase to report year-over-year. The 12-month trend line in fig. 13.1.1 too features a positive uptick. This just goes on to show that this slight slip in numbers did not affect the overall momentum in this business district.
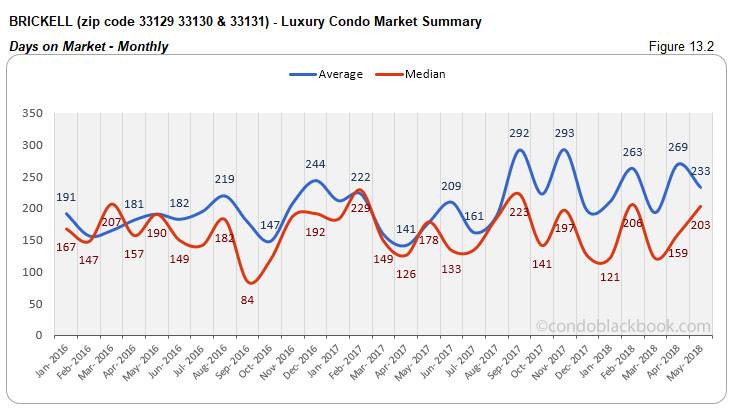
Days on market trek higher. We see another increase in the median days on market here. Luxury condos took 28% longer to get off the market compared to April and 14% longer year-over-year. Perhaps buyers and sellers are finding it tougher to come to a consensus in this business neighborhood.
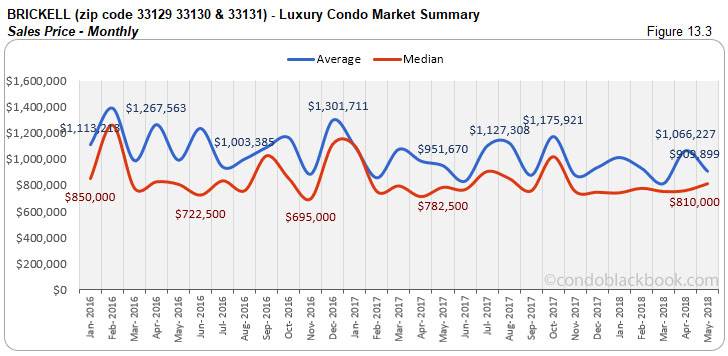
Slight upward variation in prices. Brickell reports an upward shift of 7% on the median prices and 4% on the price per sq. ft. month-to-month. Prices have more or less hovered for the past few months. (See fig. 13.3 and 13.4)
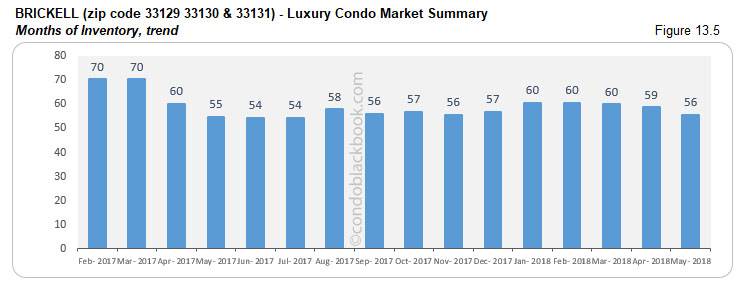
Small chip in otherwise high levels of inventory. We see months of inventory reduce 5% against April, but increase 2% year-over-year. At 56 months, inventory is way off the ideal 9-12-month mark of a balanced market. This gives buyers ample opportunity and choices to dictate deals as they search Brickell condos for sale here or take a tour through Brickell here.
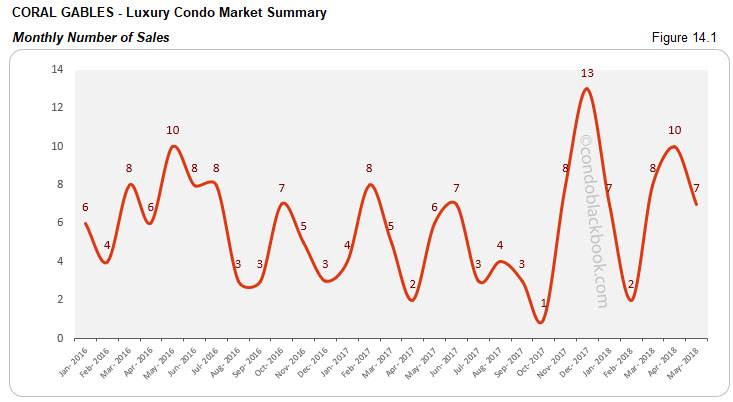
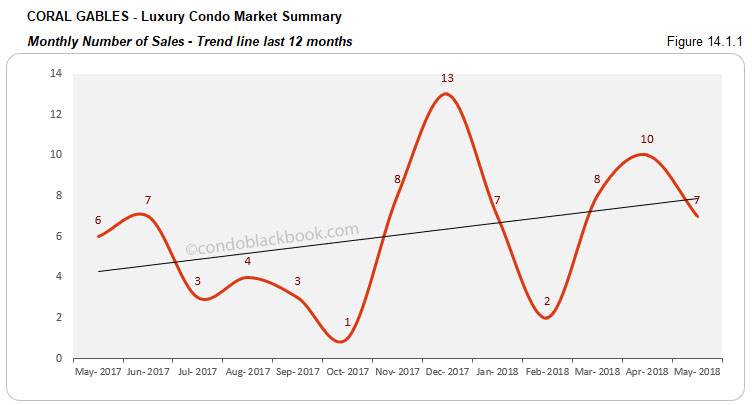
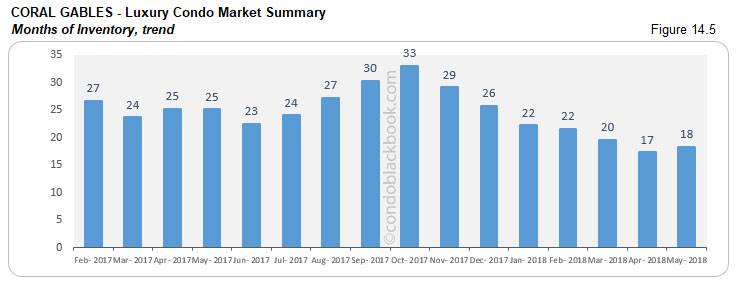
Coral Gables Luxury Condo Market Summary back to top
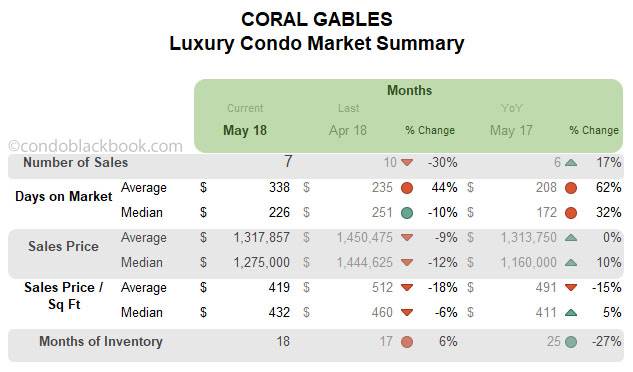
Sales dip slightly, but trend line stays positive. Coral Gables comes in with 30% lower sales compared to April. Nonetheless, this small market for luxury condos reports a 17% increase year-over-year. This keeps the 12-month trend line in fig. 14.1.1 positive, showing that momentum is not lost.
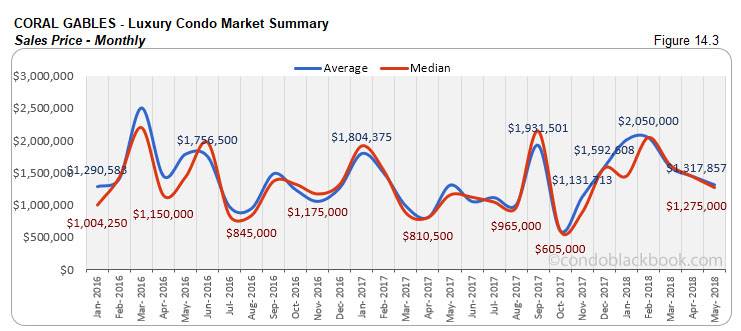
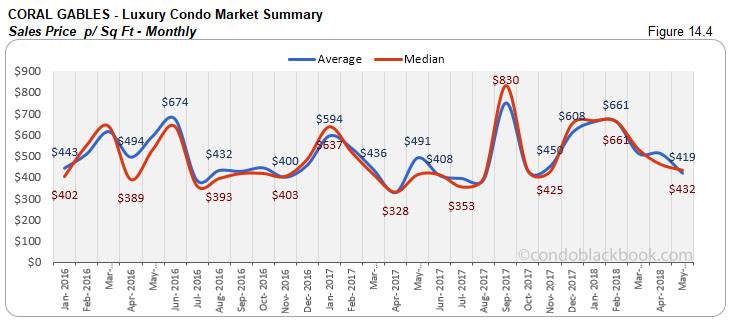
Mixed trends on prices. On one hand, we see the month-on-month median price and price per sq. ft. decline 12% and 6%, respectively. On the other, we see an increase of up to 27% in the year-over-year median price. (See fig. 14.3 and 14.4)
Big drop in year-over-year inventory. Even as the inventory increase 6% over April, we see a big reduction of 27% year-over-year. At 18 months, Coral Gables is one of the closest to achieving the ideal 9-12-month mark. With trends shifting towards a balance, buyers should be quick to grab deals by searching Coral Gables condos for sale here, or should start by checking out the lifestyle options in Coral Gables here.
Conclusion back to top
Market still tips in favor of buyers. We see the sales trends in May trying to initiate a positive shift with a general increase in numbers. However, the overall market weakness continues to rule and favor buyers. Another positive we see this month comes with a big chip off the months of inventory, giving sellers some hope and buyers a cue to make their move sooner.
Love what you see? Don’t forget to share our blog and subscribe (see the subscribe link on the top menu) to receive the latest market news in your inbox.
Have any questions? Or see something wrong with the stats? Please contact Sep at sniakan (at) hbroswell.com or call 305-725-0566.
Share your thoughts with us

Your Miami Condo Awaits
Recent Posts


 (305) 697-7667
 (786) 321-7233
  contact@condoblackbook.com

