


2021 has been one of the wildest years for the luxury condo market in Miami – and the numbers are here to speak for it. The buying frenzy that set 2021 on a record-breaking pace didn't wear off through to the end of the year. Owing to a healthy mix of domestic and international buyer demand, the luxury condo market in Miami posted its highest annual sales in over 6 years (of our reporting), showing incredible growth. On an annual basis, sales increased 221% over 202 and prices increased 11.7%/sq. ft.
Even as the last quarter of the year is known to report lower sales, due to the cyclical nature of the luxury housing market, Q4 2021 closed on an exceptionally strong note with the highest fourth quarter sales seen in more than 6 years. Overall, prices continued to increase and inventory reduced to its lowest levels in over 5 years. This, coupled with real-time observations in early 2022, leads us to expect that the luxury condo market in Miami has crossed a major maturity threshold in terms of sales volume and prices.
A closer look at the neighborhoods revealed Edgewater as one of the hottest markets for luxury condos in Miami – reporting the highest percentage sales growth in Q4 2021, as well as on an annual basis. Brickell followed as a close second. Also, Fisher Island ranked as the "most expensive" neighborhoods in 2021, maintaining its position as one of the most premium addresses in all of Miami.
Read on for a more detailed analysis of the annual and quarterly data on how prices, days on market, and inventory responded to strong buyer demand and more in our full-length Q4 2021 Miami Luxury Condo Market Report:
This luxury condo market report only includes data for properties priced $1 million and above, and covers the neighborhoods of Greater Downtown Miami (including Edgewater, Brickell, and Downtown), Miami Beach (inclusive of South Beach, Surfside, Bal Harbour, Sunny Isles Beach, and Fisher Island), as well as Coral Gables and Coconut Grove.
Overall Miami Luxury Condo Market Summary - 2021 |
||
Annual sales up 227.1% YoY -- luxury condo market outpaces previous years |
Overall luxury condo price/sq. ft. up by - 11.7% YoY |
Inventory drops to all-time low -- below 2020 & 2019 levels |
Overall Miami Luxury Condo Market Summary - Q4 2021 |
||
Quarterly sales up 111.5% YoY -- new record for a 4Q |
Overall luxury condo price/sq. ft. up by – 20.2% YoY |
Inventory marginally up to 9 months |
2021- Overall Miami Luxury Condo Market Highlights (Annual)
- Highest annual sales in over 6 years – 3 times those in 2020 & 2019 (pre-pandemic)
- Edgewater led annual sales growth in 2021-over-2020 analysis
- Overall Prices up
- Fisher Island was the most expensive neighborhood of 2021 with a median price of $1,481 /sq. ft., followed by South Beach at $1,235/sq. ft.
- Fisher Island offered maximum value to sellers with highest price per sq. ft. increase of 41% in 2021-over-2020 analysis
- Annual Days on Market decreased in 2021-over-2020 analysis
- Luxury condos in Coconut Grove and Coral Gables (combined) spent the lowest days on market (58 days) of all Miami neighborhoods
- Coconut Grove and Coral Gables (combined) reported the lowest year-end inventory (5 months) of all Miami neighborhoods
- Downtown Miami, Edgewater & Mid/North Beach posted the highest year-end inventory (15, 12, and 12 months) of all Miami neighborhoods
- 2021 closed as a strong seller's market, supported by record-breaking sales throughout, overturning the market's longstanding buyer-friendly standpoint
Q4 2021 - Overall Miami Luxury Condo Market Highlights
- Edgewater and Brickell were again Miami's most popular neighborhoods this last quarter, leading sales growth with a 350% and 314% increase year-over-year, respectively
- Record-breaking Q4 2021 posted highest quarterly sales in over 6 years, as well as higher sales than Q1 & Q3 of 2021
- 12-month sales trendline shifted to a flat-positive in Q4 2021 from soaring positive in Q3 2021
- Overall Prices were up – Median Sales Price increased 17.4%, while Price per Sq. Ft. increased 20.2%, year-over-year
- Fisher Island continued as the most expensive neighborhood in Q4 2021 with a median price of $1,477/sq. ft. – maintained top spot for 5 quarters in a row
- Surfside and Bal Harbour's luxury condos offered maximum value to sellers with highest percentage growth (88%) in year-over-year Price per Sq. Ft., knocking off Fisher Island from top spot in Q3
- All building segments (newly built to classic) reported strong sales growth in Q4 2021 – with buildings dated 2000-2014 again posting the highest sales volume of all for a 3rd time
- Sellers again received maximum return on investment (ROI) for condos built before 2000
- Days on Market were down 37% year-over-year
- Inventory was down 71.9% year-over-year to 9 months, owing to intense demand
- Seller's market held exceptionally strong
Table of Contents
- Overall Miami Luxury Condo Sales Trends
- Miami Neighborhood Trends - Number of Sales
- Overall Miami Luxury Condo Price Trends - Sales Price, Price/Square Foot
- Miami Neighborhood Trends - Sales Price, Price/Square Foot
- Overall Miami Luxury Condo Sales Price Trends by Building Year
- Overall Miami Luxury Condo Days on Market Trends
- Miami Neighborhood Trends - Days on Market
- Overall Miami Luxury Condo Inventory Trends
- Conclusion
- Where does the Miami Luxury Condo Market go from Here?
Overall Miami Luxury Condo Sales Trends
|
Q4 2021 vs Q4 2020 Overall Miami Luxury Condo Market Summary - Fig. 1.1 |
|||||||
|
Quarters |
Number of Sales |
% change in Sales |
Median Sale Price |
% change in Median Sale Price |
Median Sp/Sqft |
% change in Median Sp/Sqft |
Median of DOM |
|
Q4-2021 |
552 |
111.5% |
$1,750,000 |
17.4% |
$901 |
20.2% |
70 |
|
Q4-2020 |
261 |
$1,490,000 |
$749 |
111 |
|||
|
Q4 2021 vs Q4 2019 Overall Miami Luxury Condo Market Summary - Fig. 1.1a |
|||||||
|
Quarters |
Number of Sales |
% change in Sales |
Median Sale Price |
% change in Median Sale Price |
Median Sp/Sqft |
% change in Median Sp/Sqft |
Median of DOM |
|
Q4-2021 |
552 |
201.6% |
$1,750,000 |
9.4% |
$901 |
17.6% |
70 |
|
Q4-2019 |
183 |
$1,600,000 |
$766 |
126 |
|||
Q4 Sales up 111.5% year-over-year – highest-ever sales in a fourth-quarter
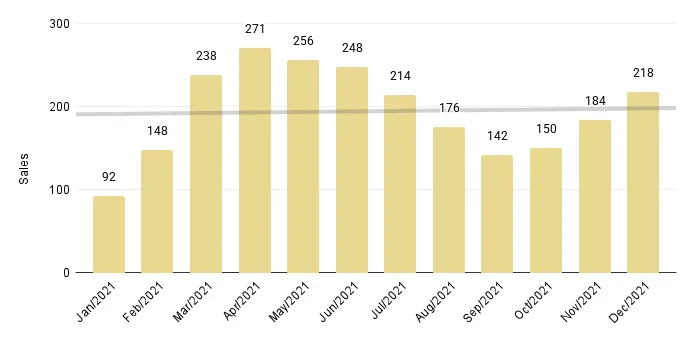
Owing to heightened domestic and international buyer demand, even though sales took a seasonal break (as seen in Fig. 1.3), Q4 2021 closed with more than double the sales in Q4 2020 or Q4 2019, posting the luxury condo market's best December yet:
- 4Q 2021 Sales Analysis – Overall Miami Luxury Condo Market
- Q4 2021 vs Q4 2020. Sales increased 111.5%, up from 261 in Q4 2020 to 552 for same quarter 2021. (Fig. 1.1)
- Q4 2021 vs Q4 2019. Sales increased 201.6%, up from 261 in Q4 2020 to 552 for same quarter 2021. (Fig. 1.1a)
Posting the highest sales in a fourth quarter in over 6 years of our reporting, Miami's luxury condo market closed on an incredibly strong note. As luxury condo experts, we expect the market to maintain its momentum into the first half of 2022, at least, powered by our low-tax, pro-business policies, and flexibility afforded by remote work.
|
2021 vs 2020 Overall Miami Luxury Condo Annual Market Summary - Fig. 1.1.1 |
|||||||
|
Quarters |
Number of Sales |
% change in Sales |
Median Sale Price |
% change in Median Sale Price |
Median Sp/Sqft |
% change in Median Sp/Sqft |
Median of DOM |
|
2021 |
2339 |
227.1% |
$1,715,000 |
5.5% |
$859 |
11.7% |
90 |
|
2020 |
715 |
$1,625,000 |
$770 |
127 |
|||
|
2021 vs 2019 Overall Miami Luxury Condo Annual Market Summary - Fig. 1.1.1a |
|||||||
|
Quarters |
Number of Sales |
% change in Sales |
Median Sale Price |
% change in Median Sale Price |
Median Sp/Sqft |
% change in Median Sp/Sqft |
Median of DOM |
|
2021 |
2339 |
225.8% |
$1,715,000 |
4.8% |
$859 |
13.7% |
90 |
|
2019 |
718 |
$1,636,500 |
$756 |
137 |
|||
Highest Annual Luxury Condo Sales in 6 years. Annual sales up 227.1% versus 2020 - highest since 2015 - flat-positive trendline
In tune with the record-breaking pace of the year, 2021 closed on an unprecedented note, posting more than three times the annual sales of 2020 or 2019 (pre-pandemic):
- Annual Sales Analysis – Overall Miami Luxury Condo Market
- 2021 vs 2020. Sales skyrocketed 227.1%, up from 715 annual sales in 2020 to 2,339 in 2021. (Fig. 1.1.1)
- 2021 vs 2019. Sales soared 225.8% higher, up from 718 annual sales in 2019 to 2,339 in 2021, showing exceptional progress even compared to a pre-pandemic market. (Fig. 1.1.1a)
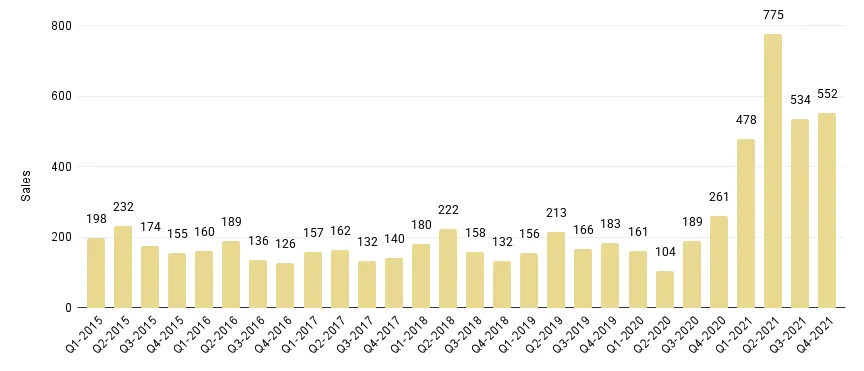
- 2021 Annual Sales were also significantly higher than any previous year under our review (Fig. 1.2).
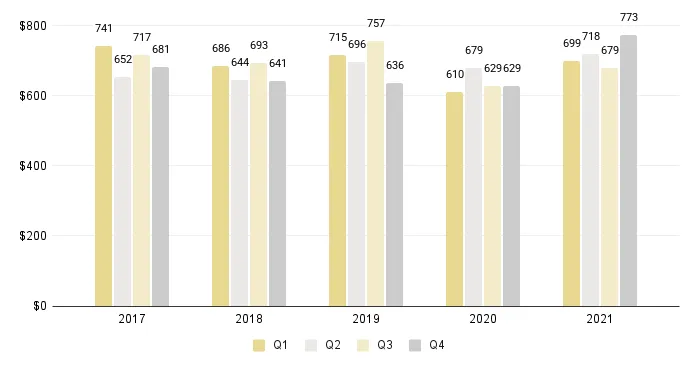
Overall Miami Quarterly Luxury Condo Sales 2015 - 2021 - Fig. 1.2
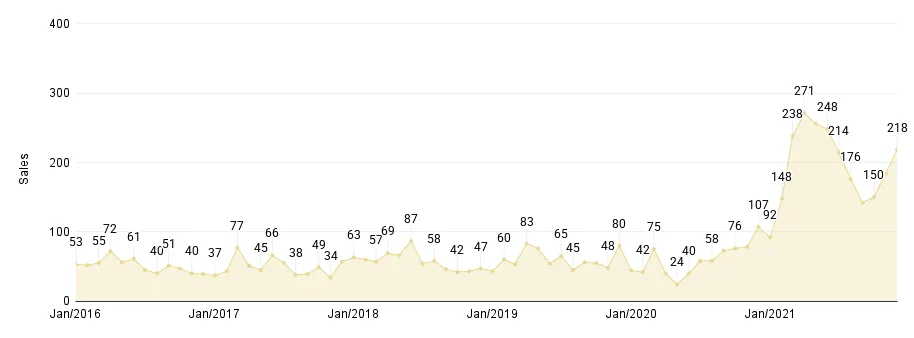
Overall Miami Monthly Luxury Condo Sales Jan. 2016 to Dec. 2021 - Fig. 1.3
Overall Miami 12-Month Luxury Condo Sales with Trendline - Fig. 1.4
Even with the highest annual sales seen in years, the 12-month Sales Trendline of Fig. 1.4 curved downwards to a flat-positive from a soaring positive trajectory in Q3 2021. This was mostly due to sales cooling off in Miami Beach, as most neighborhoods took a seasonal break from posting triple-digit growth (sales are known to peak during summers and dip during Q3 and Q4 every year in Miami).
Annual & Q4 2021 Miami Neighborhood Trends - Number of Sales
Annual Miami Neighborhood Luxury Condo Sales Comparison 2021-over-2020 - Fig. 1.5
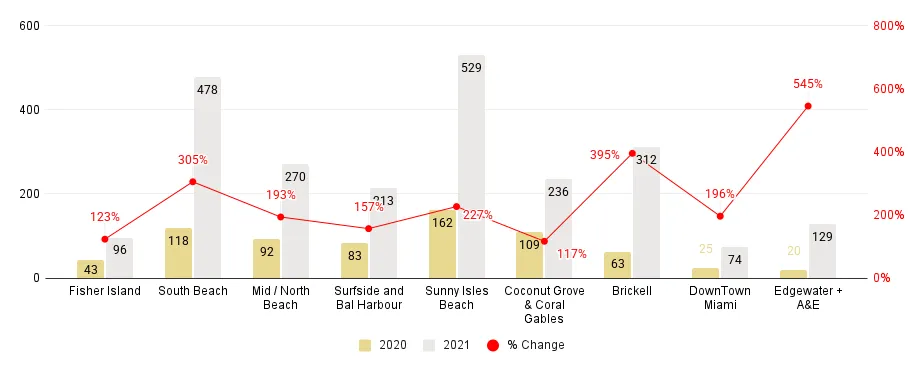
2021-over-2020 - Annual Sales Trends (Fig. 1.5)
- Winners: Edgewater reported the highest percentage sales growth (545%) compared to 2020, followed by Brickell (395%) and South Beach (305%)
- Up: All Miami neighborhoods reported an increase in annual sales – Sunny Isles Beach (227%), Downtown Miami (196%), Mid/North Beach (193%), Surfside & Bal Harbour (157%), Fisher Island (123%), and Coconut Grove & Coral Gables (117%)
Miami Neighborhood Luxury Condo Sales Comparison 4Q21-over-4Q20 - Fig. 1.5.1
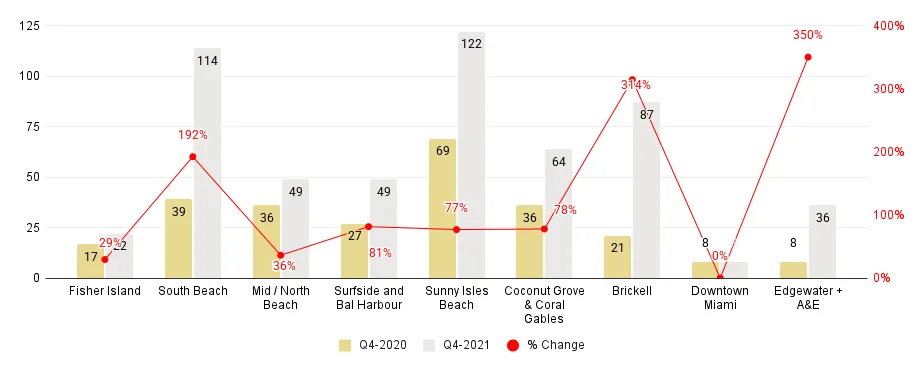
Q4 2021 Year-over-Year Neighborhood Sales Trends (Fig. 1.5.1)
- Winners: Edgewater reported the highest percentage (350%) growth in year-over-year sales, followed by Brickell (314%)
- Up: South Beach (192%), Surfside and Bal Harbour (81%), Coconut Grove & Coral Gables (78%), Sunny Isles Beach (77%), Mid/North Beach (36%), and Fisher Island (29%) -- all reported an increase in year-over-year sales
- Flat: Downtown Miami posted the same number of sales as Q3 2021
More in-depth analysis and details are available in dedicated reports for Greater Downtown Miami, Miami Beach and the Barrier Islands, plus Coral Gables & Coconut Grove.
Overall Miami Luxury Condo Prices Up - Annual + YoY
|
2021 vs 2020 Overall Miami Luxury Condo Annual Market Summary - Fig. 1.1.1 |
|||||||
|
Quarters |
Number of Sales |
% change in Sales |
Median Sale Price |
% change in Median Sale Price |
Median Sp/Sqft |
% change in Median Sp/Sqft |
Median of DOM |
|
2021 |
2339 |
227.1% |
$1,715,000 |
5.5% |
$859 |
11.7% |
90 |
|
2020 |
715 |
$1,625,000 |
$770 |
127 |
|||
Annual Price/Sq. Ft. up to $859, Median Price also up
Owing to intense buyer demand, prices went up across the board in 2021:
Annual Median Price Trends (Fig. 1.1.1 & 1.1.1a) – Overall Miami Luxury Condo Market
2021 vs 2020. Price per Square Foot increased by 11.7%, up from $770 in 2020 to $859 in 2021.
- Median Sales Price too increased by 5.5%, up from $1,625,000 in 2020 to $1,715,000 in 2021.
2021 vs 2019. Price per Square Foot increased by 13.7%, up from $756 in 2019 (pre-pandemic) to $859 in 2021.
- Median Sales Price too increased by 4.8%, up from $1,636,500 in 2019 (pre-pandemic) to $1,715,000 in 2021.
Q4 2020 Price per Sq. Ft. peaked to $901, Median Price up 17.4% Year-over-Year
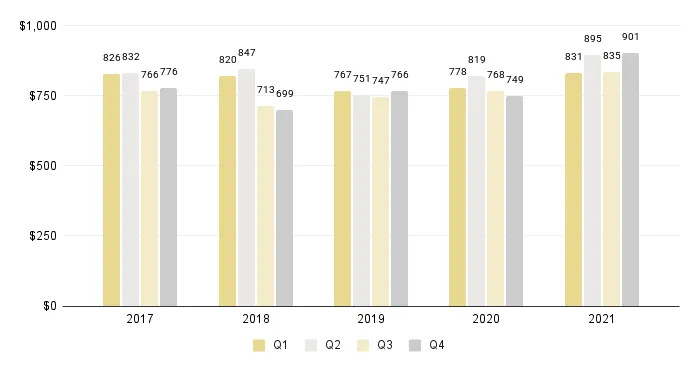
Closing the year with the highest Price per Square Foot recorded in over 5 years (Fig. 2.1), Q4 2021 posted a new peak of $901/square foot.
4Q 2021 Median Price Trends (Fig. 1.1 & 1.1a) – Overall Miami Luxury Condo Market
Q4 2021 vs Q4 2020. Price per Square Foot increased by 20.2%, up from $749 in Q4 2020 to $901 for same quarter 2021.
- Median Sales Price too increased by 17.4%, up from $1,490,000 in Q4 2020 to $1,750,000 for same quarter 2021.
Q4 2021 vs Q4 2019. Price per Square Foot increased by 17.6%, up from $766 in Q4 2019 to $901 in Q4 2021.
- Median Sales Price too increased by 9.4%, up from $1,600,000 in Q4 2019 to $1,750,000 in Q4 2021.
Overall Miami Luxury Condo Quarterly Price per Sq. Ft. 2017-2021 - Fig. 2.1
Miami Neighborhood Trends - Price per Square Foot & Sales Price
2021-over-2020 - Annual Neighborhood Price Trends
Median Price per Square Foot (Fig. 2.2)
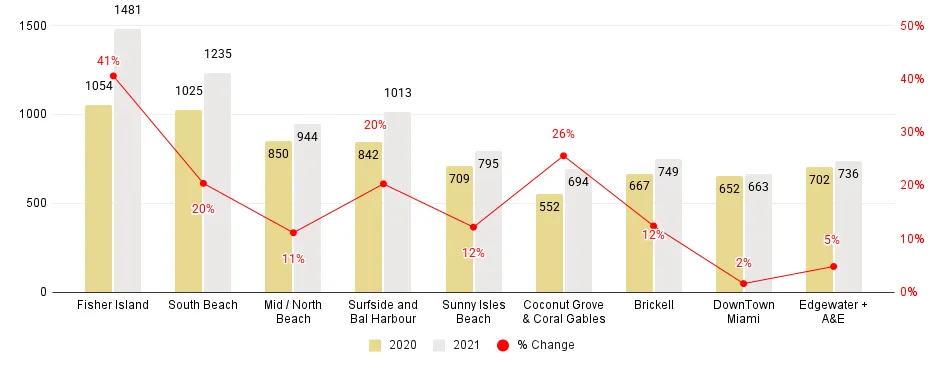
- Winner: Fisher Island continued as the most expensive neighborhood in Miami, fetching a median price of $1,481/sq. ft., followed by South Beach at $1,235/sq. ft.
- Winner:Fisher Island also reported the highest percentage growth in annual Median Price per Square Foot (41%), followed by Coconut Grove & Coral Gables (26%)
- Up: Other neighborhoods posting an increase in annual Median Price per Square Foot include South Beach (20%), Surfside & Bal Harbour (20%), Sunny Isles Beach (12%), Brickell (12%), Mid/North Beach (11%), Edgewater (5%), and Downtown Miami (2%)
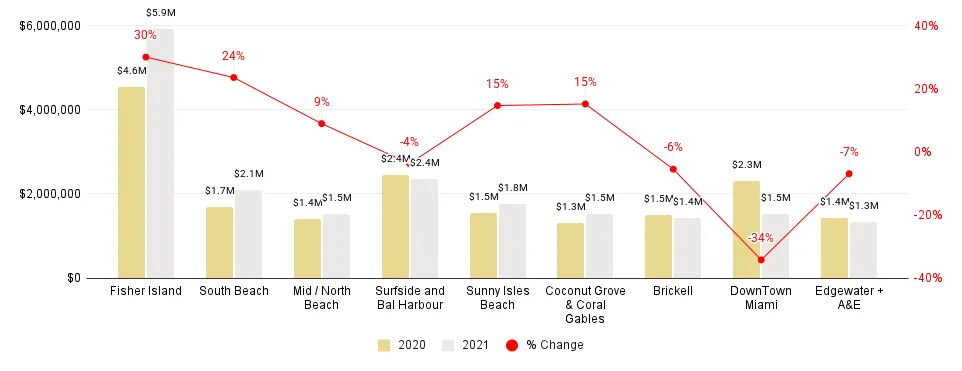
Median Sales Price (Fig. 2.3)
- Winner: Fisher Island reported the highest percentage growth in its annual Median Sales Price (30%)
- Winner: Fisher Island also reported the highest Median Sales Price for 2021 at $5.9 million, keeping its position as the most expensive neighborhood in Miami
- Up: Other neighborhoods reporting an increase in annual Median Sales Price – South Beach (24%), Sunny Isles Beach (15%), Coconut Grove & Coral Gables (15%), and Mid/North Beach (9%)
- Down: Neighborhoods reporting a decline in annual Median Sales Price -- Downtown Miami (-34%), Edgewater (-7%), Brickell (-6%), and Surfside & Bal Harbour (-4%)
Miami Neighborhood 2021-over-2020 Median Price per Sq. Ft. Comparison - Fig. 2.2
Miami Neighborhood 2021-over-2020 Median Sales Price Comparison - Fig. 2.3
Q4 2021 - Year-over-Year Neighborhood Price Trends
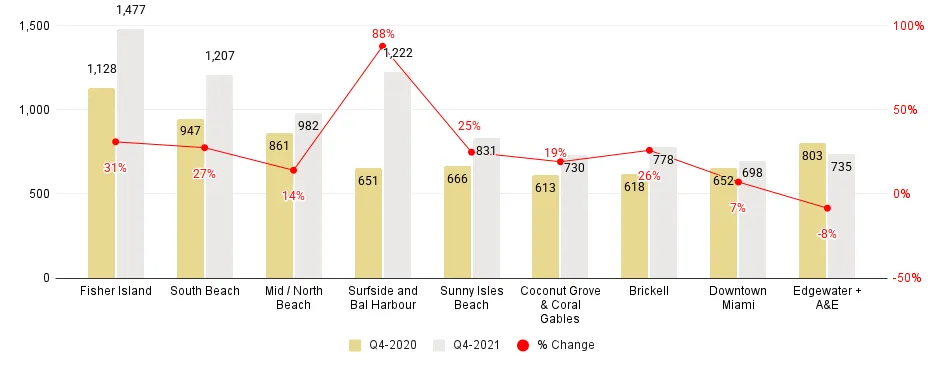
Median Price per Square Foot (Fig. 2.2.1)
- Winner: Fisher Island continued as the most expensive neighborhood in Miami by closing Q4 at a median price of $1,477/sq. ft.
- Winner: Surfside and Bal Harbour reported the highest percentage growth of 88% in year-over-year Price per Square Foot, replacing Fisher Island from the top spot in Q3 2021
- Up: Other neighborhoods reporting an increase in year-over-year Median Price per Square Foot -- Fisher Island (31%), South Beach (27%), Brickell (26%), Sunny Isles Beach (25%), Mid/North Beach (14%), Coconut Grove & Coral Gables (19%), and Downtown Miami (7%)
- Down: Edgewater reported a -8% decline in year-over-year Price per Square Foot
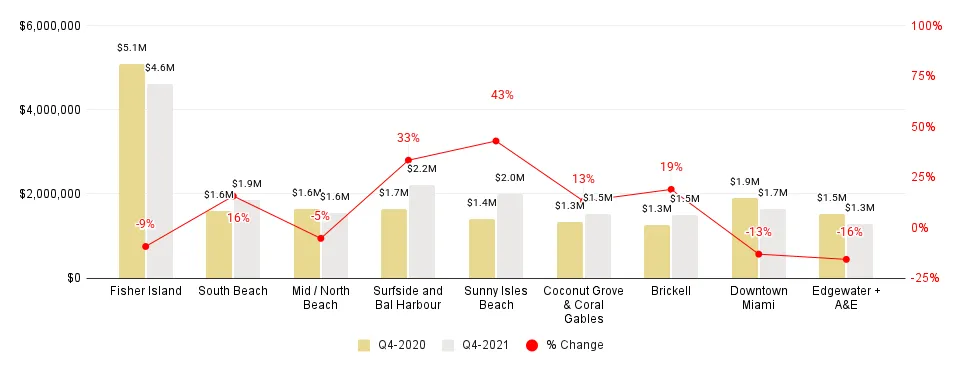
Median Sales Price (Fig. 2.3.1)
- Winner: Sunny Isles Beach reported the highest percentage growth in year-over-year Median Sales Price at 43%, replacing Fisher Island from the lead in Q3 2021
- Winner: Fisher Island continued reporting the highest Median Sales Price at $4.6 million for a 6th consecutive quarter
- Up: Other neighborhoods reporting an increase in year-over-year Median Sales Price -- Surfside and Bal Harbour (33%), Brickell (19%), South Beach (16%), and Coconut Grove & Coral Gables (13%)
- Down: Neighborhoods reporting a decline in annual Median Sales Price – Edgewater (-16%), Downtown Miami (-13%), Fisher Island (-9%), and Mid/North Beach (-5%)
Miami Neighborhood 4Q21-over-4Q20 Median Price per Square Foot. Comparison - Fig. 2.2.1
Miami Neighborhood 4Q21-over-4Q20 Median Sales Price Comparison - Fig. 2.3.1
Q4 2021 Overall Miami Sales Price Trends by Building Year
Below is a detailed analysis of how Miami luxury condo buildings performed in Q4 2021 on the basis of age of construction of the condo building, categorized as new construction buildings (2015-2021), buildings built from 2000-2014, and pre-2000 buildings.
- New Construction Buildings reported highest fourth-quarter sales to-date + good (+15.5%) year-over-year value
- Buildings Dated 2000-2014 continued being the most popular with the highest sales volume (253) of all 3 segments under review + a 22.5% increase in year-over-year value with price peaking to $905/sq. ft.
- Condos Built before 2000 also reported the highest sales in a fourth-quarter of all the years under review + offered the best value for sellers with a 22.9% increase in year-over-year value and price peaking to $773/sq. ft.
Miami New Construction Condos Built 2015-2021
Just like the overall trend, this freshly-built segment posted its highest sales in a fourth quarter to-date, in spite of posting a usual seasonal correction (Fig. 3.1). Reported volumes jumped from 71 sales in Q4 2020 to 175 sales in same quarter 2021 – posting a 146.5% year-over-year increase. Volumes were also 272.3% higher than the 47 sales of Q4 2019.
Not to mention, most pre-construction luxury condo projects in Miami have sold out before breaking ground. Many of these pre-construction sales are not recorded in centralized databases and thus, are not included in the quarterly sales data and reports.
Quarterly Overall Miami Luxury Condo Sales for Buildings Dated 2015-2021 - Fig. 3.1
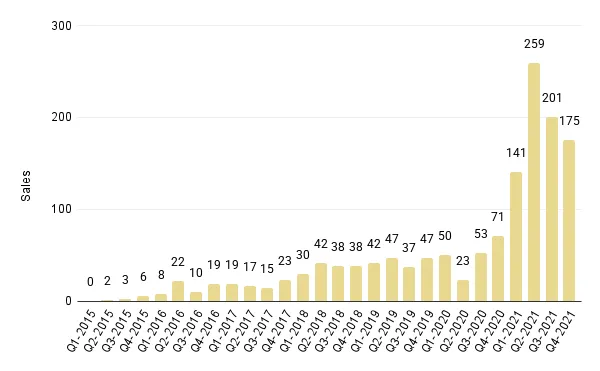
Fig. 3.2 reveals the Price per Square Foot for this newly-built segment increased 7% quarter-over-quarter as well as 15.5% year-over-year. Closing the quarter at $1,082/sq. ft., luxury condo sellers in this segment received good value compared to the previous year, as prices closed in the higher ranges.
Miami New Construction Luxury Condo Price per Square Foot (Buildings Built 2015-2021) - Fig. 3.2
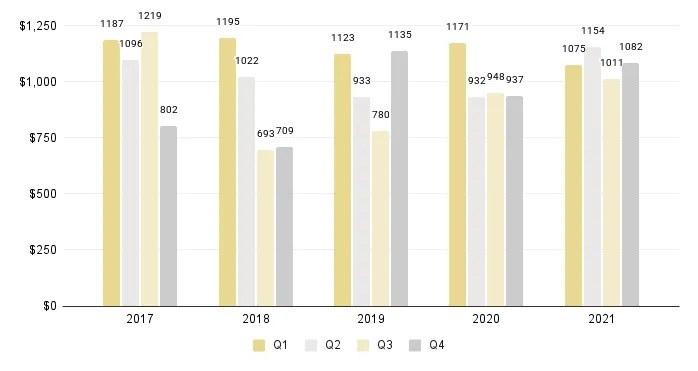
Miami Luxury Condos Built 2000-2014
Luxury condos built 2000-2014 posted their highest sales in a fourth quarter, as well as higher sales compared to Q3 2021 (Fig. 3.3). Volumes jumped from 127 sales in Q4 2020 to 253 sales in the same quarter 2021 – reporting a 99.2% year-over-year increase. Volumes were also 11% higher than Q3 2021 and 155.6% more than Q4 2019.
Just like the previous quarter, buildings built 2000-2014 were found to be the most popular among buyers in Q4 2021, reporting the highest sales volume of all 3 segments under review.
Quarterly Overall Miami Luxury Condo Sales (Buildings Dated 2000-2014) - Fig. 3.3
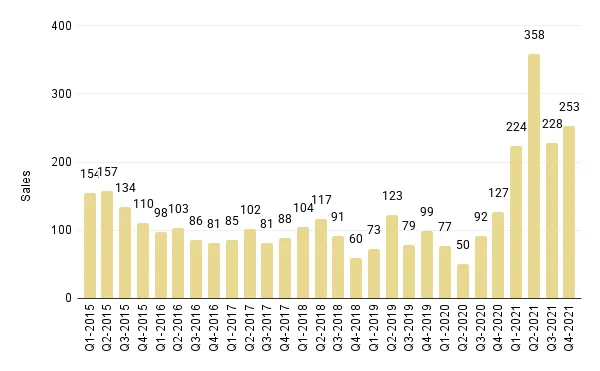
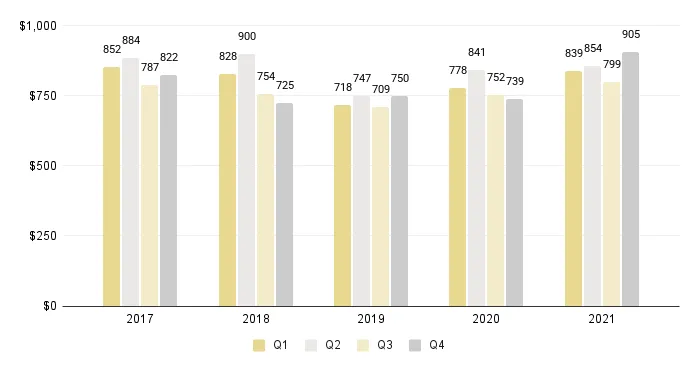
Fig. 3.4 below shows the Price per Square Foot increased 11.7% quarter-over-quarter as well as 22.5% year-over-year for luxury condos built 2000-2014. Closing the quarter at a peak of $905/sq. ft., luxury condo sellers received great value as prices closed at their highest point in over 5 years of our reporting.
Overall Miami Luxury Condo Price per Sq. Ft. (Buildings Dated 2000-2014) - Fig. 3.4
Miami Luxury Condos Built Before 2000
Miami's older luxury buildings (built pre-2000) also reported their highest sales in a fourth quarter, plus higher volume compared to Q3 2021 (Fig. 3.5). Volumes soared from 63 sales in Q4 2020 to 118 sales in the same quarter 2021 – reporting an 87.3% year-over-year increase. Volumes were also 15.7% higher than Q3 2021 and 218.1% more than Q4 2019.
Quarterly Overall Miami Luxury Condo Sales (Buildings Dated 1921-1999) - Fig. 3.5
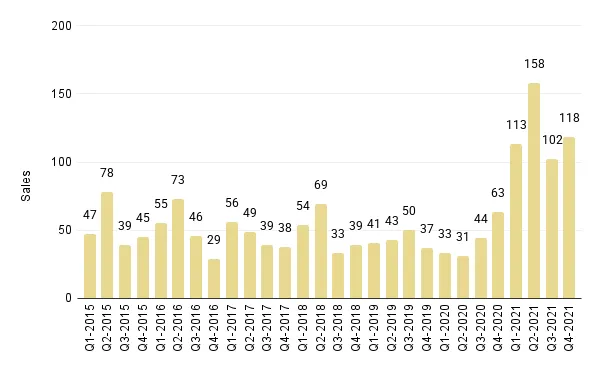
Fig. 3.6 below reveals the Price per Square Foot increased 12.2% quarter-over-quarter and 22.9% year-over-year for luxury condos built before 2000. Closing the quarter at a peak of $773/sq. ft., luxury condo sellers in this classic built segment received the best year-over-year value of all 3 segments under review.
Overall Miami Luxury Condos Price per Sq. Ft. (Buildings Dated 1921-1999) - Fig. 3.6
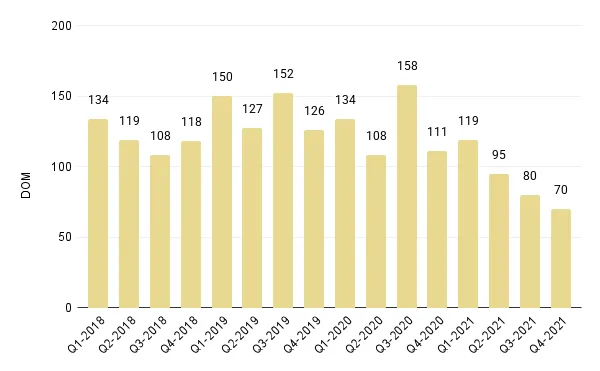
Overall Miami Luxury Condos - Days on Market Down Annually + YoY
Days on Market down 29.1% on annual basis and 37% 4Q21-over-4Q20
With sales continuing at a frenzied pace, the Days on Market (DOM) values dropped as expected throughout 2021. On an annual basis, it took luxury condos only 70 days to be sold in 2021 (median time from listing), capturing strong market demand and a vast improvement in buyer-seller dialogue in the Miami area.
- Annual Days on Market Analysis – Overall Miami Luxury Condo Market
- 2021 vs 2020. Days on Market declined 29.1%, showing luxury condos spent 37 fewer days on market compared to 2020. (Fig. 1.1.1)
- 2021 vs 2019. Days on Market dropped 34.3%, showing luxury condos spent 47 fewer days on market compared to the pre-pandemic market of 2019. (Fig. 1.1.1a)
- 4Q 2021 Days on Market Analysis – Overall Miami Luxury Condo Market
- Q4 2021 vs Q4 2020. DOM declined 37%, showing luxury condos spent 41 fewer days on market compared to Q4 2020. (Fig. 1.1)
- Q4 2021 vs Q4 2019. DOM dropped 44.4%, showing luxury condos spent 56 fewer days on market compared to the pre-pandemic market in Q4 2019. (Fig. 1.1a)
Overall Miami Luxury Condo Quarterly Days on Market 2018 - 2021 - Fig. 4.1
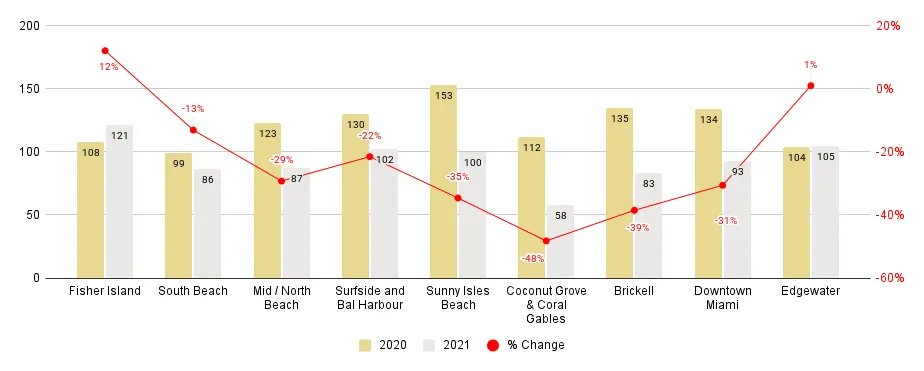
Miami Neighborhood Trends - Days on Market
Annual Neighborhood Days on Market Trends 2021-over-2020 (Fig. 4.2)
- Winner: Coconut Grove & Coral Gables (combined) posted the greatest decline of 54 days in their annual Median Days on Market (-48%)
- Down: A majority of the neighborhoods posted a decline in their Median Days on Market for luxury condos in Miami -- Brickell (-39%), Sunny Isles Beach (-35%), Downtown Miami (-34%), Mid/North Beach (-29%), Surfside & Bal Harbour (-22%), and South Beach (-13%)
- Flat: Edgewater reported negligible change (1%) in its annual Days on Market
- Up: Fisher Island (12%) reported an increase in its annual Median Days on Market
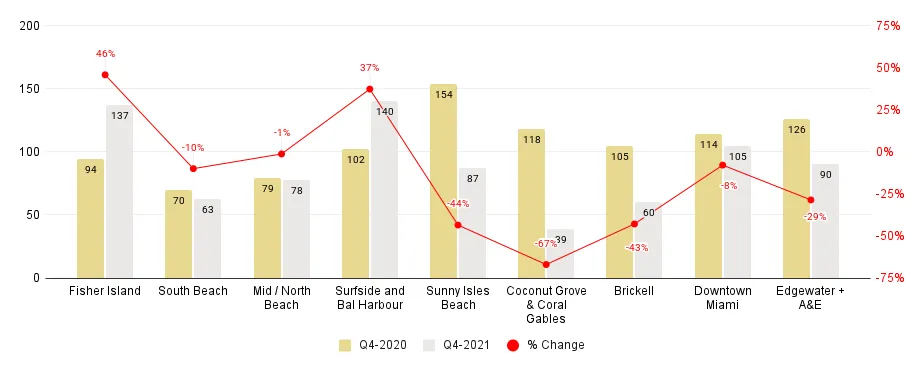
Q4 2021 Year-over-Year Neighborhood Days on Market Trends (Fig. 4.2.1)
- Winner: Coconut Grove & Coral Gables (combined) posted the greatest drop of 79 days in their year-over-year Median Days on Market (-67%)
- Down: A majority of the neighborhoods posted a decline in their Median Days on Market for luxury condos in Miami -- Sunny Isles Beach (-44%), Brickell (-43%), Edgewater (-29%), South Beach (-10%), and Downtown Miami (-8%)
- Flat: Mid/North Beach reported negligible change (-1%) in its year-over-year Days on Market
- Up: Neighborhoods reporting an increase in their Median Days on Market include Fisher Island (46%) and Surfside & Bal Harbour (37%)
Miami Neighborhood 2021-over-2020 Days on Market Comparison - Fig. 4.2
Miami Neighborhood 4Q21-Over-4Q20 Days on Market Comparison - Fig. 4.2.1
Luxury Condo Inventory at 9 months – Seller's Market Holds
Q4 2021 closes with 9 months of inventory
Heightened buyer demand continued shrinking luxury condo inventory in Miami throughout 2021. Closing the year with just 9 months of inventory, the trend stayed within the 9-12-month range of a balanced market, while still giving sellers complete control over negotiations (and the market). Year-end inventory was also at its lowest point seen in over 6 years of our reporting.
On an annual basis, inventory dropped from 32 months in December 2020 to 9 months at year-end 2021 – posting a decline of 71.9%. Compared to 44 months in December 2019, inventory dropped by an astounding 80% (Fig. 5.1). This major dip helped shift the market out of its buyer-friendly position (sustained for over 5 years) and into a more profitable, seller-friendly position.
On a quarter-over-quarter basis, inventory increased from 8 months in September 2021 to 9 months in December - a slight uptick of 12.5%. This marginal increase was quite expected as momentum took a cyclical break, pacing down from its summertime peak in Q2 2021. However, with fewer new construction deliveries and a feverish market pitch, we as luxury condo experts expect inventory to stay low for the immediate future.
With the current sellers' market holding strong, we continue seeing buyers placing multiple offers on luxury condos with most sellers getting above asking price. As buyer demand remains high, inventory is low and prices move higher, this would be a good time to sell.
For buyers, we recommend putting in a very strong offer on the luxury home they desire, or be prepared to wait a couple of cycles until the market cools down. However, the luxury condo market in Miami has crossed a major threshold, and we don't expect the market to fall back to 2016-2019 levels in terms of pricing.
Overall Miami Months of Luxury Condo Inventory from Mar. 2019 to Dec. 2021 - Fig. 5.1
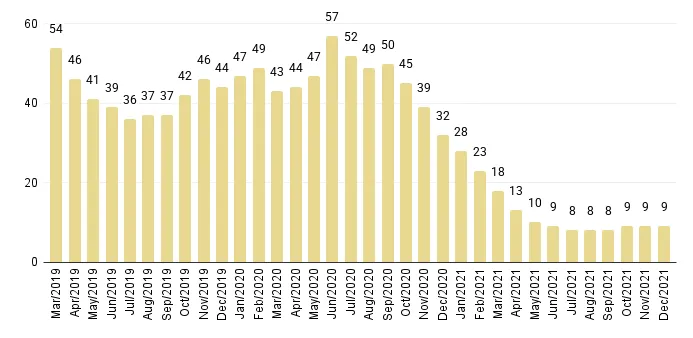
A balanced market has about 9-12 months of inventory. The months of inventory are calculated as the number of active listings + number of pending listings divided by the average number of deals in the last 6 months.
Miami Overall Luxury Condo Market - Annual & Q4 2021 Conclusion
Sellers' market strengthens with higher prices, strong market pace, and low levels of inventory
Closing 2021 on an equally impressive note as its start in Q1, the luxury condo market made great strides throughout the year. With the highest sales in a fourth quarter, Miami's luxury condo market reported 3 times (2,339) the annual sales of 2020 (715) or even the pre-pandemic volume of 2019 (718 sales). All Miami neighborhoods under review posted sales growth, with Edgewater and Brickell leading in progress and popularity.
Even with such strong momentum, the 12-month Sales Trendline shifted gears after posting a soaring positive curve for 4 consecutive quarters. In Q4 2021, the trendline declined to a flat-positive trajectory owing to Miami Beach neighborhoods catching their breath in the last quarter.
Regardless of this slight correction, the overall Days spent on Market dropped in Q4 2021 and on a 2021-over-2020 annual basis. This shows that buyers and sellers reached a consensus sooner and deals generally closed quickly in Miami. Owing to strong demand, luxury condo inventory too dropped to its lowest levels, closing the year with only 9 months of inventory – down an astounding 80% from its pre-pandemic closing of 44 months in December 2019.
On the price front, both the Median Sales Price and Price per Square Foot increased in a year-over-year review of Q4 2021 as well as 2021-over-2020 annual review – offering exceptional value to sellers. The Price per Square Foot in overall Miami peaked to $901 in Q4 2021, closing at the highest point in over 6 years of our reporting.
Buildings built 2000-2014 again recorded the highest sales volume out of all 3 segments (newly built to classic). And interestingly, the older luxury condo buildings of Miami (built before 2000) offered the highest value to sellers with a 22.9% increase in year-over-year prices – repeating the trend from Q3 2021.
With higher prices, shrinking inventory, and continued demand from domestic and overseas buyers, a sellers' market is in firm place in Miami. As luxury condo experts, we expect this sellers' cycle to continue throughout 2022. With owners receiving multiple competitive offers, most over the asking price, this is one of the best times to turn a profit on investment properties or second homes in Miami.
For buyers interested in browsing through the kind of inventory available on the market, you can search for all currently listed luxury condos for sale in Miami here.
Miami's Luxury Condo Market Prediction 2022: Where Does the Market Go From Here?
Off to a flying start, Miami's luxury condo market concluded 2021 on an equally spectacular note. Posting one of the strongest years on record, 2021 also marked a major market shift - transforming from a buyers' market (after almost 6 years) to a sellers' market.
Going into 2022, and based on early January data, we expect the following factors to shape and influence the luxury condo market's performance in Miami:
No income tax and pro-business appeal. In 2021, South Florida witnessed one of the greatest business migrations from the Northeast and Silicon Valley, turning Brickell into a true "Wall Street of the South." Along with these businesses came their people, fueling Miami's real estate market boom. As luxury condo market experts, we expect this boom to continue considering the charm of our no personal income tax and pro-business policies for the wealthy from high-tax states.
Remote work flexibility. With more individuals exercising their choice to work from home, we expect people to relocate to their dream home by the ocean such as in Sunny Isles Beach or close to tropical expanses and marinas like in Coconut Grove in 2022.
Further opening of international travel & safe investment haven. As a majority of the world population gets vaccinated, international travel restrictions continue to ease. This, coupled with Miami being a top favorite with South American (away from the political uncertainties of their home countries), as well as European buyers, we expect more people to land in Miami looking for a luxurious second home or investment condo with rental flexibility.
Inventory stays low. Although developers in Miami are in overdrive and fast-tracking pre-construction projects, most luxury condo projects are due for delivery in Q4 2023-Q1 2025. This, coupled with heightened buyer demand is expected to keep inventory levels low enough to support the current sellers' market for a couple of market cycles.
If you'd like more details on the data in our exclusive Condo Blackbook quarterly luxury condo market reports, please send us an email or call us anytime.
Love what you see? Share our blog and subscribe (see the subscribe link on the top menu) to receive authoritative and vetted Miami real estate market news in your inbox. Also, keep up with us on your favorite social media platforms. We're on Instagram, Facebook, and Twitter @blackbookproperties.