


As predicted in our previous quarterly report, Greater Downtown Miami's luxury condo market experienced a muted high season. This slowdown was largely driven by stubborn interest rates, negative media surrounding rising condo association fees, and broader uncertainty caused by rapid national policy shifts. As a result, inventory levels expanded further, in what is historically the most active time of year, reinforcing buyer leverage.
On the other hand, prices showed relative resilience in Q2 2025. While the price per square foot held steady year-over-year in the Greater Downtown Miami area, median sales prices posted double-digit gains, demonstrating that larger, well-positioned properties continued offering good returns across the Miami luxury condo segment.
Among the submarkets, Edgewater stood out as the most robust performer of Q2 2025 in Greater Downtown Miami with a median price of $1.6 million. The bayfront neighborhood not only retained its status as the most expensive market for luxury condos in this grouping, but also reported stable year-over-year sales activity. Downtown Miami, too, emerged as a market to watch, logging the highest year-over-year gains in price per square foot along with the lowest days on market.
We'll be closely monitoring how this urban core performs during the traditionally slower third quarter, as positive policy shifts begin taking effect in South Florida. (Details on these are covered towards the end of this report.)
Read below for our exclusive and in-depth analysis of how Greater Downtown, Edgewater, Brickell, and Downtown Miami performed in Q2 2025, along with a detailed comparison to the overall Miami luxury condo market trends in terms of sales, prices, days on market, and inventory this high season.
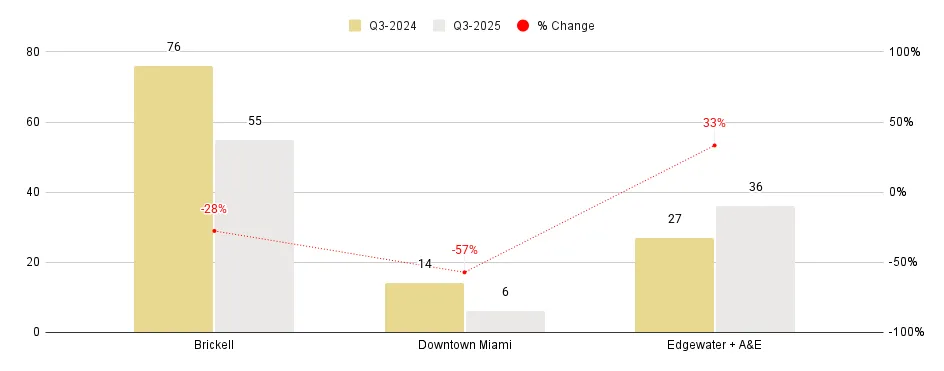
Overall Greater Downtown Miami Luxury Condo Markets at a Glance - Q2 2025 YoY (Sales Volume)
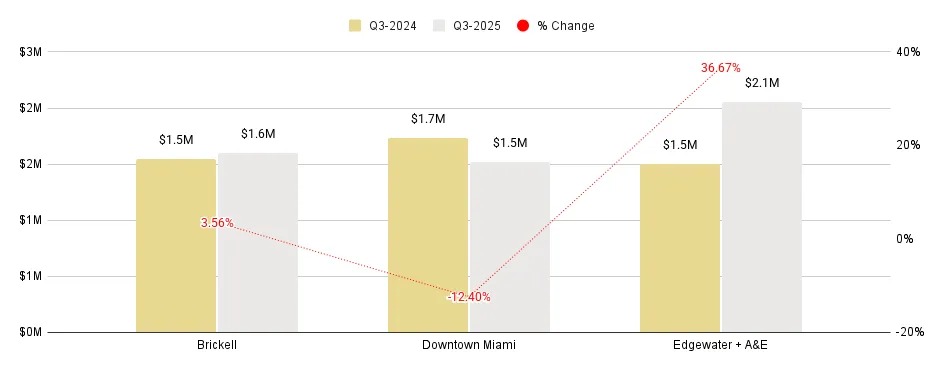
Overall Greater Downtown Miami Luxury Condo Markets at a Glance - Q2 2025 YoY (Median Sales Price)
Overall Greater Downtown Miami Luxury Condo Markets at a Glance - Q2 2025 YoY (Median Price/Sq. Ft.)

Summary of Q2 2025 for the Greater Downtown Miami area:
- Brickell had the highest sales volume (62 sales)
- Edgewater reported resilient sales, with stable YoY numbers
- Edgewater posted the highest median sales price ($1.6 million)
- Edgewater registered the highest price per square foot ($902)
For this report, we've only included areas with zipcodes 33129, 33130, 33131, 33132, 33137 – Brickell Hammock, Brickell, Brickell Key, Downtown Miami, Arts & Entertainment District, Edgewater, Wynwood, Midtown and the Design District. This luxury condo market report only features properties priced $1 million and above, and generally does not include pre-construction condo sales.
Q2 2025 - Greater Downtown Miami Area Luxury Condo Market Highlights
- Sales volumes dropped 18.7% year-over-year, reflecting a muted peak season.
- 12-month sales trendline remained negative between Q1 and Q2 2025.
- Price per Square Foot stayed flat year-over-year at $882.
- Median Sales Price went up 11.1% year-over-year to $1.5M.
- Days on Market went up 28.6% year-over-year to 90 days.
- Inventory went up to 25 months.
- Greater Downtown closed Q2 2025 as a buyer's market.
Q2 2025 - Greater Downtown Sub-Neighborhood Highlights
- Edgewater emerged as the most resilient market in Greater Downtown Miami, with steady year-over-year sales.
- 12-month sales trendline positive, except in Brickell.
- Luxury condos in Downtown provided the best year-over-year appreciation to sellers in Greater Downtown, with the highest percentage gains (5.1%) in price per square foot.
- Edgewater continued as the most expensive neighborhood in the Greater Downtown area, recording the highest price of $902/sq. ft. and highest median sales price at $1.6 million.
- Downtown Miami emerged as the fastest-selling market of Greater Downtown, as luxury condos took 83 days to sell on average.
- Edgewater reported the lowest levels of inventory in the Greater Downtown area.
Table of Contents
- Greater Downtown Miami Luxury Condo Sales Volume Trends
- Greater Downtown Miami Luxury Condo Price Trends
- Greater Downtown Miami Luxury Condo Days on Market Trends
- Greater Downtown Miami Luxury Condo Inventory Trends
- Edgewater Neighborhood Trends - Sales Volume
- Edgewater Neighborhood Trends - Sales Price, Price/Square Foot
- Edgewater Neighborhood Trends - Days on Market
- Edgewater Neighborhood Trends - Inventory
- Brickell Neighborhood Trends - Sales Volume
- Brickell Neighborhood Trends - Sales Price, Price/Square Foot
- Brickell Neighborhood Trends - Days on Market
- Brickell Neighborhood Trends - Inventory
- Downtown Neighborhood Trends - Sales Volume
- Downtown Neighborhood Trends - Sales Price, Price/Square Foot
- Downtown Neighborhood Trends - Days on Market
- Downtown Neighborhood Trends - Inventory
- Conclusion
|
Q2 2025 Greater Downtown Miami Luxury Condo Market Summary - Fig. 1 |
|||||||
|
Quarters |
Closed Sales |
% Change in Closed Sales |
Median Sale Price |
% Change in Median Sale Price |
Median Price/Sq. Ft. |
% Change in Median Price/Sq. Ft. |
Median DOM |
|
Q2 2025 |
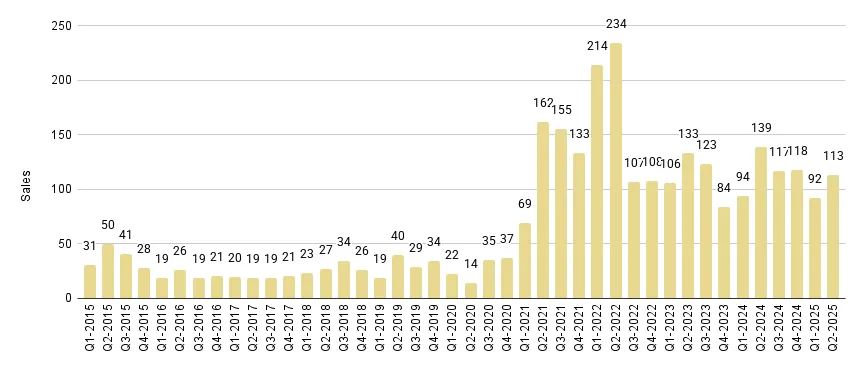
113 |
22.8% |
$1,500,000 |
4.9% |
$882 |
-4.6% |
90 |
|
Q1 2025 |
92 |
$1,430,000 |
$925 |
80 |
|||
|
Q2 2025 Greater Downtown Miami Luxury Condo Market Summary - Fig. 1.1 |
|||||||
|
Quarters |
Closed Sales |
% Change in Closed Sales |
Median Sale Price |
% Change in Median Sale Price |
Median Price/Sq. Ft. |
% Change in Median Price/Sq. Ft. |
Median DOM |
|
Q2 2025 |
113 |
-18.7% |
$1,500,000 |
11.1% |
$882 |
-1.1% |
90 |
|
Q2 2024 |
139 |
$1,350,000 |
$893 |
70 |
|||
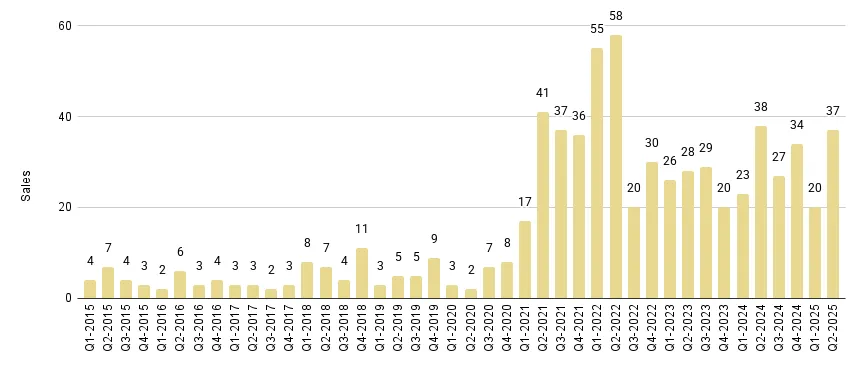
1. Q2 2025 Greater Downtown Miami Luxury Condo Sales Volume: Down YoY
Sales down 18.7% year-over-year; 12-month sales trendline negative
Echoing the overall Miami market sentiment of a below-average high season, Greater Downtown's luxury condo market also reported a dip in year-over-year performance, despite an increase in quarter-over-quarter volumes.
Further, activity in this urban core continued lagging behind the more resilient submarkets of Miami Beach (collectively) and Coconut Grove & Coral Gables (combined)—the same as in Q1—indicating that the Greater Downtown market remained most sensitive to the recent macroeconomic headwinds.
Below are the Key Q2 2025 Sales Statistics for Greater Downtown Miami:
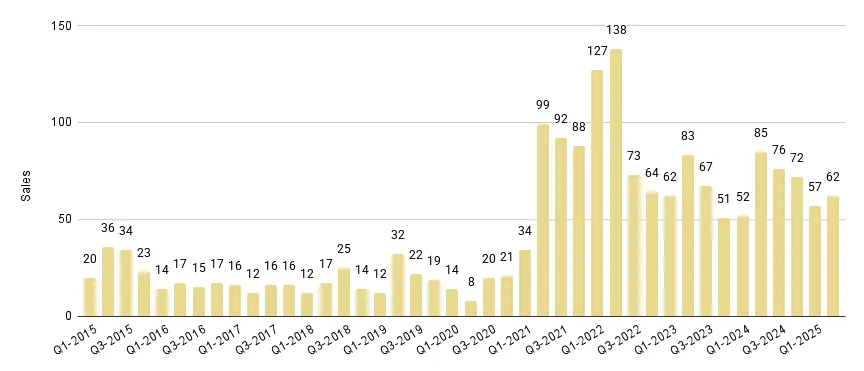
- Q2 2025 vs Q2 2024: Sales volume dropped 18.7%, down from 139 in Q2 last year to 113 in the same quarter this year. (Fig.1.1)
- Q2 2025 vs Q1 2025: Sales volume increased 22.8% quarter-over-quarter, up from 92 in the previous quarter to 113 in Q2 2025. (Fig. 1)
- Brickell remained the highest volume contributor within this Greater Downtown grouping, reporting 62 sales in Q2 2025. Meanwhile, Edgewater emerged as the most resilient market this second quarter, posting almost flat year-over-year sales volumes.
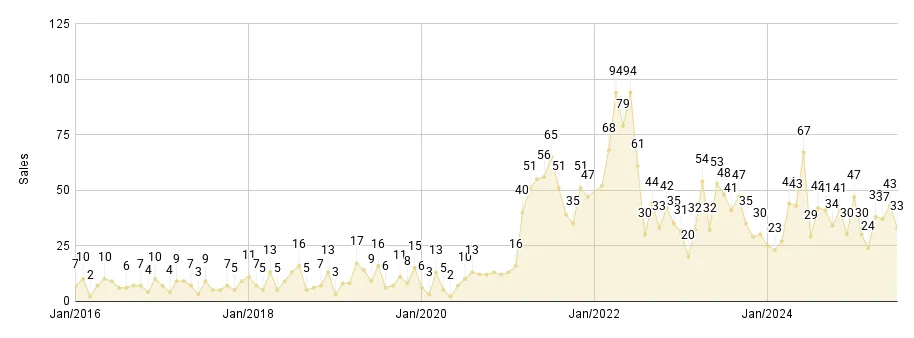
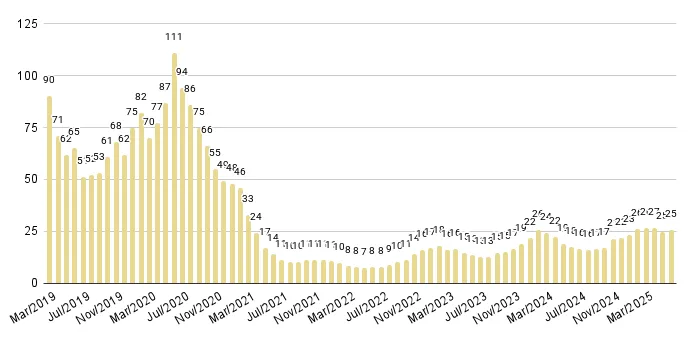
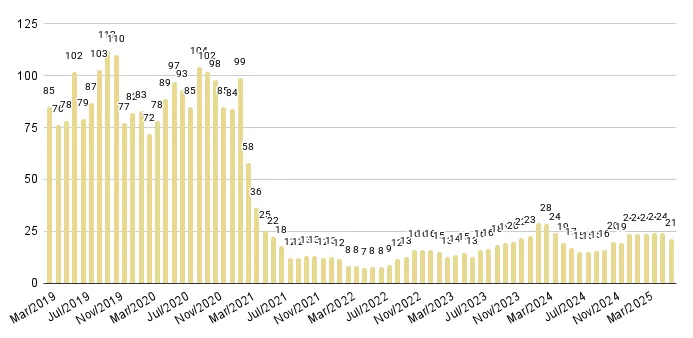
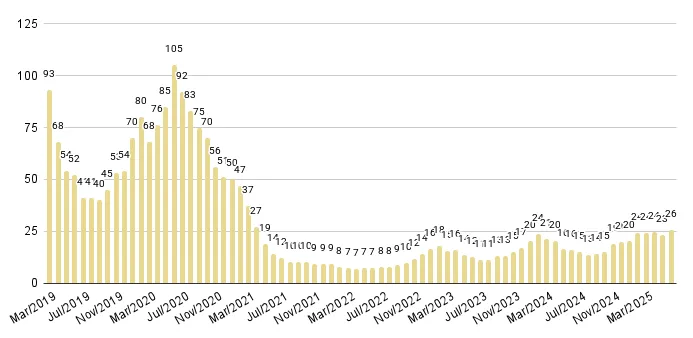
A look at the Monthly Sales chart (Fig. 2.2) shows how volumes closed lower than in 2024:
- April 2025 closed with 37 sales, lower than the previous year's 43 sales noted in the same month.
- May closed with 43 sales, also lower than the 67 sales recorded a year ago.
- June closed with 33 sales, slightly higher than the 29 sales recorded during the same month last year.
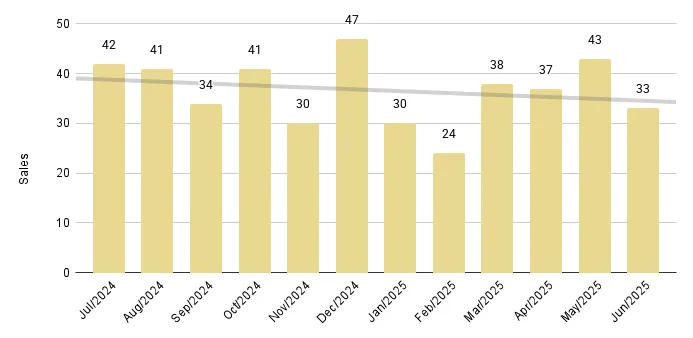
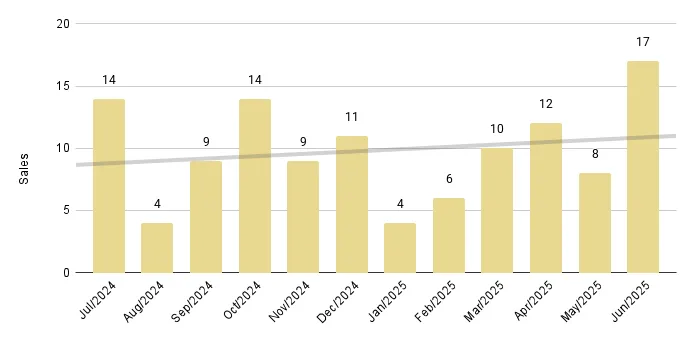
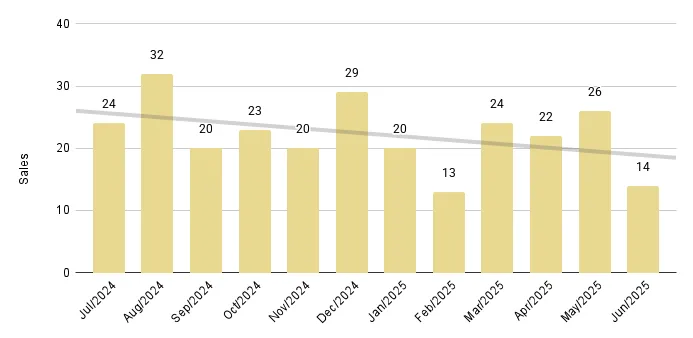
The 12-month Sales Trendline of Fig. 2.3 kept its negative trajectory between Q1 and Q2 2025. We expect the historically slower third quarter to remain somewhat quiet this year; however, with a slight chance of positive policy shifts to revive stalled buyer interest.
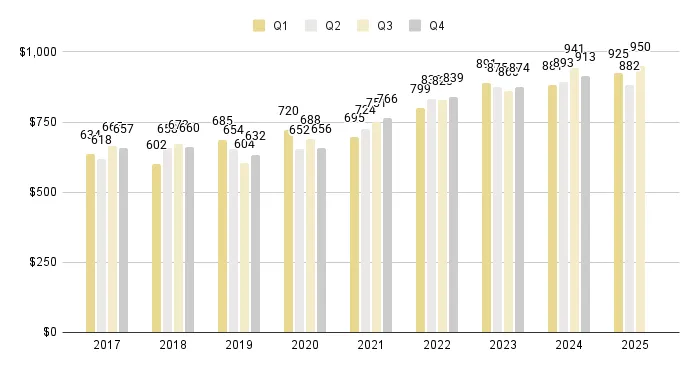
Greater Downtown Miami Luxury Condo Quarterly Sales 2015 - 2025 - Fig. 2.1
Greater Downtown Miami Luxury Condo Monthly Sales from Jan. 2016 to Jun.2025 - Fig. 2.2
Greater Downtown Miami Luxury Condo 12-Month Sales with Trendline - Fig. 2.3
2. Q2 2025 Greater Downtown Miami Luxury Condo Prices: Mixed Trends
Q2 2025 Price per Square Foot flat at $882; Median Price up year-over-year
Partly deviating from the overall Miami trend of an increase in year-over-year price per square foot and median price, Miami's urban core grouping reported the following Key Price Stats for Q2 2025:
- Q2 2025 vs Q2 2024: Price per Square Foot remained flat, adjusting only -1.1%, marginally down from $893 in Q2 2024 to $882 in the same quarter of 2025. (Fig. 1.1)
- Q2 2025 vs Q1 2025: Price per Square Foot remained flat quarter-over-quarter, adjusting -4.6%, slightly down from $925 in Q1 2025 to $882 this second quarter. (Fig. 1)
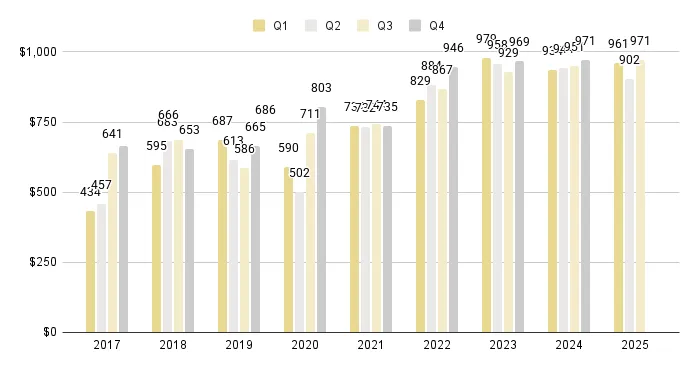
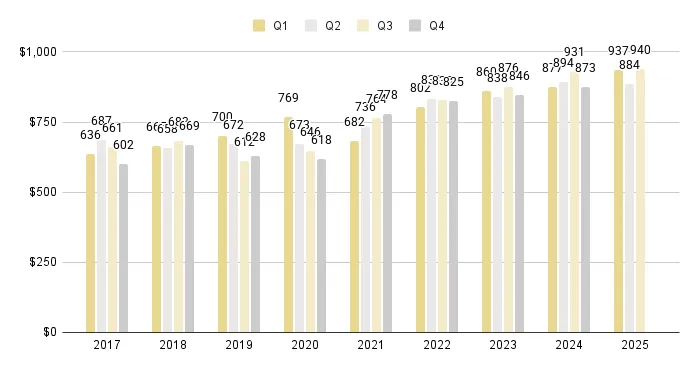
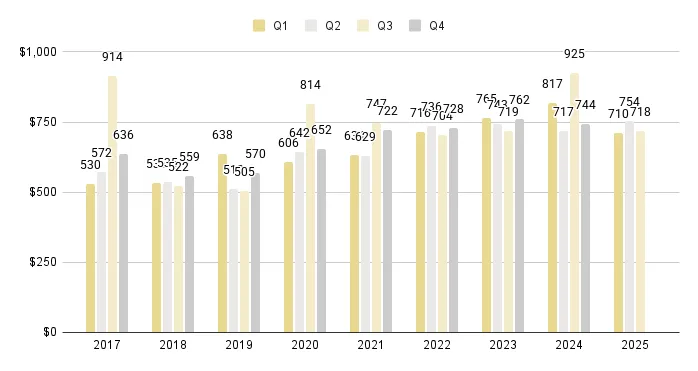
- A look at the 9-year snapshot of Quarterly luxury condo prices below (Fig. 3) reveals that the Price per Square Foot again closed in the highest ranges, confirming good returns for sellers despite this marginal dip.
- Q2 2025 vs Q2 2024: Median Sales Price increased 11.1%, up from $1,350,000 in Q2 2024 to $1,500,000 for the comparable quarter of 2025. (Fig. 1.1)
- Q2 2025 vs Q1 2025: Median Sales Price increased 4.9% quarter-over-quarter, up from $1,430,000 in Q1 2025 to $1,500,000 this second quarter. (Fig. 1)
- The above variation in Price per Square Foot and Median Sales Price stats indicates a shift in buyer preference towards larger layouts this second quarter.
Greater Downtown Miami Luxury Condo Quarterly Price per Sq. Ft. 2017-2025 - Fig. 3
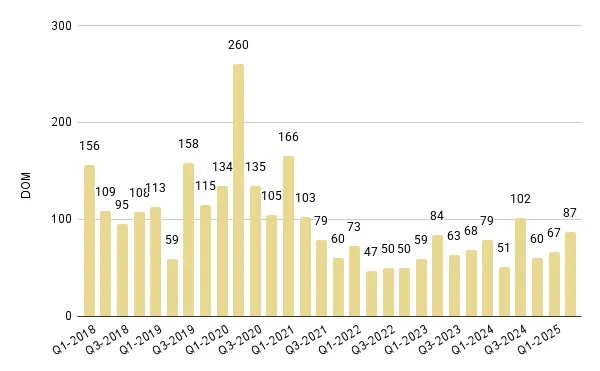
3. Q2 2025 Greater Downtown Miami Luxury Condo Days on Market: Up QoQ & YoY
Days on Market up 28.6% year-over-year
Reflecting the overall Miami market trend of an increase in quarter-over-quarter and year-over-year numbers, Greater Downtown Miami reported the following Days on Market (DOM) statistics:
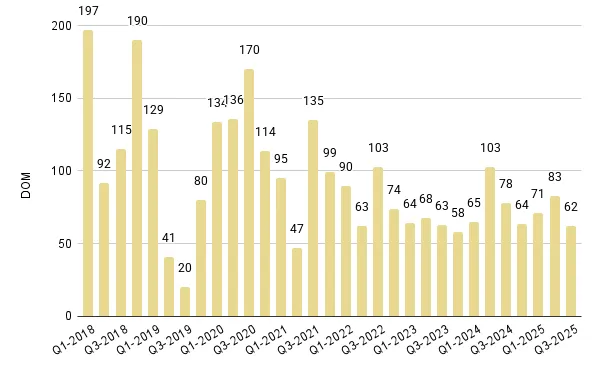
- Q2 2025 vs Q2 2024: Luxury condos stayed 20 days longer on the market compared to the same quarter a year ago, reporting a 28.6% increase in year-over-year stats. (Fig. 1.1)
- Q2 2025 vs Q1 2025: Luxury condos spent 10 more days on the market compared to Q1 2025, recording a 12.5% increase in quarter-over-quarter DOM. (Fig. 1)
- Taking 90 days on average to sell, luxury condos remained longer on the market this peak season as a result of buyer hesitation amid broader economic headwinds.
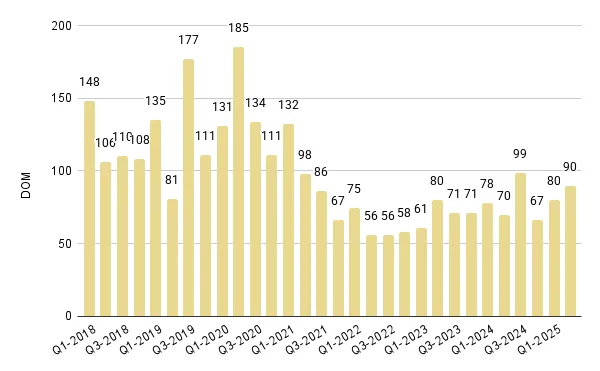
Greater Downtown Miami Luxury Condo Quarterly Days on Market 2018 - 2025 – Fig. 4
4. Q2 2025 Greater Downtown Miami Luxury Condo Inventory: Up YoY
Q2 2025 closed with 25 months of inventory
Aligning with the overall Miami market trend of lower quarter-over-quarter and higher year-over-year inventory, luxury condos in Greater Downtown Miami reported the following stats for Q2 2025:
- On a quarter-over-quarter basis, inventory was down from 26 months in March this year to 25 months in June 2025, recording a 3.8% decrease. (Fig. 5)
- On a year-over-year basis, inventory increased from 18 months in June 2024 to 25 months in June this year, posting a 38.9% uptick.
Greater Downtown Miami remained a strong buyer's market in Q2 2025, as inventory continued exceeding the 9-12-month range of a balanced market. This means buyers still get to have their pick of this surplus and lead negotiations. On the other hand, we recommend stronger marketing with flexible prices for sellers looking to succeed in this environment.
Speaking from our vast experience as a boutique brokerage serving the Greater Downtown Miami area for two decades, we anticipate inventory to climb further as we enter the traditionally slower half of the year—keeping the market buyer-friendly through the end of 2025 and into the first quarter of 2026 in Miami's urban core.
Want to live closer to work in Brickell or by the Bay in Miami's Edgewater neighborhood? Use our customizable search tool and browse luxury condos for sale in the Greater Downtown Miami area.
Greater Downtown Miami Luxury Condo Months of Inventory from Mar. 2019 to Jun.2025 - Fig. 5
A balanced market has only 9-12 months of inventory. The months of inventory are calculated as the number of active listings plus the number of pending listings divided by the average number of deals in the last 6 months.
Greater Downtown Miami Neighborhoods: Edgewater Market Trends (33132 and 33137)
|
Q2 2025 Edgewater Luxury Condo Market Summary – Fig. 6 |
|||||||
|
Quarters |
Closed Sales |
% Change in Sales |
Median Sale Price |
% Change in Median Sale Price |
Median Price/Sq.Ft. |
% Change in Price/Sq.Ft. |
Median DOM |
|
Q2 2025 |
37 |
85.0% |
$1,575,000 |
1.7% |
$902 |
-6.1% |
96 |
|
Q1 2025 |
20 |
$1,548,750 |
$961 |
103 |
|||
|
Q2 2025 Edgewater Luxury Condo Market Summary – Fig. 6.1 |
|||||||
|
Quarters |
Closed Sales |
% Change in Sales |
Median Sale Price |
% Change in Median Sale Price |
Median Price/Sq.Ft. |
% Change in Median Price/Sq.Ft. |
Median DOM |
|
Q2 2025 |
37 |
-2.6% |
$1,575,000 |
17.1% |
$902 |
-4.4% |
96 |
|
Q2 2024 |
38 |
$1,345,000 |
$944 |
101 |
|||
5. Q2 2025 Edgewater Luxury Condo Sales Volume: Flat – Most Resilient Market in Greater Downtown
Sales stable year-over-year; 12-month sales trendline positive
Partly deviating from the overall Miami market trend of lower year-over-year and higher quarter-over-quarter activity, Edgewater reported the following key sales statistics:
- Q2 2025 vs Q2 2024: Sales volume stayed almost flat, adjusting -2.6%, marginally down from 38 in Q2 last year to 37 sales in the same quarter of 2025. (Fig. 6.1)
- Q2 2025 vs Q1 2025: Sales volume soared 85% quarter-over-quarter, up from 20 in the previous quarter to 37 in Q2 2025. (Fig. 6)
It's worth noting that Edgewater emerged as the most resilient market this second quarter by reporting the least negative impact on year-over-year sales volume compared to other neighborhoods in this Greater Downtown analysis. And we believe some markets will have continued momentum into the third quarter, as buyers who were waiting in the first and second quarters enter the market.
Boosted by steady seasonal demand, the 12-month Sales Trendline of Fig. 7.2 transitioned back into a positive curve in Q2 2025 from a negative trajectory in Q1 2025.
Edgewater Luxury Condo Quarterly Sales 2015 - 2025 - Fig. 7.1
Edgewater Luxury Condo 12-Month Sales with Trendline - Fig. 7.2
6. Q2 2025 Edgewater Price per Square Foot: Down – Still Priciest in Greater Downtown
Q2 2025 Price per Square Foot down 4.4% to $902; Median Price up year-over-year
Partly deviating from the overall Miami trend of an increase in year-over-year price per square foot and median price, luxury condos in Edgewater reported the following positive Key Price Stats for Q2 2025:
- Q2 2025 vs Q2 2024: Price per Square Foot decreased 4.4%, down from $944 in Q2 a year ago to $902 in the same quarter this year. (Fig. 6.1)
- Q2 2025 vs Q1 2025: Price per Square Foot declined 6.1% quarter-over-quarter, down from $961 in Q1 2025 to $902 this second quarter. (Fig. 6)
- A closer look at the 9-year snapshot of Quarterly luxury condo prices below (Fig. 8) shows that the Price per Square Foot closed in its highest ranges, offering consistently good returns to sellers in this premium bayfront neighborhood.
Edgewater retained its position as the most expensive neighborhood in Greater Downtown, recording the highest Price per Square Foot at $902 and Median Sales Price at $1,575,000.
- Q2 2025 vs Q2 2024: Median Sales Price increased 17.1%, up from $1,345,000 in Q2 last year to $1,575,000 in the comparable quarter of 2025. (Fig. 6.1)
Edgewater Luxury Condo Quarterly Price per Sq. Ft. 2017-2025 - Fig. 8
7. Q2 2025 Edgewater Days on Market: Down QoQ & YoY
Days on Market down 5% year-over-year
Moving in contrast to the overall Miami market trend of an increase in quarter-over-quarter and year-over-year numbers, Edgewater reported the following Days on Market (DOM) statistics:
- Q2 2025 vs Q2 2024. Luxury condos spent 5 fewer days on the market compared to Q1 a year ago, reporting a 4% decrease in year-over-year stats. (Fig. 9)
- Q2 2025 vs Q1 2025. Luxury condos spent 7 fewer days on the market compared to Q1 2025, recording a 6.8% decrease in quarter-over-quarter DOM.
- At 96 days, the statistic shows relatively swifter closings even as the overall market experienced a slowdown.
Edgewater Luxury Condo Quarterly Days on Market 2018-2025 – Fig. 9

8. Q2 2025 Edgewater Inventory: Up YoY – Still Lowest in Greater Downtown
Q2 2025 closed with 21 months of inventory
Reflecting the overall Miami market trend of lower quarter-over-quarter and higher year-over-year inventory, luxury condos in Miami's Edgewater neighborhood reported the following statistics:
- On a quarter-over-quarter basis, inventory was down from 24 months in March 2025 to 21 months in June 2025, recording a 12.5% decline. (Fig. 10)
- On a year-over-year basis, inventory was up from 17 months in June 2024 to 21 months in June this year, reporting a 23.5% increase.
- At 21 months, inventory again closed above the 9-12-month range of a balanced market, giving buyers the upper hand.
- The bayfront neighborhood also continued reporting the lowest months of inventory in Greater Downtown Miami.
As a top seller's brokerage and agent in Edgewater, we can provide a complimentary evaluation of your luxury condo and position it to attract the best offers. Contact us and one of our expert, local real estate agents will guide you.
Edgewater Luxury Condo Months of Inventory from Mar. 2019 to Jun.2025 - Fig. 10
A balanced market has only 9-12 months of inventory. The months of inventory are calculated as the number of active listings plus the number of pending listings divided by the average number of deals in the last 6 months.
Greater Downtown Miami Neighborhoods: Brickell Market Trends (33129, 33130 and 33131)
|
Q2 2025 Brickell Luxury Condo Market Summary - Fig. 11 |
|||||||
|
Quarters |
Closed Sales |
% Change in Sales |
Median Sale Price |
% Change in Median Sale Price |
Median Price/Sq.Ft. |
% Change in Median Price/Sq.Ft. |
Median DOM |
|
Q2 2025 |
62 |
8.8% |
$1,480,750 |
0.7% |
$884 |
-5.6% |
87 |
|
Q1 2025 |
57 |
$1,470,000 |
$937 |
67 |
|||
|
Q2 2025 Brickell Luxury Condo Market Summary - Fig. 11.1 |
|||||||
|
Quarters |
Closed Sales |
% Change in Sales |
Median Sale Price |
% Change in Median Sale Price |
Median Price/Sq.Ft. |
% Change in Median Price/Sq.Ft. |
Median DOM |
|
Q2 2025 |
62 |
-27.1% |
$1,480,750 |
7.7% |
$884 |
-1.1% |
87 |
|
Q2 2024 |
85 |
$1,375,000 |
$894 |
51 |
|||
9. Q2 2025 Brickell Luxury Condo Sales Volume: Down YoY
Sales down 27.1% year-over-year; 12-month sales trendline negative
Echoing the overall Miami market trend of lower year-over-year and higher quarter-over-quarter volume, Brickell reported the following key sales statistics:
- Q2 2025 vs Q2 2024. Sales dropped 27.1%, down from 85 in Q2 last year to 62 sales for the same quarter in 2025. (Fig. 11.1)
- It's worth noting that Brickell has remained the top contributor to quarterly sales volume in Greater Downtown Miami since 2021—a nod to the financial district's enduring appeal as a key luxury housing market.
- Q2 2025 vs Q1 2025: Sales increased 8.8% quarter-over-quarter, up from 57 in the previous quarter to 62 in Q2 2025. (Fig. 11)
Owing to a lackluster high season, the 12-month Sales Trendline of Fig. 12.2 maintained a negative trajectory between Q1 and Q2 2025.
Brickell Luxury Condo Quarterly Sales 2015 - 2025 - Fig. 12.1
Brickell Luxury Condo 12-Month Sales with Trendline - Fig. 12.2
10. Q2 2025 Brickell Price per Square Foot: Flat YoY
Q2 2025 Price per Square Foot flat at $884; Median Price up year-over-year
Partly reflecting the overall market trend of an increase in year-over-year price per square foot and median price, luxury condos in Brickell reported the following positive Key Price Stats for Q2 2025:
- Q2 2025 vs Q2 2024: Price per Square Foot stayed flat, adjusting by -1.1%, marginally down from $894 in Q2 a year ago to $884 in the same quarter of 2025. (Fig. 11.1)
- Q2 2025 vs Q1 2025: Price per Square Foot decreased 5.6% quarter-over-quarter, down from $937 in Q1 2025 to $884 in Q2 2025. (Fig. 11)
A closer look at the 9-year snapshot of Quarterly luxury condo prices below (Fig. 13) reveals that price per square foot closed in the higher ranges in Q2 2025, indicating most sellers received good returns for their luxury condo investments in this financial district.
- Q2 2025 vs Q2 2024: Median Sales Price increased 7.7%, up from $1,375,000 in Q2 of the previous year to $1,480,750 for the same quarter in 2025. (Fig. 11)
Brickell Luxury Condo Quarterly Price per Sq. Ft. 2017-2025 - Fig. 13
11. Q2 2025 Brickell Days on Market: Up QoQ & YoY
Days on Market up 71% year-over-year
Following the overall Miami market trend of an increase in quarter-over-quarter and year-over-year numbers, Brickell reported the following Days on Market (DOM) statistics:
- Q2 2025 vs Q2 2024: Luxury condos stayed 36 days longer on the market compared to Q1 last year, logging a 71% uptick in year-over-year stats. (Fig. 14)
- Q2 2025 vs Q1 2025: Luxury condos spent 20 more days on the market compared to Q1 2025, posting a 30% increase in quarter-over-quarter DOM.
- At 87 days, the statistic reflects an uptick partly driven by extended decision-making times and partly by the return of older listings, which were likely paused and re-listed in anticipation of high season.
Brickell Luxury Condo Quarterly Median Days on Market 2018 – 2025 - Fig. 14
12. Q2 2025 Brickell Inventory: Up YoY
Q2 2025 closed with 26 months of inventory
Partly deviating from the overall Miami market trend of lower quarter-over-quarter and higher year-over-year inventory, luxury condos in Brickell reported the following statistics:
- On a quarter-over-quarter basis, inventory was up from 24 months in March 2025 to 26 months in June 2025, reporting an 8.3% increase. (Fig. 15)
- On a year-over-year basis, inventory was up from 16 months in June last year to 26 months in June 2025, posting a 62.5% uptick.
- At 26 months, inventory continued closing above the 9-12-month range of an ideal market, keeping the market buyer-friendly with an abundance of choices.
Brickell Luxury Condo Months of Inventory from Mar. 2019 to Jun.2025 - Fig. 15
A balanced market has only 9-12 months of inventory. The months of inventory are calculated as the number of active listings plus the number of pending listings divided by the average number of deals in the last 6 months.
Greater Downtown Miami Neighborhoods: Downtown Miami Market Trends (33128, 33132 and 33136)
|
Q2 2025 Downtown Miami Luxury Condo Market Summary - Fig. 16 |
|||||||
|
Quarters |
Closed Sales |
% change in Sales |
Median Sale Price |
% Change in Median Sale Price |
Median Price/Sq.Ft. |
% Change in Median Price/Sq.Ft. |
Median DOM |
|
Q2 2025 |
14 |
-6.7% |
$1,395,000 |
16.3% |
$754 |
6.1% |
83 |
|
Q1 2025 |
15 |
$1,200,000 |
$710 |
71 |
|||
|
Q2 2025 vs Q2 2024 Luxury Condo Quarterly Market Summary |
|||||||
|
Quarters |
Closed Sales |
% Change in Sales |
Median Sale Price |
% Change in Median Sale Price |
Median Price/Sq.Ft. |
% Change in Price/Sq.Ft. |
Median DOM |
|
Q2 2025 |
14 |
-12.5% |
$1,395,000 |
7.9% |
$754 |
5.1% |
83 |
|
Q2 2024 |
16 |
$1,292,500 |
$717 |
103 |
|||
13. Q2 2025 Downtown Miami Sales Volume: Down YoY
Sales down 12.5% year-over-year; 12-month sales trendline positive
Partly aligning with the overall Miami market trend of lower year-over-year and higher quarter-over-quarter volumes, Downtown Miami reported the following key sales statistics:
- Q2 2025 vs Q2 2024: Sales dipped 12.5%, down from 16 in Q2 2024 to 14 sales for the comparable quarter of 2025. (Fig. 16.1)
- Q2 2025 vs Q1 2025: Sales increased 6.7% quarter-over-quarter, up from 15 in the previous quarter to 14 in Q2 2025. (Fig. 16)
Owing to a surge in sales this May, the 12-month Sales Trendline of Fig. 17.2 transitioned from a negative trajectory in Q1 2025 to a positive curve in Q2 2025.
Downtown Miami Luxury Condo Quarterly Sales 2015 - 2025 - Fig. 17.1
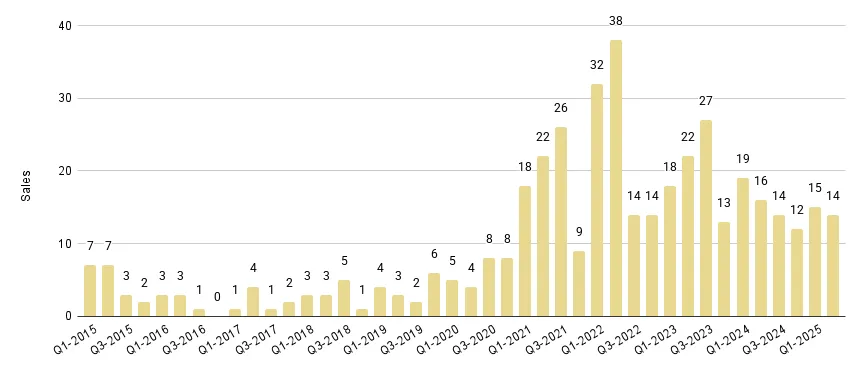
Downtown Miami Luxury Condo 12-Month Sales with Trendline - Fig. 17.2
14. Q2 2025 Downtown Miami Price per Square Foot: Up YoY – Highest Price Gains in Greater Downtown
Q2 2025 Price per Square Foot up 5.1% to $754; Median Price also up year-over-year
Aligning with the overall market trend of an increase in year-over-year price per square foot and median price, luxury condos in Downtown Miami reported the following Key Price Stats for Q2 2025:
- Q2 2025 vs Q2 2024: Price per square foot increased 5.1%, up from $717 in Q2 last year to $754 in the same quarter of 2025. (Fig. 16.1)
- Q2 2025 vs Q1 2025: Price per square foot increased 6.1% quarter-over-quarter, up from $710 in Q1 2025 to $754 this second quarter. (Fig. 16)
A closer look at the 9-year snapshot of Quarterly luxury condo prices below (Fig. 18) shows that the Price per Square Foot in Downtown closed in the upper ranges, indicating sellers received fair value for their luxury properties this second quarter.
While Downtown continued offering the most affordable entry point into Miami's luxury condo market for $754/Sq. Ft., the neighborhood also reported the highest year-over-year percentage gains (5.1%) of all the Greater Downtown neighborhoods under review.
- Q2 2025 vs Q2 2024: Median Sales Price increased 7.9%, up from $1,292,500 in Q2 a year ago to $1,395,000 in the comparable quarter of 2025. (Fig. 16.1)
Downtown Miami Luxury Condo Quarterly Price per Sq. Ft. 2017-2025 - Fig. 18
15. Q2 2025 Downtown Miami Days on Market: Up QoQ, Down YoY – Fastest-selling in Greater Downtown
Days on Market down 19% year-over-year
Partly reflecting the overall Miami trend of an increase in quarter-over-quarter and year-over-year numbers, Downtown Miami reported the following Days on Market (DOM) statistics:
- Q2 2025 vs Q2 2024: Luxury condos spent 20 fewer days on the market compared to Q1 2024, reporting a 19% decline in year-over-year stats. (Fig. 19)
- Q2 2025 vs Q1 2025: Luxury condos spent 12 more days on the market compared to Q1 2025, posting a 17% increase in quarter-over-quarter DOM.
- Downtown emerged as the fastest-selling market in Greater Downtown this second quarter, with luxury condos taking only 83 days to sell, indicating healthy buyer-seller communication.
Downtown Miami Luxury Condo Quarterly Median Days on Market 2018 – 2025 - Fig. 19
16. Q2 2025 Downtown Miami Inventory: Up YoY – Again Highest in Overall Miami
Q2 2025 closed with 33 months of inventory
Consistent with the overall Miami market trend of lower quarter-over-quarter and higher year-over-year inventory, luxury condos in Downtown Miami reported the following statistics:
- On a quarter-over-quarter basis, inventory was down from 42 months in March this year to 33 months in June 2025, reporting a 21.4% decline. (Fig. 20)
- On a year-over-year basis, inventory was up from 25 months in June 2024 to 33 months in June 2025, posting a 32% uptick.
- At 33 months, Downtown recorded the highest level of inventory in Greater Downtown Miami. Also, as inventory ranged above the 9-12-month benchmark of an ideal market, the neighborhood remained a solid buyer-favoring market with its surplus of choices.
Downtown Miami Luxury Condo Months of Inventory from Mar. 2019 to Jun.2025 - Fig. 20 balanced market has only 9-12 months of inventory. The months of inventory are calculated as the number of active listings plus the number of pending listings divided by the average number of deals in the last 6 months.
17. Q2 2025 Greater Downtown Miami Market Conclusion
Activity in Greater Downtown Miami continued to lag behind the more resilient submarkets of Miami Beach and the high-performing Coral Gables–Coconut Grove pairing, as this urban core segment logged a below-average high season.
Unlike the overall Miami market, the 12-month Sales Trendline for Greater Downtown Miami maintained a negative trajectory, leading us to expect a more pronounced slowdown through the traditionally softer third quarter. Still, both Edgewater and Downtown Miami showed positive trendline shifts in Q2, highlighting early signs of stabilization.
In Q2 2025, Edgewater emerged as the best-performing market in Greater Downtown—reporting stable year-over-year sales, whereas all other neighborhoods in this analysis reported declines.
Prices in Greater Downtown Miami showed resilience in line with the overall Miami market in Q2 2025, as median sales values remained strong. The Median Sales Price closed at $1.5 million, with an 11.1% year-over-year gain. Meanwhile, the Price per Square Foot remained steady at $882. However, as luxury condo market experts, we expect the current buyer's market to exert a bit of price pressure, limiting gains in the historically softer upcoming quarters.
A closer look revealed that Downtown Miami provided the best value to sellers this second quarter, recording the highest percentage gains of 5.1% in terms of year-over-year price per square foot. Edgewater maintained its position as the most expensive of all three sub-markets, again closing the quarter with the highest sales price of $1.6 million and price per square foot of $902.
Reflecting the overall Miami market sentiment and slower-than-usual high season, Greater Downtown also reported an increase in year-over-year Days on Market. On the contrary, Downtown Miami emerged as the fastest-selling submarket, with luxury condos averaging 83 days to sell.
As inventory was up across the board—much like the overall market trend—and closed above the 9-12-month range of a balanced market, Greater Downtown remained a solid buyer's market. This means buyers and investors have the leading edge in terms of wider selection and negotiation power.
That said, from our experience as luxury housing specialists, we've observed that well-marketed, appropriately priced properties still closed with gains. If you're looking to sell your Miami condo, contact us for an expert valuation and proven guidance on how to position your property to yield the highest possible returns in this competitive landscape.
Drawing on our expertise in Miami's luxury housing sector, we expect the following key drivers to influence market trajectory in the second half of 2025:
- We expect buyer interest to steadily rebuild through the remainder of 2025, as media coverage grows around the financial relief brought by double-digit insurance rate drops and House Bills 913 and 939 helping lower condo association fees. If momentum continues and Governor DeSantis' proposal to eliminate property taxes in South Florida gains traction, Miami could be poised for its next boom cycle.
- We expect HNWI and UHNWI to channel the generous tax breaks offered under President Trump's OBB Bill into second-home and primary residence purchases in Miami's low-tax landscape, especially considering the growing political and financial discontent in high-tax cities like New York.
- Further, while we expect the completion of preconstruction projects such as 501 First in Downtown Miami, The Standard Residences in Midtown Miami, and Una Residences in Brickell will keep Miami in the investor spotlight, an influx of new construction deliveries will also keep inventory elevated through to the end of the year.
|
Q2 2025 Trends Overview |
Overall Miami |
GDM |
Edgewater |
Brickell |
Downtown |
|
Sales |
Down |
Down |
Down |
Down |
Down |
|
Sales Trendline |
Positive |
Negative |
Positive |
Positive |
Positive |
|
Price/Sq. Ft. |
Up |
Flat |
Down |
Flat |
Up |
|
Days on Market |
Up |
Up |
Down |
Up |
Down |
|
Inventory |
Up |
Up |
Up |
Up |
Up |
Want more data and Miami market analyses? Subscribe (see the subscribe link on the top menu) to receive the latest market news in your inbox and share our blog.
Questions or comments about the stats? Interested in browsing the market? Contact Sep at sniakan (at) blackbookproperties.com or call 305-725-0566.