Condo Blackbook's exclusive 3Q 2020 analysis of Miami's luxury condo market shows that this segment of the residential real estate market, like single-family, is mounting a strong recovery from any initial COVID-19 pandemic effects. Sales recovered to post the strongest third quarter since 2015. Why? First off, Miami continues to be a desirable city for those moving from high-tax states. Additionally, companies allowing employees to work remotely just made it easier for those who've always wanted to escape extremely cold winters or relocate to a city with a beach lifestyle.
Secondly, Condo Blackbook's 3Q 2020 analysis shows that luxury condos in Miami are in high demand, particularly in Edgewater, which posted a 114% year-over-year growth in sales. Contrary to what most market experts had predicted about buyer focus shifting to single-family homes due to the pandemic, the high sales volume reported this quarter shows that Miami's luxury condos are in strong demand with buyers.
Read on for more data about how prices, days on market and inventory trends have changed as the market is emerging from the effects of the pandemic in our full-length Q3 2020 Miami Luxury Condo Market Report below:
This luxury condo market report only features properties priced $1 million and above, and covers the neighborhoods of Greater Downtown Miami (inclusive of Edgewater and Brickell), Miami Beach (inclusive of Surfside, Bal Harbour, Sunny Isles Beach and Fisher Island) as well as Coral Gables and Coconut Grove.
Overall Miami Luxury Condo Market Summary - 3Q 2020 |
||
Quarterly sales up by 9.6% YoY |
Overall luxury condo price/sq. ft. increases by 3.3% YoY |
Inventory levels reduce, but buyers retain advantage |
3Q 2020 Overall Miami Luxury Condo Market Highlights
- Edgewater leads Q3 sales growth with 114% year-over-year jump
- Mid/North Beach, Sunny Isles Beach, and Greater Downtown also report positive year-over-year sales
- 12-month sales trendline positive, shifting from negative in Q1 & Q2 to flat in Q3 2020
- Overall Prices Up - Median sales price up 9.6% and Price/sq. ft. by 3.3% year-over-year
- South Beach is the most expensive neighborhood of Q3-20, posting a median price of $1,106/sq. Ft., beating Fisher Island from top spot last quarter
- New construction buildings built 2015-2020 and 2000-2014 reported strongest sales growth
- Sellers received maximum return on investment for condos in luxury buildings built 2015-2020
- Days on Market stable year-over-year
- Inventory up year-over-year as expected, but 10% lower quarter-over-quarter, strongly hinting at a faster drop over next two quarters
- 2020 continues as a buyer's market with signs of a quick bounceback from COVID-19 impacts
Table of Contents
- Overall Miami Luxury Condo Sales Trends
- Miami Neighborhood Trends - Number of Sales
- Overall Miami Luxury Condo Price Trends - Sales Price, Price/Square Foot
- Miami Neighborhood Trends - Sales Price, Price/Square Foot
- Overall Miami Luxury Condo Sales Price Trends by Building Year
- Overall Miami Luxury Condo Days on Market Trends
- Miami Neighborhood Trends - Days on Market
- Overall Miami Luxury Condo Inventory Trends
- Conclusion
- Where does the Miami Luxury Condo Market go from Here?
Luxury Condo Sales Up in Miami Overall
Overall Miami Luxury Condo Quarterly Market Summary - Fig. 1.1
|
Quarters |
Number of Sales |
% change in Sales |
Median Sale Price |
% change in Median Sale Price |
Median Sp/Sqft |
% change in Median Sp/Sqft |
Median of DOM |
|
Q3 2020 |
182 |
9.6% |
$1,805,000 |
9.6% |
$771 |
3.3% |
158 |
|
Q3 2019 |
166 |
$1,646,500 |
$747 |
152 |
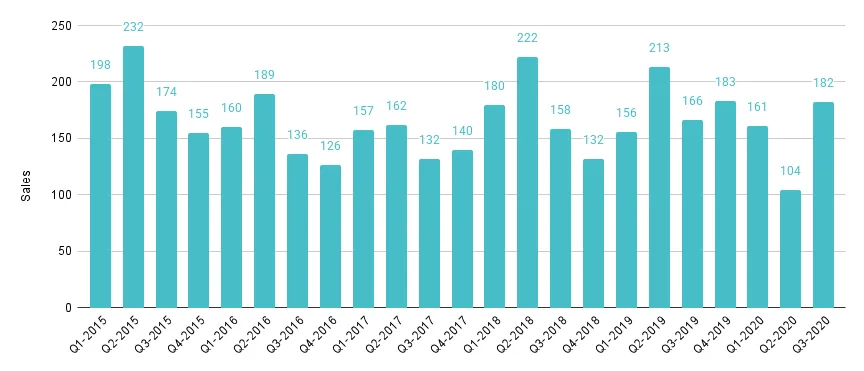
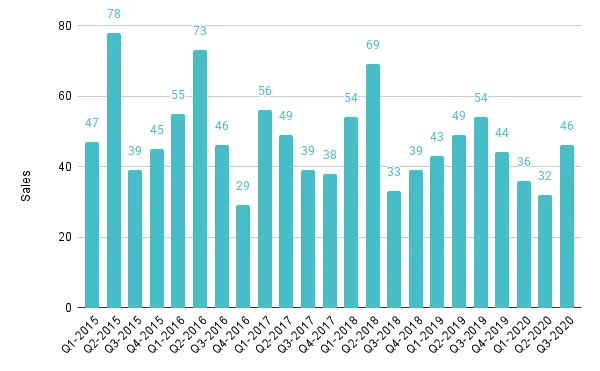
Sales rebound to strongest Q3 since 2015. Even with the pandemic unsettling market dynamics for the first half of the year, it's exciting to see Miami luxury condo sales make a strong comeback this quarter. Reporting a year-over-year increase of 9.6% against Q3 2019, sales are at their highest in a third-quarter since 2015 (Fig. 1.2).
A closer look into the Monthly Sales Chart (Fig. 1.3) reveals that the market gathered more steam towards the tail-end of the quarter. While July started out slower with 55 sales compared to last year's 65, August picked up momentum with 57 sales compared to 2019's 45 sales, and September posted an amazing 70 closed sales compared to last year's 56.
Now, even though part of these sales likely represent deals that were held back in Q2 due to the global lockdown (as predicted in our Condo Blackbook Q2 report here), there is ample momentum to conclude that the market is catching up and getting back on track. This remarkable progress can also be seen in the 12-month Sales Trendline (Fig. 1.4) that has finally corrected from a negative position (in the first and second quarters) to a flat line in Q3.
Still, we will be keeping a close watch on the next quarter's performance, which is going to be critical to declare whether the Miami luxury condo market has made a full recovery from the pandemic-caused disruption or not.
Overall Miami Quarterly Luxury Condo Sales 2015 - 2020 - Fig. 1.2
Overall Miami Monthly Luxury Condo Sales Jan. 2016 to Sep. 2020 - Fig. 1.3
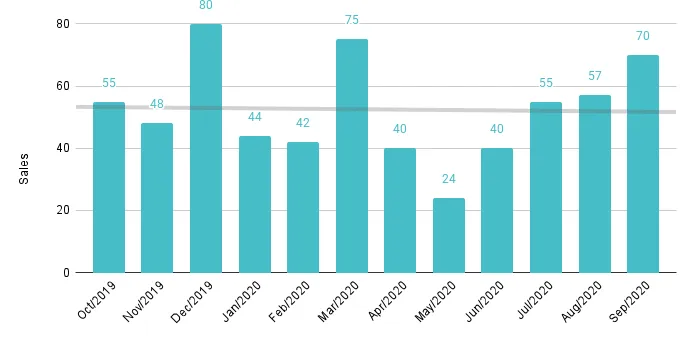
Overall Miami 12-Month Luxury Condo Sales with Trendline - Fig. 1.4

Miami Neighborhood Trends - YoY Number of Sales
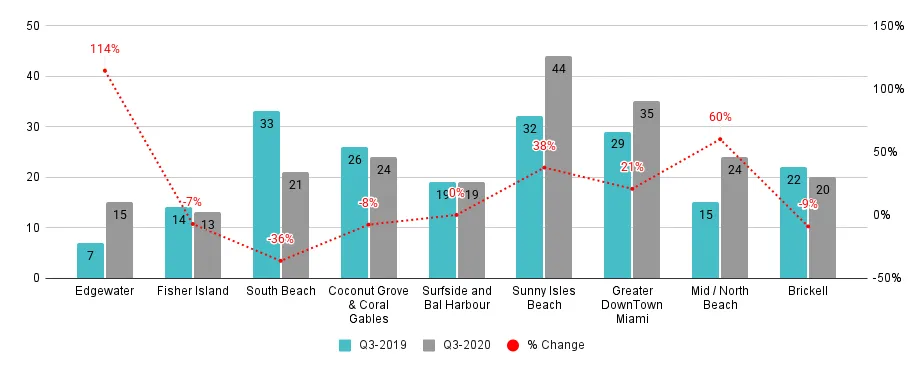
Q3 2020 Year-over-Year Sales Trends (Fig. 1.5)
- Winner: Edgewater reports the highest percentage (114%) growth in year-over-year sales -- an impressive yet expected feat, considering it was one of the few neighborhoods poised for an early recovery according to our Q2 report
- Up: Mid/North Beach (60%), Sunny Isles Beach (38%), and Greater Downtown Miami (21%) - all report an increase in their year-over-year sales
- Flat: The combined neighborhood of Surfside and Bal Harbour posts the same level of sales as Q3 2019
- Down: South Beach (-36%), Brickell (-9%), Coconut Grove & Coral Gables (-8%), plus Fisher Island (-7%) -- all report a decline in their year-over-year sales
More details available, including quarterly data, in the dedicated reports for Greater Downtown Miami, Miami Beach and the Barrier Islands, plus Coral Gables & Coconut Grove.
Miami Luxury Condo Neighborhood 3Q20-over-3Q19 Sales Comparison - Fig. 1.5
Overall Miami Luxury Condo Prices Up - Both Sales Price and Price/Sq. Ft.
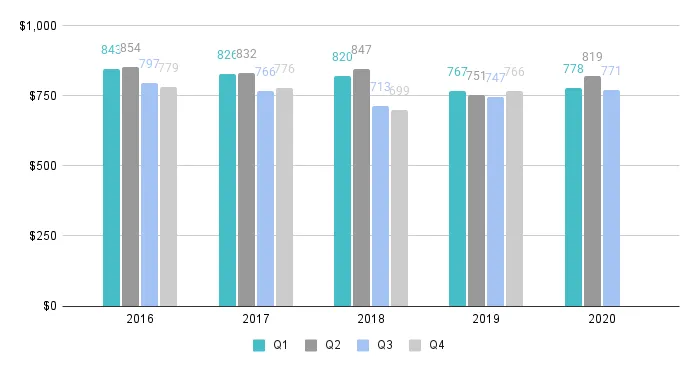
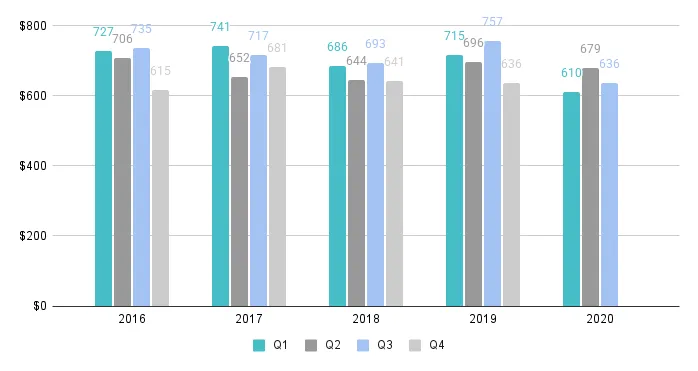
Price/sq. ft. up 3.3% at $771, Median Price up 9.6% Year-over-Year. The trend of higher year-over-year prices continues into the third quarter of 2020. (Price per sq. ft. for the first two quarters was higher compared to the same quarters in 2019. See Fig. 2.1 below).
Overall, the Price per Sq. Ft. for luxury condos increased 3.3% from $747/sq. ft. in Q3 last year to $771/sq. ft. this year (Fig. 1.1). However, the peculiar peak (of a 10% quarter-to-quarter increase) seen in Q2, settles down this quarter.
The Median Sales Price also increased (9.6%) from $1,646,500 in Q3 last year to $1,805,000 in Q3 this year.
Overall Miami Luxury Condo Quarterly Price per Sq. Ft. 2016-2020 - Fig. 2.1
3Q 2020 Miami Neighborhood Trends - Price/Square Foot, Sales Price
Q3 Year-over-Year Price Trends
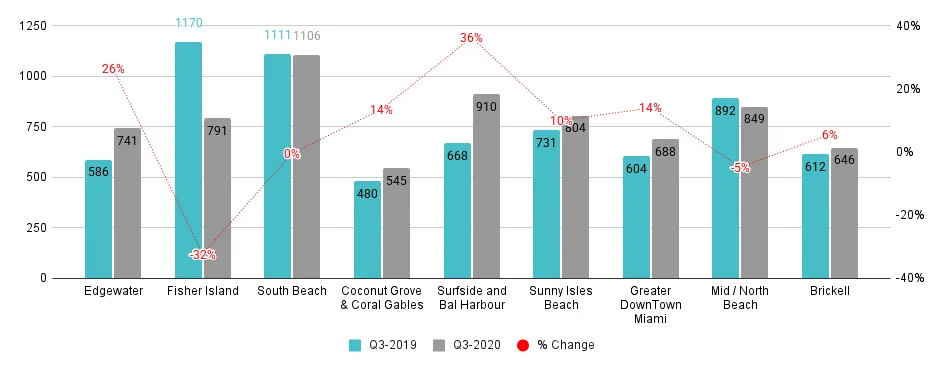
Median Price per Sq. Ft. (Fig. 2.2.1)
- Winner: South Beach is the most expensive neighborhood with a median price of $1,106/sq. ft., outperforming the second quarter's most expensive neighborhood of Fisher Island
- Winner: Surfside & Bal Harbour reports the highest percentage growth in year-over-year Price per sq. ft. (36%), continuing its winning streak from Q1
- Up: Other neighborhoods posting an increase in year-over-year Price per sq. ft. include Edgewater (26%), Greater Downtown Miami (14%), Coconut Grove & Coral Gables (14%), Sunny Isles Beach (10%), and Brickell (6%)
- Flat: South Beach posts a negligible change in year-over-year Price per sq. ft.
- Down: Neighborhoods posting a decline in year-over-year Price per sq. ft. – Mid/North Beach (-5%) and Fisher Island (-32%)
- Worth Noting: It's quite an unusual quarter for Fisher Island, as prices rarely trend below the $1,000 mark in this exclusive neighborhood, which are now at $791/sq. ft. This can partly be explained by the fact that only low-range properties were sold during Q3, as can be seen below in Fig. 2.2.2.
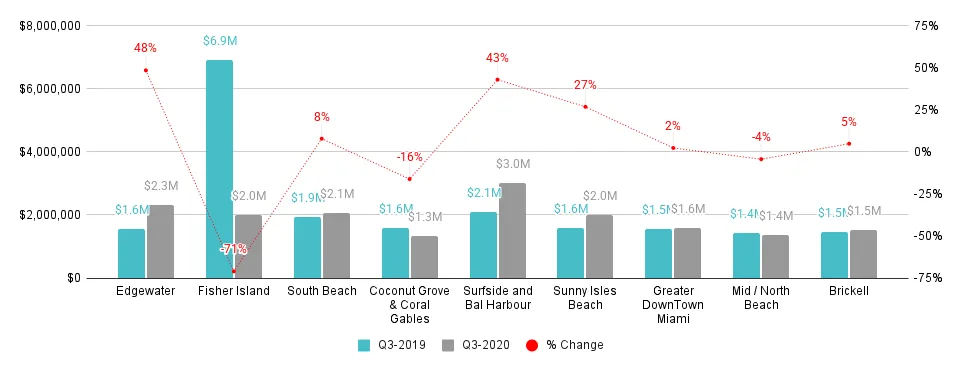
Median Sales Price (Fig. 2.2.2)
- Winner: Edgewater reports the highest percentage growth in year-over-year Median Sales Price (48%), replacing previous quarter's Fisher Island for the winner's tag
- Winner: The combined neighborhood of Surfside & Bal Harbour reports the highest sales price for the second consecutive quarter ($3 million in Q3)
- Up: Other neighborhoods reporting an increase in year-over-year Median Sales Price -- Surfside & Bal Harbour (43%), Sunny Isles Beach (27%), South Beach (8%), Brickell (5%), and Greater Downtown Miami (2%)
- Down: Neighborhoods reporting a decrease in year-over-year Median Sales Price – Fisher Island (-71%), Coconut Grove & Coral Gables (-16%), and Mid/North Beach (-4%)
- Worth Noting: Although Fisher Island perpetually has one of the highest-priced luxury condos in Miami, this quarter's fall to a median sales price of $2 million indicates that only bottom-range luxury condos were sold in the neighborhood
Miami Neighborhood 3Q20-over-3Q19 Median Price per Sq. Ft. Comparison - Fig. 2.2.1
Miami Neighborhood 3Q20-over-3Q19 Median Sales Price Comparison - Fig. 2.2.2
3Q 2020 Overall Miami Sales Price Trends by Building Year
Below is a detailed analysis of how prices added up on the basis of age of construction for luxury condos in Miami, categorized as new construction buildings (2015-2020), buildings built from 2000-2014, and pre-2000 buildings.
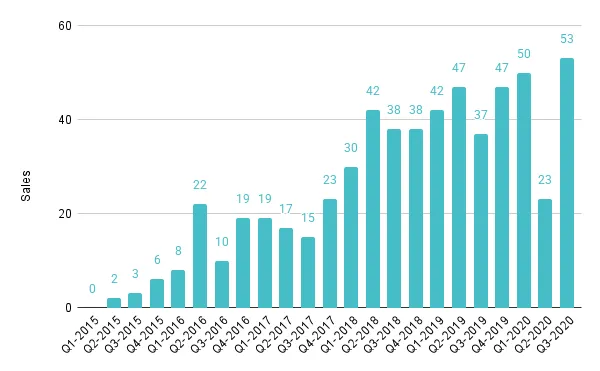
- New Construction Buildings post record-high sales, reporting more than double those of Q2 (23 sales versus 53) + increase in year-over-year value
- Buildings Dated 2000-2014 showed strong sales growth, increasing 10% year-over-year + increase in year-over-year value
- Condos Built before 2000 outperform sales in every third-quarter 2015-2018 + decrease in year-over-year price per sq. ft.
New Construction Condos Built 2015-2020
Sales volumes are back up in Q3 for this newly built section. Posting a record-high number of sales for a quarter (in the entire period under review); this segment reports a 43% increase year-over-year and 130% increase over the previous quarter (Fig. 2.3).
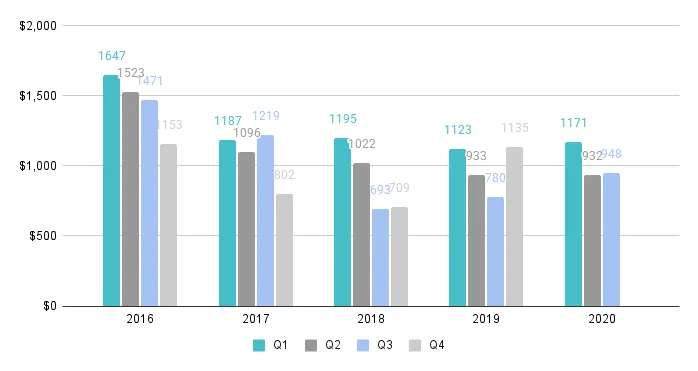
The Price per sq. ft. for this segment increased 21% year-over-year, while the trend remained flat quarter-over-quarter. At $948/sq. ft., the price trends in the mid-range of median prices traced over the past five years (Fig. 2.4).
Overall Miami Luxury Condo Sales for Buildings Dated 2015-2020 - Fig. 2.3
Overall Price per Sq. Ft. for Buildings Dated 2015-2020 - Fig. 2.4
Condos Built 2000-2014
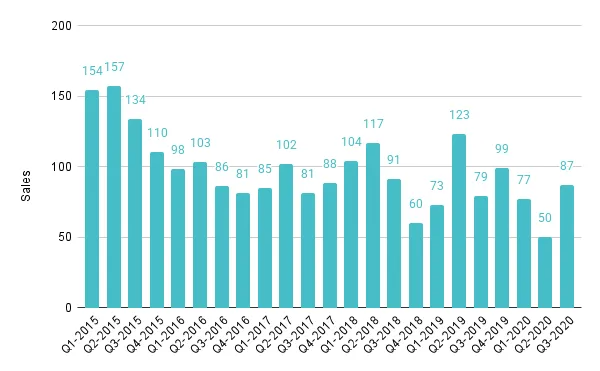
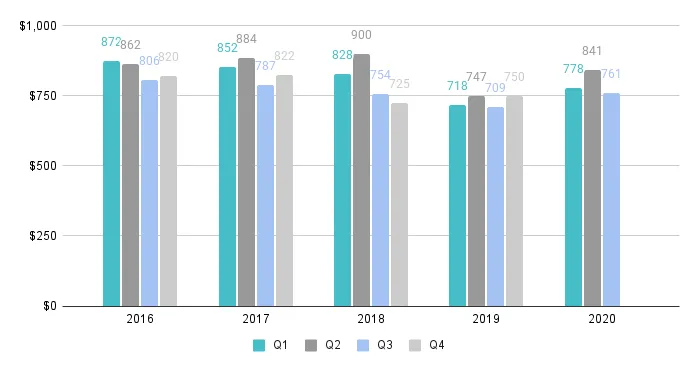
Again, after a short hiatus in Q2, sales make a strong comeback with an impressive 74% increase quarter-over-quarter and 10% increase compared to the same quarter last year (Fig. 2.5). The median price per sq. ft. too posts a 7% increase year-over-year, closing at $761/sq. ft. (Fig. 2.6), and showing good value for sellers.
Overall Miami Luxury Condo Sales for Buildings Dated 2000-2014 - Fig. 2.5
Overall Miami Price per Sq. Ft. for Buildings Dated 2000-2014 - Fig. 2.6
Condos Built Before 2000
For Miami's older luxury buildings, sales declined 15% year-over-year. However, they were up 44% quarter-over-quarter and outperformed the sales reported in the third quarter for years 2015-2018 (Fig. 3.8).
On the other hand, the median Price per sq. ft. in this seasoned segment was down 16% year-over-year and 7% quarter-over-quarter at $636/sq. ft., showing a good window of opportunity for buyers.
Overall Miami Luxury Condo Sales for Buildings Dated 1921-1999 - Fig. 2.7
Overall Miami Price per Sq. Ft. for Buildings Dated 1921-1999 - Fig. 2.8
Overall Miami Luxury Condos Days on Market Up QoQ, Flat YoY
Days on Market increase 46% quarter-over-quarter. With the pandemic-related lockdowns delaying plenty of deals, it is quite expected for the days on market to climb when sales for such properties finally close. This, most likely, is what has increased the days on market for luxury condos by 46% between Q2 and Q3.
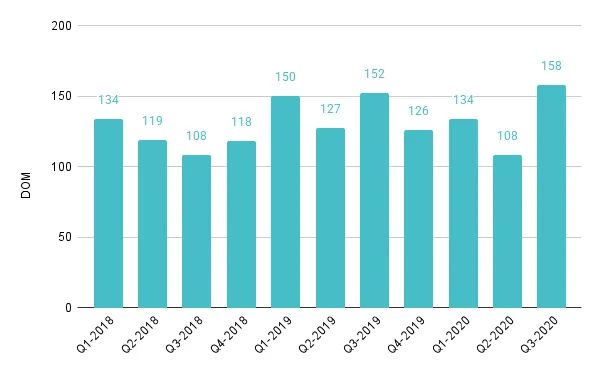
Luxury condos spent 50 more days on market in Q3, when compared to Q2, and 6 more days compared to the same quarter last year (Fig. 3.1). What's worth noting is that while the sudden spike in quarter-to-quarter days on market could be attributed to the pandemic, the metric is stable year-over-year, showing that buyers-seller communication is not worse off a year forward.
Overall Miami Luxury Condos Quarterly Days on Market 2018 - 2020 - Fig. 3.1
Miami Neighborhood Trends - Days on Market
Q3 2020 Year-over-Year Days on Market Trends (Fig. 3.2)
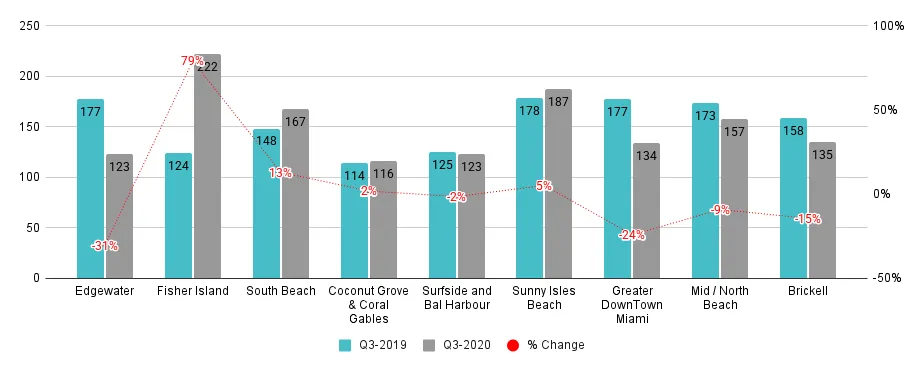
- Winner: Edgewater posts the greatest decline of 54 days for Median Days on Market, while Fisher Island reports the highest increase of 98 days in its Median Days on Market
- A majority of the neighborhoods post a decline in their Median Days on Market for luxury condos -- Edgewater (-31%), Greater Downtown Miami (-24%), Brickell (-15%), Mid/North Beach (-9%), plus Surfside and Bal Harbour (-2%)
- Neighborhoods reporting an increase in their Median Days on Market, besides Fisher Island (79%), include South Beach (13%), Sunny Isles Beach (5%), plus Coconut Grove & Coral Gables (2%)
Miami Neighborhood 3Q20-Over-3Q19 Days on Market Comparison - Fig. 3.2
Luxury Condo Inventory Down QoQ Expectedly, Market Stays Buyer-friendly
Q3 2020 closes with 51 months of inventory. As the Miami luxury condo market shows signs of a recovery, the months of inventory also began to normalize after peaking in Q2 2020. New deals plus closings from the previous months (stalled only due to the pandemic) give ample momentum to bring the trend down by 10% quarter-over-quarter.
However, closing Q3 at 51 months, inventory is 38% higher year-over-year and still a long way off from reaching its ideal of 9-12 months. This is to be expected, since inventory calculations are based on the last 6 month price trends and Q2's progress was interrupted by the pandemic. We almost certainly will see inventory levels drop in Q4 and again in Q1 2021.
In the meantime, buyers still have the upper hand in negotiations and have an extended period to find the best deals possible. Search here for luxury condos for sale in Miami.
Overall Miami Months of Luxury Condo Inventory from Mar. 2019 to Sep. 2020 - Fig. 4.1
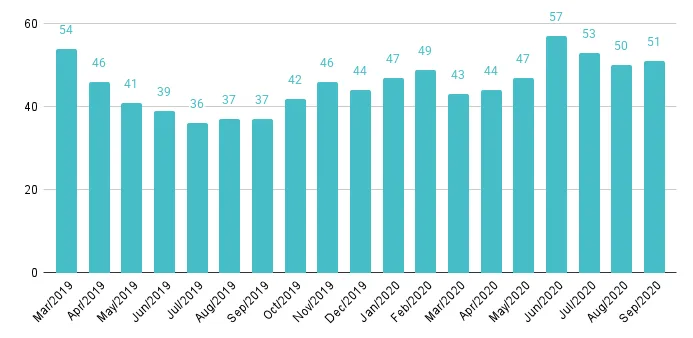
A balanced market has only 9-12 months of inventory. The months of inventory are calculated as the number of active listings + number of pending listings divided by the average number of deals in the last 6 months.
Conclusion
Miami luxury condo market shows signs of recovery, though current trends still favor buyers. It is refreshing to see the market start gain strength this quarter, as Q2 absorbed the most of the negative impact from the pandemic.
Overall Miami luxury condo sales in Q3 2020 improved strongly year-over-year. Coupling this with the positive indication from the 12-month sales trendline (which flattened after two consecutive quarters of a negative trend), plus the high demand we currently see in the market, it's easy to say that we are in a surprisingly early market recovery bounce, which most likely will carry into Q4 2020 and Q1 2021.
As predicted in our Q2 Miami Luxury Condo Report, Edgewater has made an early, and astounding recovery, posting the highest year-over-year growth in sales for all the neighborhoods in our report.
Additionally, Mid/North Beach, Sunny Isles Beach, plus Greater Downtown Miami posted a complete turnarounds from their negative numbers in the previous quarter to higher year-over-year sales this Q3.
Both the Sales Price and Price per sq. ft. also posted year-over-year gains, reflecting that sellers are getting good returns for their luxury condo investments in Miami. Properties in the combined Surfside and Bal Harbour neighborhood posted maximum gains in year-over-year value, followed by Edgewater, Greater Downtown Miami plus Coconut Grove & Coral Gables.
While overall inventory was expectedly up, simply because the trend considers average activity in the past 6 months, we strongly expect levels to go down over the next two quarters, at least. However, for now, buyers have the advantage of extended time and options, until inventory bounces back to pre-COVID levels and lower, which they can use to their advantage as they look for luxury condos for sale in Miami.
Luxury Market Predictions and Analysis: Where Does the Market Go From Here?
With only one quarter left until the end of 2020, expecting a reversal in the current buyer-friendly cycle is unlikely. However, if the market maintains its pace next quarter, which it most likely will, we can reasonably expect trends to normalize to pre-COVID levels relatively soon.
Additionally, the following factors will influence Miami's luxury condo market over the remainder of the year:
COVID-19 after-effect -- Miami a stronger favorite. While the pandemic may have stalled buyer plans in Q2, the third quarter saw all of that pent-up demand come through. We are also seeing increased demand from:
- Those from high-tax states, as Miami's no-income-tax environment is a welcome financial relief, particularly when other aspects of the economy are unpredictable
- Those looking to escape the extremely cold winters up north and migrate to the warmer, balmier winters of Florida
- Those working from home, who now have the flexibility to work from anywhere such as a sugar-sand beach, a vibrant tropical garden, or a sunny den with ocean views
- Those seeking more cultural diversity and a city with peaceful #BLM protests
- Those who were simply waiting for travel restrictions to be eased
Presidential Elections. The 2020 Presidential election still remains a wild card as we get closer to election day. Historically, Presidential elections have always put a pause on real estate transactions. However, what remains to be seen is how much of an impact will that pause have on sales and inventory.
Inventory Correction. Even as the buyer's market cycle has been extended naturally (due to COVID-19), we expect to see a correction soon. With high luxury condo demand and fewer pre-construction deliveries in the new future, inventory will continue coming down over Q4 2020 and Q1 2021 - offering a very positive outlook for the market in Miami.
If you'd like more details on the data in our exclusive Condo Blackbook quarterly luxury condo market reports, please send us an email or give us a call anytime.
Love what you see? Share our blog and subscribe (see the subscribe link on the top menu) to receive the latest Miami real estate market and lifestyle news in your inbox. Also, keep up with us on your favorite social media outlets. We're on Instagram, Facebook and Twitter!

