


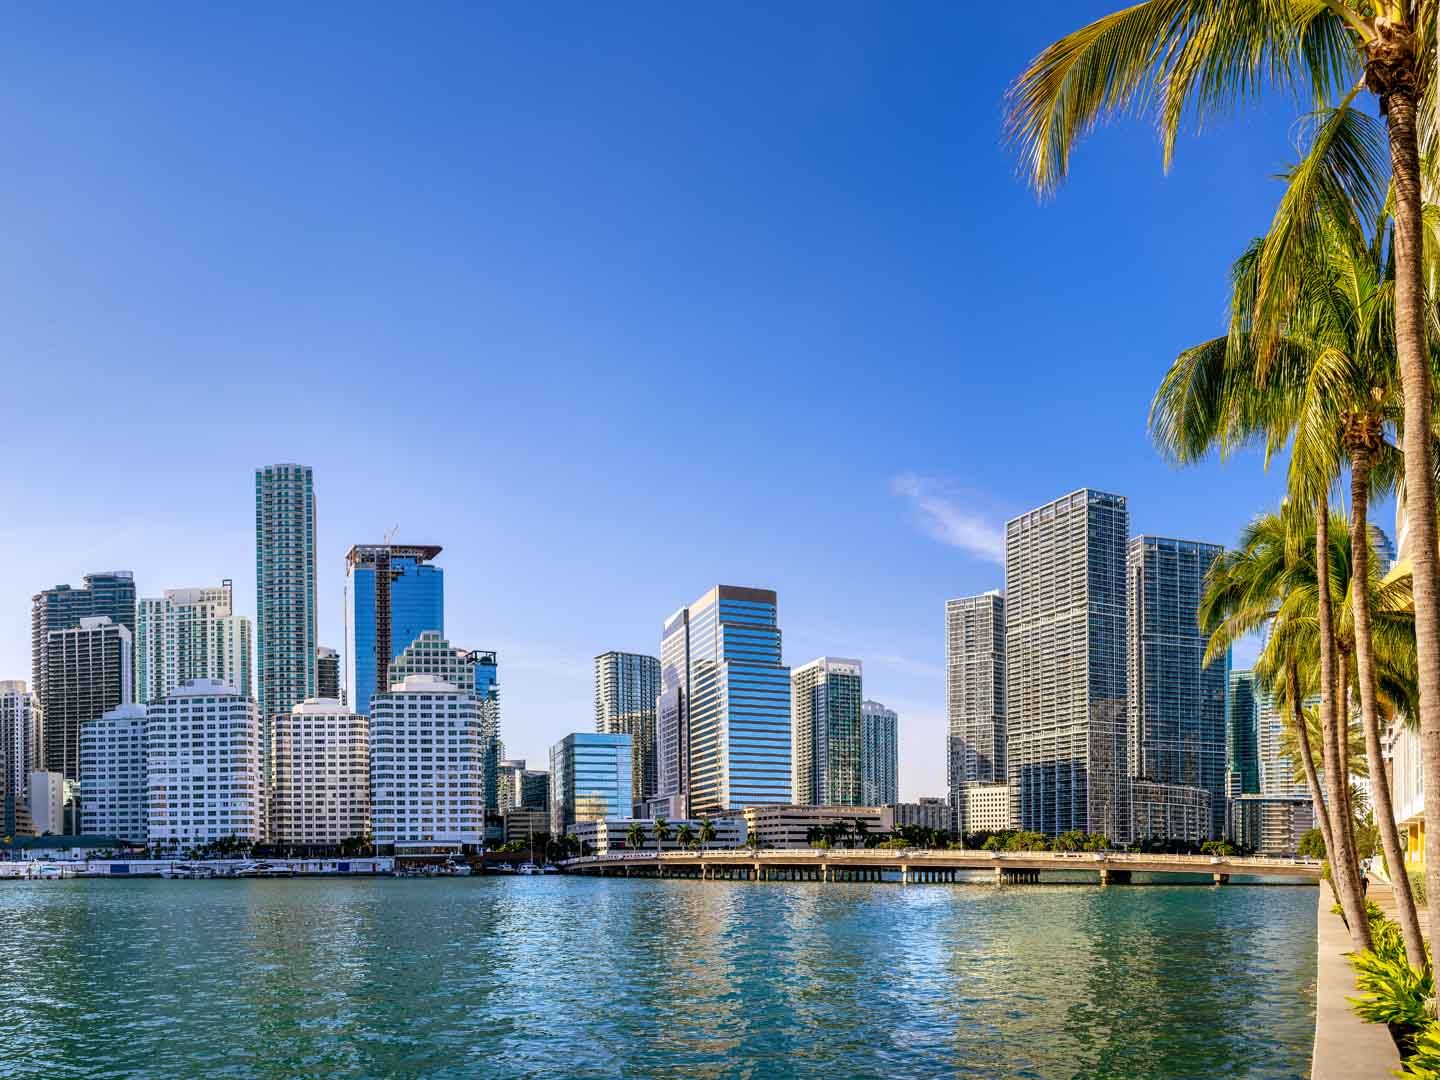
Coastal Mainland Miami sustained its strong sales pace in Q3 2026, extending the momentum established in the first half of 2026. Newer inventory and high-priced sales in the $5M+ tier helped push the region’s median sale price to a record $1.79 million, even with some price softening in select neighborhoods and condo buildings.
In Q3 2026, two neighborhoods emerged as key markets to watch: Coconut Grove, the usual standout, and Brickell. Coconut Grove led in year-over-year price appreciation and reported the tightest inventory of the neighborhoods we reviewed, making it Miami’s only seller-leaning market.
Brickell’s story was more nuanced. Despite recording the highest inventory levels in Q3, which creates price pressure, it also posted the second-highest year-over-year sales growth and the second-highest price appreciation.
Downtown Miami remained Coastal Mainland’s strongest value play but for reasons beyond its elevated inventory. Read on to learn more.
This luxury condo market report only includes data for condos priced $1 million and above. The Coastal Mainland Miami grouping covers Brickell, Downtown Miami, Edgewater (including Arts & Entertainment District), Coconut Grove, and Coral Gables.
Contrasting Q2 2026, we have returned to the $1M+ price threshold for Q3 2026 to provide a more comprehensive overview of Miami’s luxury condo market. We’ve also expanded our market coverage to include a deeper analysis of four price tiers: Premium ($1–2M), Luxury ($2–5M), High Luxury ($5–10M), and Ultra Luxury ($10M+).
— Q3 2026 Coastal Mainland Miami Highlights: $1M+ Condo Market
-
Coconut Grove led Miami’s $1M+ condo market in year-over-year price appreciation, posting the quarter's strongest gains at 27.4%.
-
Coconut Grove also emerged as the most expensive neighborhood in Coastal Mainland Miami, with a median sale price of $2,150,000.
-
Coral Gables topped sales growth, reporting the highest year-over-year increase in overall Miami at 54.5%. Brickell followed close behind with a 36% increase.
-
Downtown Miami emerged as Coastal Mainland’s fastest-moving segment, with luxury condos spending a median of 72 days on market.
-
Coconut Grove recorded the lowest inventory surplus at 6 months, making it the only seller-leaning market in Miami. Coral Gables trailed behind with 9 months of inventory.
-
Brickell continued to record Miami’s highest inventory levels at 25 months, giving buyers the clear advantage.



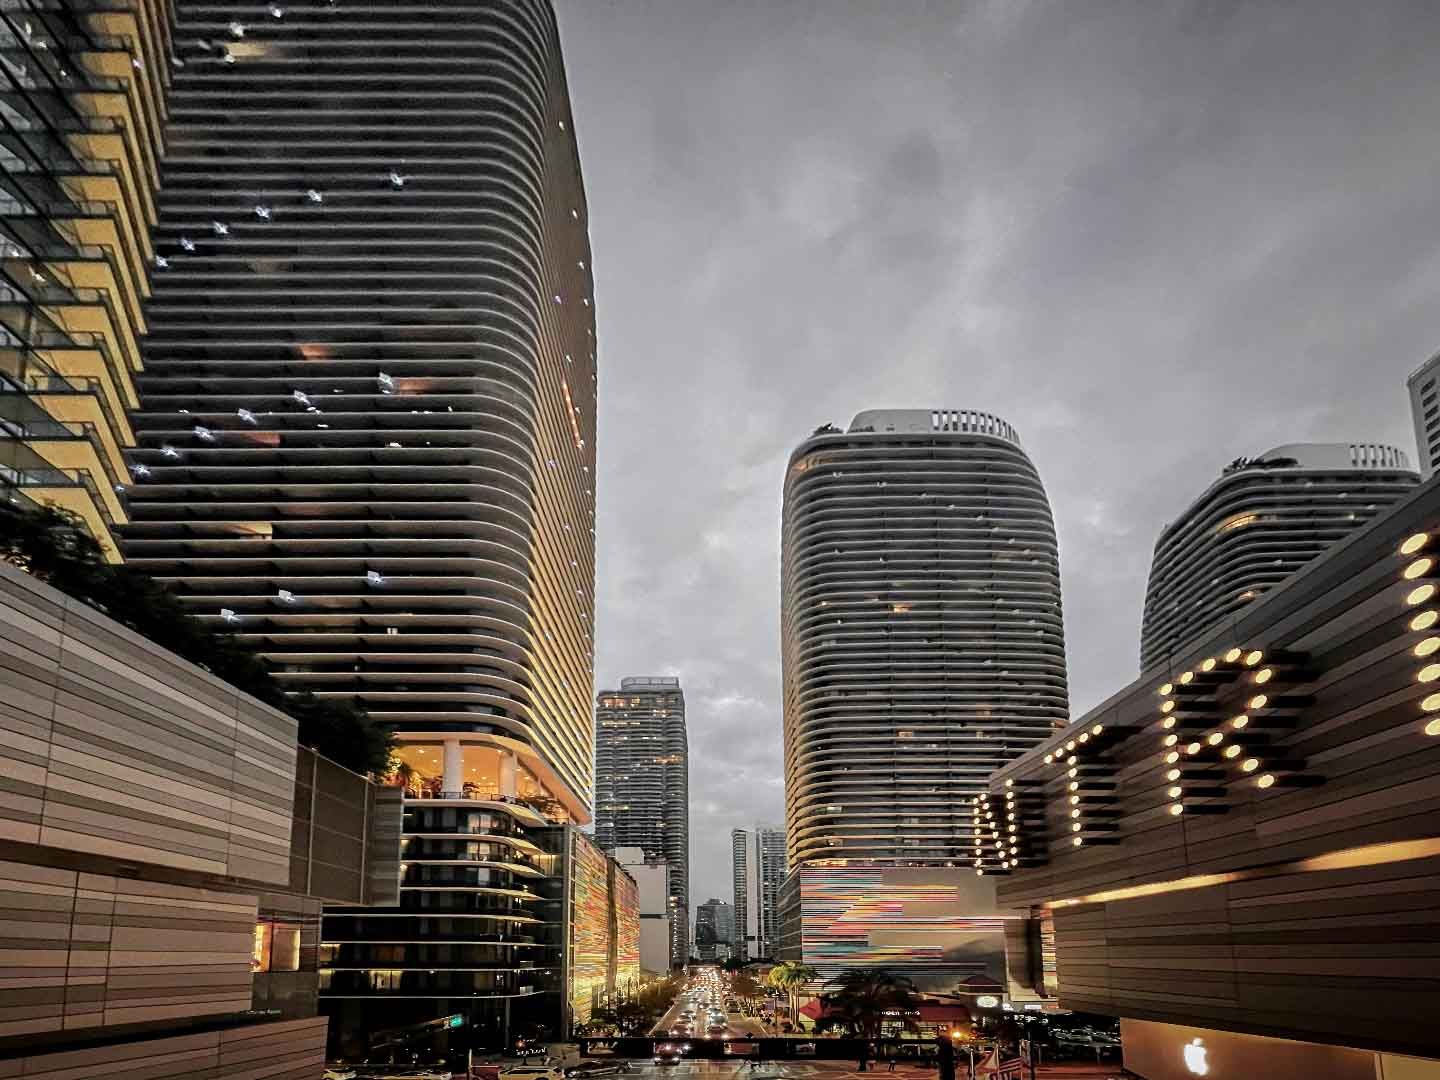
— Brickell
-
Median sale price up from $1,425,000 to $1,555,000, a 9.1% year-over-year increase.
-
Closed sales up from 25 to 34, a 36% year-over-year increase.
-
Months of inventory down from 45 to 25 months, a 44.4% year-over-year decline.
Brickell recorded both the second-highest year-over-year sales growth and second-highest price appreciation across the Miami neighborhoods we reviewed, with closed sales rising 36% and median sale price increasing 9.1%.
Demand was concentrated in the $1–2M Premium segment, which accounted for 70.6% of transactions. The $5–10M High Luxury tier represented just 5.9% of transactions but contributed 16.6% of total dollar volume.
Blackbook Recommends
With Miami’s largest inventory surplus, Brickell’s $1M+ condo market is a strong buyer’s market. Supply is especially elevated in the $2–5M Luxury tier at 27 months. We expect this excess to weigh on prices across the financial district, with higher mortgage rates posing an additional headwind for the sub-$2M segment.
Still, Banco do Brasil, Brazil’s largest bank, is moving its US headquarters to Brickell, Citadel is advancing plans for its $2.5-billion headquarters, and Peter Thiel’s family office secured a record lease at 830 Brickell for $250 per square foot.
Combined with its walkability, lifestyle offerings, and strong public-transit connectivity, these developments reinforce Brickell’s appeal as a prominent live-work destination. Its active short-term-rental market further supports the neighborhood’s long-term investment appeal.
On the other hand, sellers should keep the current buyer’s market and heavy competition in mind when pricing.
Deeper Analysis by Price Tier
|
Price Tier |
Median Sale Price |
Median Sale Price YoY |
Median Price per Square Foot |
Closed Sales |
Closed Sales YoY |
$ Volume |
$ Volume YoY |
% Share |
$ Share |
Months of Inventory |
Days on Market |
|
$1–2M |
$1,370,000 |
7.0% |
$891 |
24 |
33.3% |
$35M |
47.1% |
70.6% |
46.1% |
21 |
97 |
|
$2–5M |
$3,637,500 |
21.3% |
$1,263 |
8 |
14.3% |
$28M |
41.4% |
23.5% |
37.4% |
27 |
100 |
|
$5–10M |
$6,200,000 |
N/A |
$1,394 |
2 |
N/A |
$12M |
N/A |
5.88% |
16.55% |
72 |
92 |
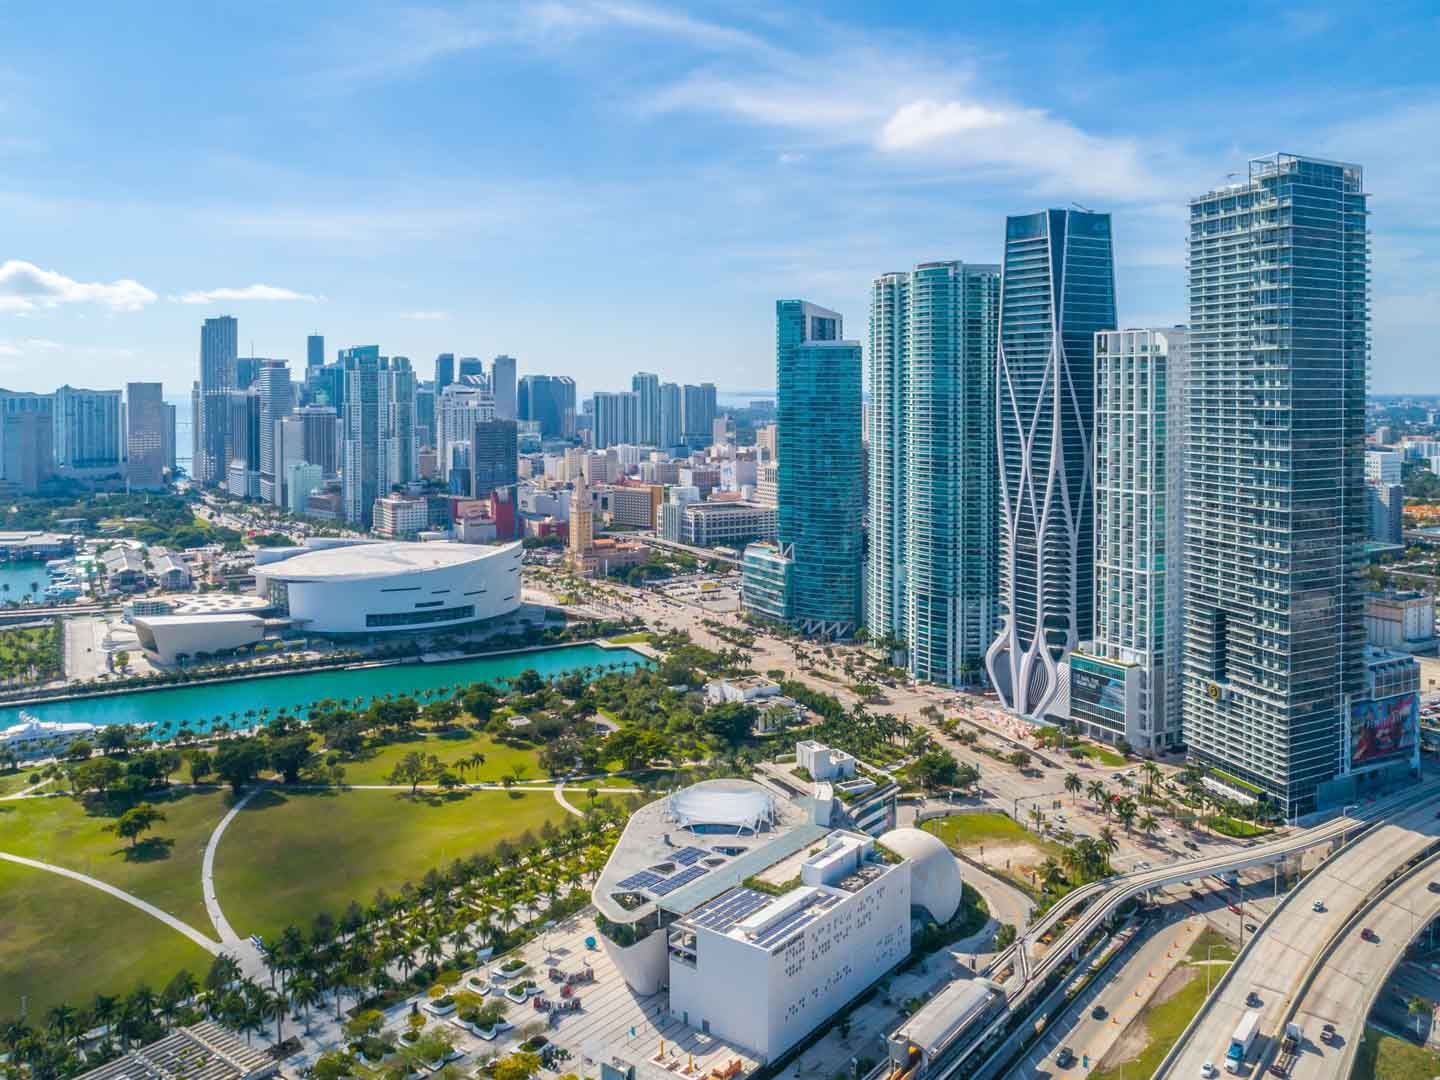
— Downtown Miami
-
Median sale price down from $2,415,000 to $1,700,000, a 29.6% year-over-year decline.
-
Closed sales down from 27 to 21, a 22.2% year-over-year decrease.
-
Months of inventory up from 18 to 23 months, a 27.8% year-over-year increase.
Slower year-over-year sales kept Downtown Miami among the city’s biggest value plays for buyers this quarter. With one of Miami’s highest inventory levels, this buyer’s market recorded the steepest year-over-year median sale price decline among all the neighborhoods we reviewed.
The $1–2M Premium tier accounted for 52.4% of transactions, while a single $10M+ sale contributed 31.6% of dollar volume, the highest share of any tier. The sale in question was a $21,925,000, 10,000-square-foot full-floor penthouse at One Thousand Museum featuring 5 bedrooms, 6.5 bathrooms, an expansive corner family room, a media room, a butler’s pantry, 4 parking spaces, 2 valet spaces, and 2 storage units.
Blackbook Recommends
Downtown Miami remains a buyer’s market, with inventory far exceeding the 9–12-month range associated with a balanced market. With two years of supply in the $2–5M Luxury tier, buyers have considerable room to negotiate steeper discounts.
For buyers and investors who aren’t seeking immediate ROI and have the appetite to hold on for the next 5 to 7 years, Downtown’s ongoing transformation and current price pressure create a compelling long-term investment opportunity.
The neighborhood is set to benefit from continued investment in infrastructure, public spaces, retail, and residential development. Downtown is the city’s primary public-transportation hub, with the Brightline and several other transit connections, and it’s poised to become even more accessible with the under-construction Signature Bridge and the proposed Downtown-to-Aventura commuter-rail project, which recently received $200 million in state funding.
The current upscaling of Miami Worldcenter and Bayside Marketplace is adding to the neighborhood’s retail appeal, while Bayfront Park, Maurice A. Ferré Park, and the planned park beneath the Signature Bridge will add valuable green space to an increasingly urban setting.
New luxury developments, including E11EVEN Club Residences Beyond, JEM Private Residences, and Okan Tower, will further expand the area’s high-end residential offerings. Together with other Miami DDA initiatives covered in our exclusive interview, these developments add to the reasons investors with a longer holding period may want to keep Downtown Miami on their radar.
For sellers, we recommend pricing competitively to stand out among the surplus of alternatives, especially with new-construction inventory entering the mix.
Deeper Analysis by Price Tier
|
Price Tier |
Median Sale Price |
Median Sale Price YoY |
Median Price per Square Foot |
Closed Sales |
Closed Sales YoY |
$ Volume |
$ Volume YoY |
% Share |
$ Share |
Months of Inventory |
Days on Market |
|
$1-2M |
$1,225,000 |
-2.0% |
$700 |
11 |
-8.3% |
$14M |
-16.4% |
52.4% |
19.6% |
20 |
54 |
|
$2-5M |
$2,720,000 |
-4.6% |
$1,178 |
7 |
-46.2% |
$20M |
-47.7% |
33.3% |
28.4% |
24 |
98 |
|
$5-10M |
$7,097,500 |
39.9% |
$1,543 |
2 |
0.0% |
$14M |
39.9% |
9.5% |
20.4% |
46 |
162 |
|
$10M+ |
$21,925,000 |
N/A |
$2,383 |
1 |
N/A |
$22M |
N/A |
4.8% |
31.6% |
30 |
864 |
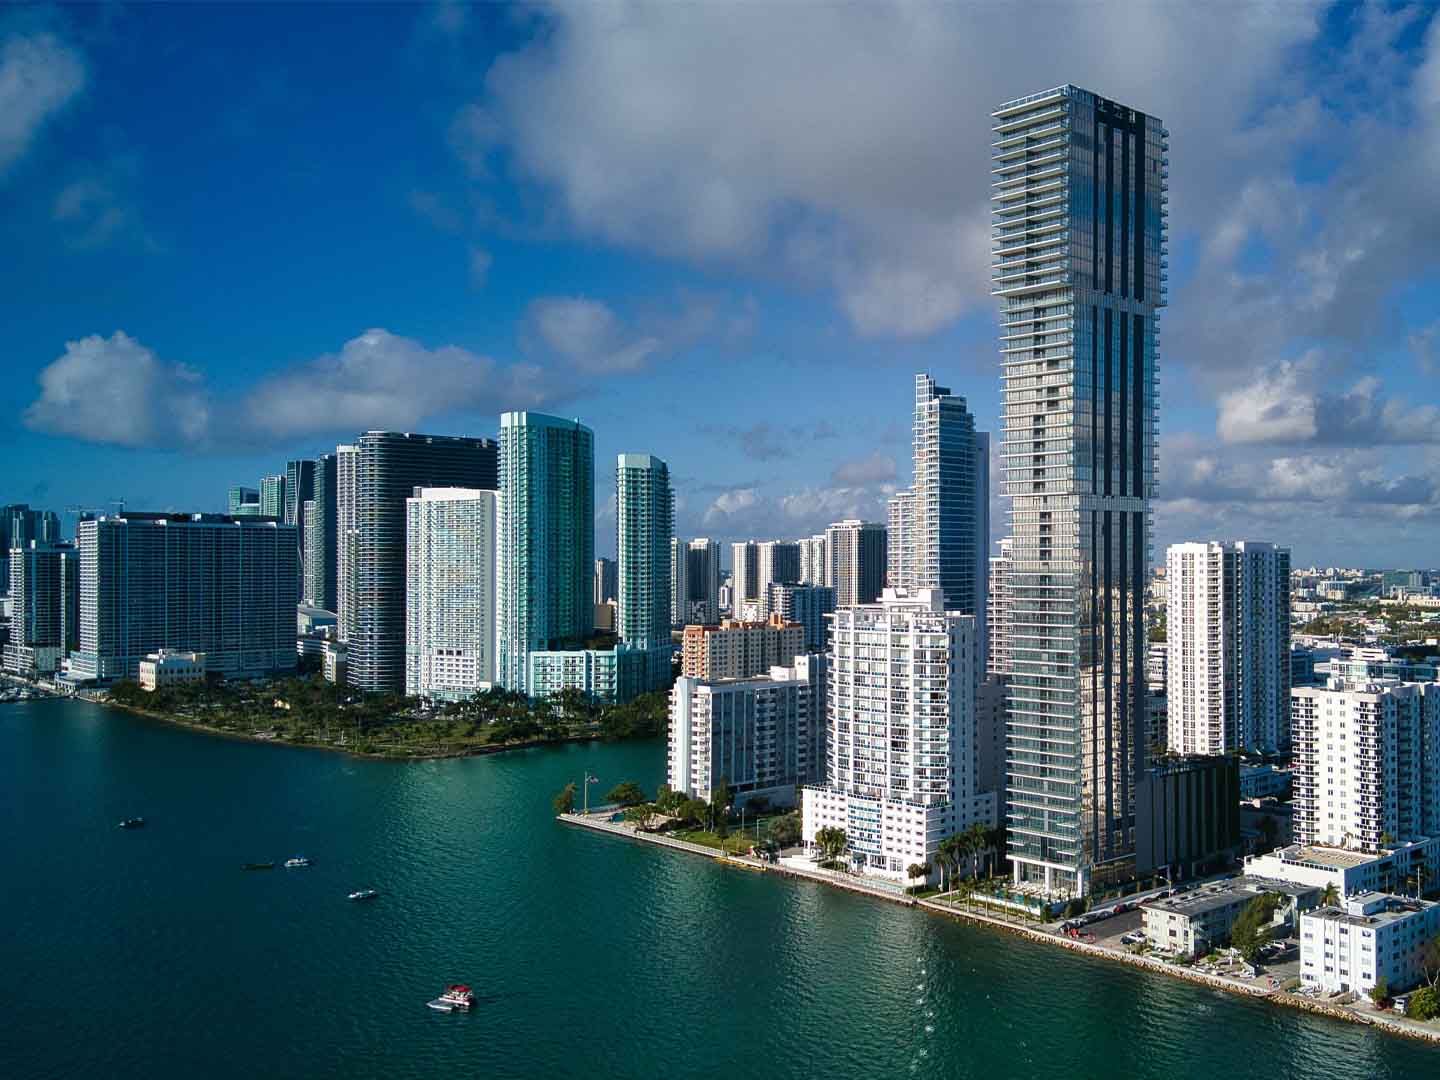
— Edgewater
-
Median sale price down from $1,850,000 to $1,682,500, a 9.1% year-over-year decrease.
-
Closed sales up from 23 to 28, a 21.7% year-over-year increase.
-
Months of inventory down from 21 to 14 months, a 33.3% year-over-year decline.
Q3 2026 sales rose 21.7% year-over-year, making this Edgewater’s strongest third quarter for the $1M+ condo market, trailing only Q3 2021 and Q3 2022.
A closer look at the price-tier data below shows that activity remained concentrated in the two lower tiers, with the $1–2M Premium tier leading sales and contributing to more than half of dollar volume.
Blackbook Recommends
Since inventory closed above the ideal 9–12-month range, the $1M+ condo market in Edgewater remained buyer friendly. Recent completions, such as Aria Reserve North Tower and Casa Bella Residences by B&B Italia, continue adding more luxury inventory to the mix.
Drawing on our expertise as a top-producing boutique brokerage in the neighborhood, we expect this expanding supply to keep prices for older and mid-range properties under pressure, while sales of newer, high-end residences continue to raise the ceiling for the median sale price over the next two years.
Additionally, with new offices and transformative development headed for nearby Wynwood—such as Amazon’s move to Wynwood Plaza, Pitbull’s planned headquarters in an eight-story boutique office building, and Ken Griffin’s multi-billion-dollar investment in the Carnegie Mellon University campus—Edgewater stands to benefit from a broader shift in the area’s overall profile, resulting in a boost to property values in the long run.
For buyers and investors, softer prices and relatively high inventory make this a favorable time. Meanwhile, sellers are advised to price competitively, taking cues from recent comparable sales.
Deeper Analysis by Price Tier
|
Price Tier |
Median Sale Price |
Median Sale Price YoY |
Median Price per Square Foot |
Closed Sales |
Closed Sales YoY |
$ Volume |
$ Volume YoY |
% Share |
$ Share |
Months of Inventory |
Days on Market |
|
$1–2M |
$1,525,000 |
13.0% |
$927 |
19 |
58.3% |
$28M |
69.0% |
67.9% |
52.8% |
11 |
92 |
|
$2–5M |
$2,750,000 |
0.0% |
$1,054 |
9 |
-10.0% |
$25M |
-18.8% |
32.1% |
47.2% |
16 |
135 |
— Coconut Grove
-
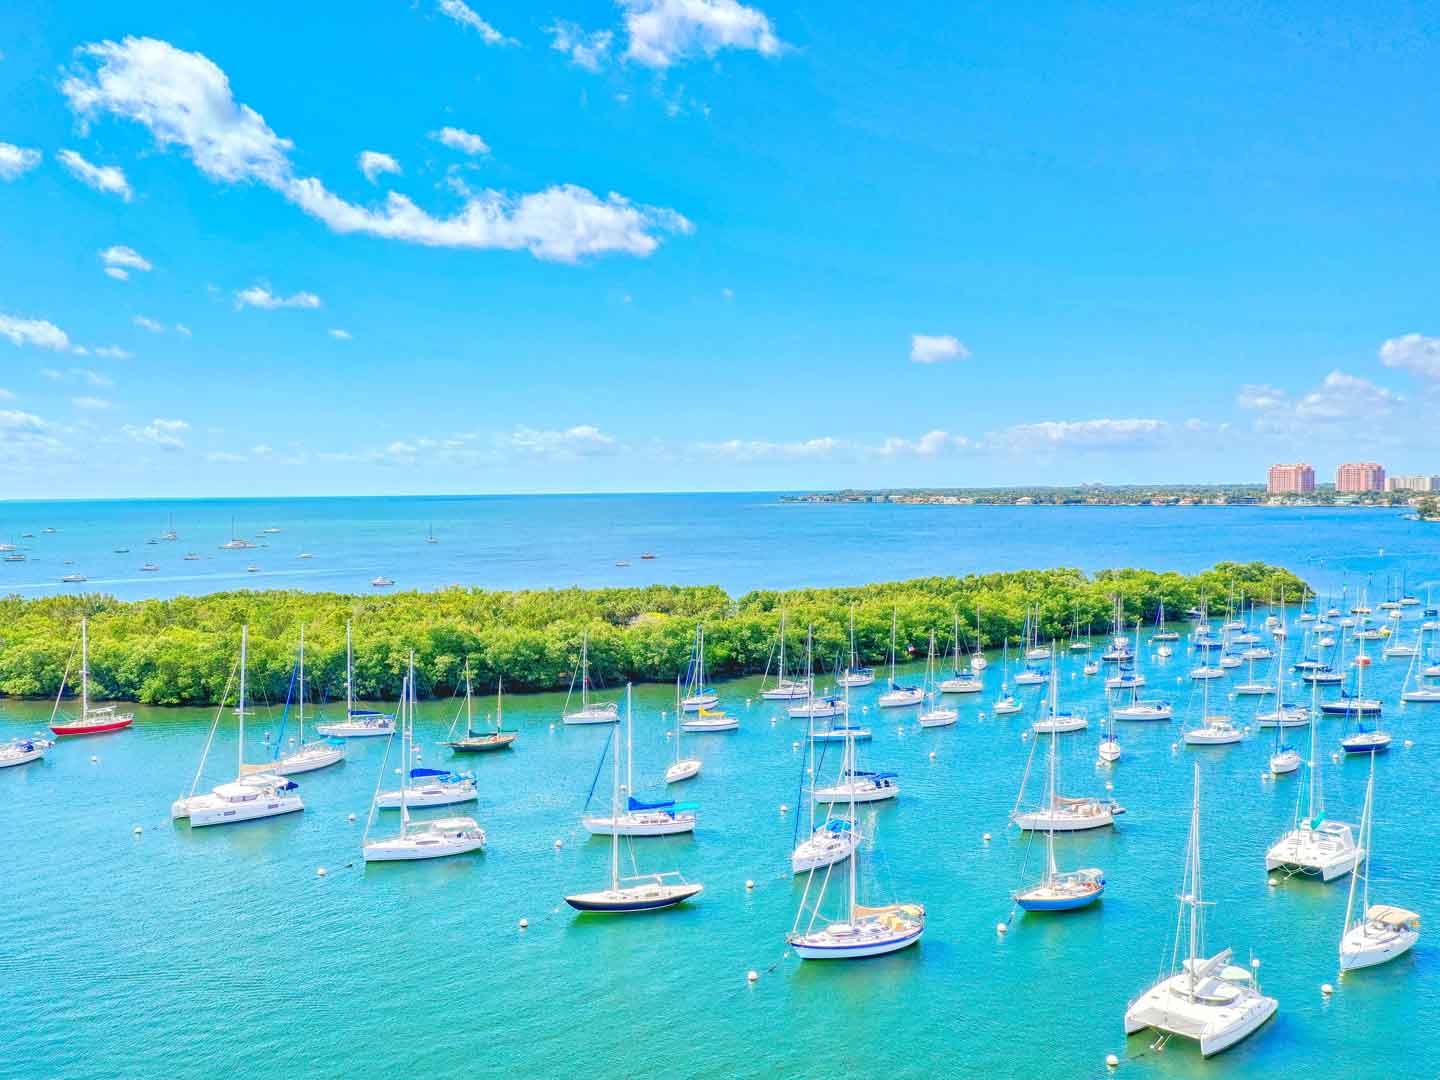
Median sale price up from $1,687,500 to $2,150,000, a 27.4% year-over-year uptick.
-
Closed sales slightly down from 46 to 45, a 2.2% year-over-year decrease.
-
Months of inventory at 6, making Coconut Grove the only seller’s market with the lowest inventory surplus.
With the tightest supply in Miami and a greater share of closings in higher-priced tiers, Coconut Grove recorded the highest year-over-year increase in median sale price at 27.4%. Momentum nearly matched 2025 levels, and the neighborhood closed as Miami’s only seller-leaning market.
The $1–2M tier represented the largest share of transactions at 46.7% but accounted for just 22.3% of dollar volume. By contrast, the $2–5M and $5–10M tiers together made up 51.2% of transactions and 66.4% of dollar volume, highlighting the contribution of higher-priced sales to the neighborhood’s total market value.
Blackbook Recommends
Coconut Grove has evolved into one of Miami’s most coveted addresses for business leaders post-pandemic. Its latest roster of residents includes Google co-founder Larry Page and Citadel founder Ken Griffin.
The caliber of buyers drawn to the Grove is reflected in the quarter’s top sale: a $16.15-million penthouse at Mr. C Residences Bayshore Tower, which set a new building record. The 6,611-square-foot condo features 5 bedrooms, 5.5 bathrooms, 2 flexible-use rooms, private elevator access, 8 dedicated parking spaces, and more than 2,610 square feet of outdoor terrace space.
For buyers seeking a low-density enclave with increasingly sophisticated business and lifestyle offerings, Coconut Grove delivers walkability, lush greenery, a sail-ready bayfront, established dining venues, some of Miami’s top-rated schools, and easy access to Brickell’s corporate hub.
New projects, such as the Ziggurat, which features condo, office, and retail components, reflect the neighborhood’s growing mixed-use endeavors and independent office markets. They also point to the strength of demand for non-waterfront properties, a characteristic that sets the Grove apart from most other Miami neighborhoods under review.
As luxury condo market experts, we foresee continued strength in Coconut Grove over the next few years, supported by limited inventory, a unique waterfront setting, and steady demand following the arrival of some of the world’s top billionaires.
Deeper Analysis by Price Tier
|
Price Tier |
Median Sale Price |
Median Sale Price YoY |
Median Price per Square Foot |
Closed Sales |
Closed Sales YoY |
$ Volume |
$ Volume YoY |
% Share |
$ Share |
Months of Inventory |
Days on Market |
|
$1-2M |
$1,500,000 |
-4.9% |
$986 |
21 |
-34.4% |
$32M |
-36.1% |
46.7% |
22.3% |
5 |
62 |
|
$2-5M |
$2,875,000 |
22.3% |
$1,163 |
16 |
45.5% |
$45M |
52.7% |
35.6% |
31.9% |
5 |
96 |
|
$5-10M |
$6,050,000 |
5.2% |
$2,093 |
7 |
133.3% |
$49M |
170.2% |
15.6% |
34.5% |
14 |
110 |
|
$10M+ |
$16,150,000 |
N/A |
$2,443 |
1 |
N/A |
$16M |
N/A |
2.2% |
11.4% |
11 |
168 |
— Coral Gables
-
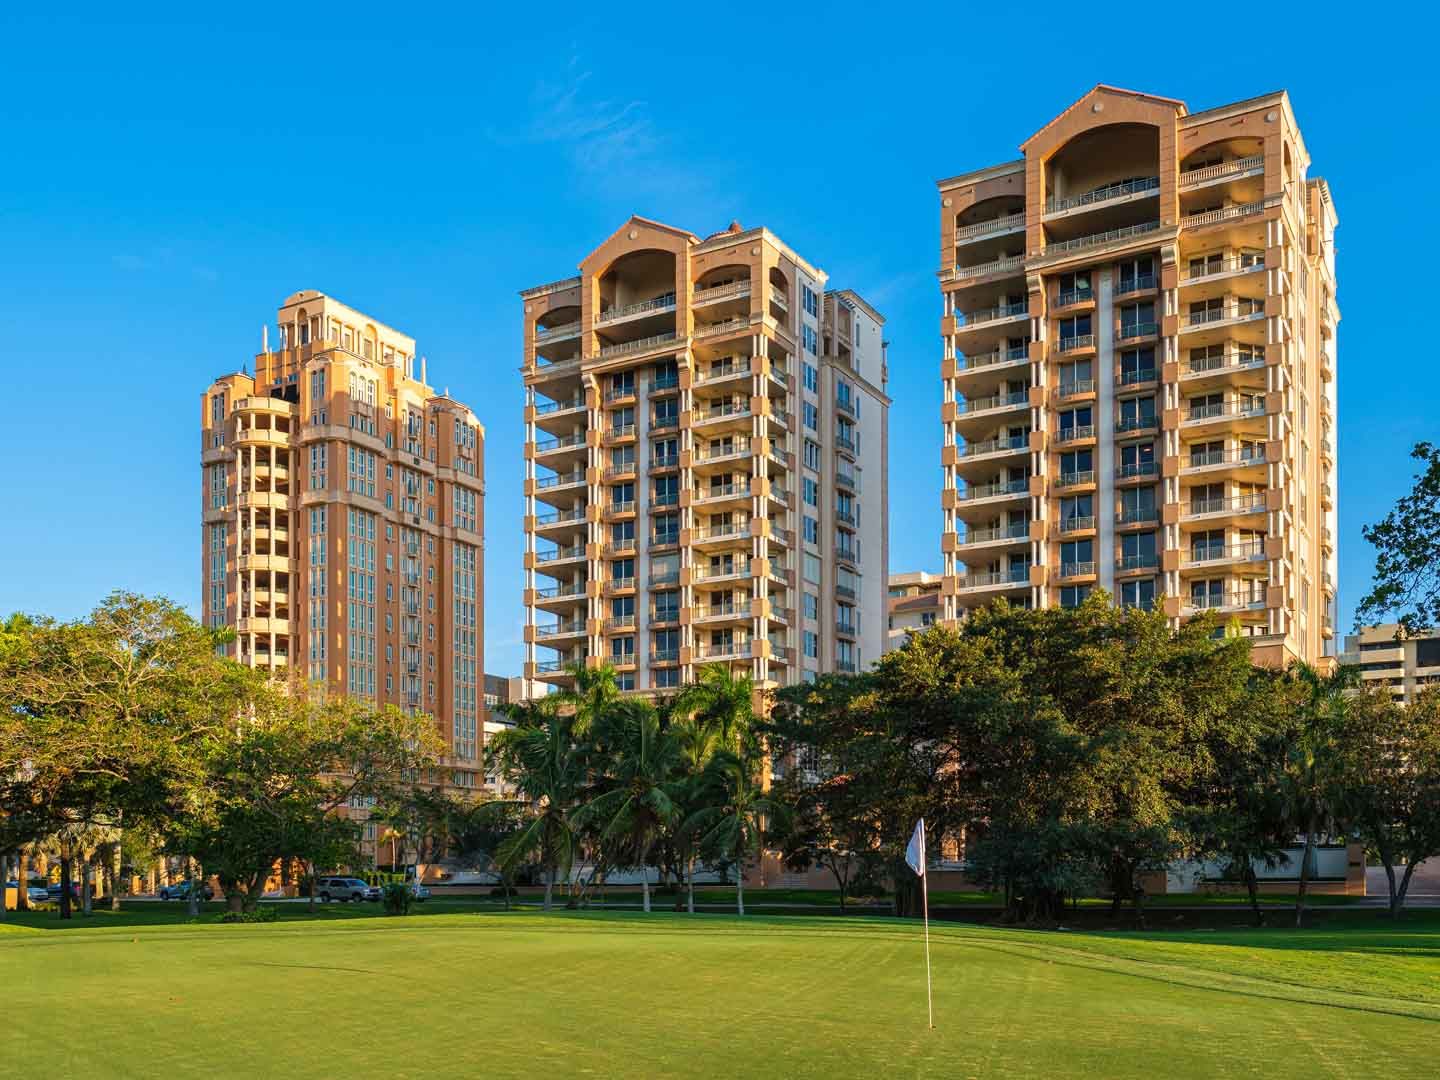
Median sale price down from $1,900,000 to $1,875,000, a 1.3% year-over-year decrease.
-
Closed sales up from 11 to 17, a 54.5% year-over-year surge.
-
Months of inventory at 9, tied for the second-lowest along with South Beach.
Coral Gables recorded its second-highest Q3 sales on record, surpassed only by the pandemic-era surge in Q3 2021. Total dollar volume rose 64.4% to $40 million, while the median sale price declined 1.3%. This increase in dollar volume reflects higher transaction volume and a shift in sales mix rather than true price appreciation as median sale prices declined across both the $1–2M and $2–5M tiers.
The $1–2M Premium tier drove most of the sales growth, with transactions up 66.7% year-over-year, while the $2–5M Luxury tier contributed the largest share of dollar volume at 38.2%.
Blackbook Recommends
With 9 months of inventory, Coral Gables was one of two balanced markets in our Q3 2026 review, alongside South Beach. Conditions in this $1M+ condo market offer equal opportunities for both buyers and sellers, but buyers seeking better deals may find them in the $2–5M tier, where inventory closed at 12 months.
Much like Coconut Grove, Coral Gables benefits from being an established, self-contained community with limited condo inventory. As its own master-planned municipality, Coral Gables has a distinct Mediterranean-inspired architectural profile, lush tropical backdrop, and a loyal resident base.
Many homeowners are choosing to transition from single-family homes to spacious, new-construction condos, such as Villa Valencia, to enjoy the best of both worlds: the privacy and generous proportions of a standalone house combined with the lock-and-leave convenience and amenities of condo living. This is creating steady demand for larger, well-appointed condominiums in the neighborhood.
Deeper Analysis by Price Tier
|
Price Tier |
Median Sale Price |
Median Sale Price YoY |
Median Price per Square Foot |
Closed Sales |
Closed Sales YoY |
$ Volume |
$ Volume YoY |
% Share |
$ Share |
Months of Inventory |
Days on Market |
|
$1-2M |
$1,225,000 |
-22.8% |
$727 |
10 |
66.7% |
$13M |
38.4% |
58.8% |
33.7% |
6 |
94 |
|
$2-5M |
$2,585,000 |
-8.2% |
$764 |
5 |
0.0% |
$15M |
4.8% |
29.4% |
38.2% |
12 |
82 |
|
$5-10M |
$5,600,000 |
N/A |
2 |
N/A |
$11M |
N/A |
11.8% |
28.1% |
9 |
117 |
— Coastal Mainland Miami Neighborhood Comparison
|
Median Sale Price |
% Change in Median Sale Price |
Median Price per Square Foot |
Closed Sales |
% Change in Sales YoY |
Months of Inventory |
Days on Market |
|
|
Brickell |
$1,555,000 |
9.1% |
$987 |
34 |
36% |
25 |
97 |
|
Downtown Miami |
$1,700,000 |
-29.6% |
$916 |
21 |
-22.2% |
23 |
72 |
|
Edgewater + A&E |
$1,682,500 |
-9.1% |
$993 |
28 |
21.7% |
14 |
94 |
|
Coconut Grove |
$2,150,000 |
27.4% |
$1,159 |
45 |
-2.2% |
6 |
85 |
|
Coral Gables |
$1,875,000 |
-1.3% |
$744 |
17 |
54.5% |
9 |
92 |
|
YoY Comparison |
Median Sale Price |
Median Price per Square Foot |
Closed Sales |
Months of Inventory |
Days on Market |
|
Brickell |
Up |
Up |
Up |
Down |
Up |
|
Downtown Miami |
Down |
Down |
Down |
Up |
Down |
|
Edgewater + A&E |
Down |
Up |
Up |
Down |
Up |
|
Coconut Grove |
Up |
Up |
Down |
Down |
Up |
|
Coral Gables |
Down |
Down |
Up |
Down |
Up |
— Conclusion
Historically, Q3 is one of Miami’s slower quarters for sales. But with the exception of Downtown Miami, all other Coastal Mainland neighborhoods reported strong-to-steady year-over-year activity, in line with the outlook presented in our Q2 2026 report.
As Miami’s luxury condo market enters another seasonally slower quarter, we expect sales momentum to hold across the broader Coastal Mainland market, even as price performance continues to vary immensely by neighborhood, price tier, building age, and whether the property is intended for end users or as a rental investment.
Furthermore, we expect Coastal Mainland to remain largely buyer friendly through much of the first half of 2027, with inventory projected to stay above the balanced 9–12-month range. Coconut Grove and Coral Gables will likely remain the exceptions, given their history of tighter supply.
Looking further ahead, planned development and continued investment by high-net-worth individuals—whether through home purchases, corporate relocations, or philanthropy—mean that most Coastal Mainland neighborhoods are positioned to look markedly different over the next 5 to 10 years. Buyers with a long-term outlook and the ability to hold through will be poised to benefit the most from this evolution.
For expert help with buying, investing in, or purchasing a Miami property, our expert team will put the numbers to work for you and help you make an informed decision about your next move. Call, text, or email us to get started.