


The Greater Downtown Miami luxury condo market is off to an unprecedented start. While all the signs for a strong Q1 2021 opening were there, the numbers we're seeing, like for most of Miami, are record-setting. Quarterly sales have boomed 200% year-over-year and inventory in Greater Downtown is tracking down to a more balanced level, and we could well be on the verge of entering a seller's market.
For Q1, Edgewater continues to rank as one of the leading neighborhoods for year-over-year sales growth in Miami. All 3 sub-districts in this study - Brickell, Edgewater and Downtown - have posted triple-digit, year-over-year sales growth. And, Brickell still offers buyers or investors the best entry point with lower prices year-over-year and the highest levels of inventory in all of Miami.
The overall Miami luxury condo market report for Q1 2021 shows even stronger signs of this long standing buyer's market coming to an end. Overall sales are at a record-high, inventory is at an all-time low and prices are inching higher with market demand. Collectively, this shows that Miami's luxury condo market is headed for a correction that is finally tipping the scales in favor of the seller.
Below is our exclusive analysis on how Downtown Miami, Edgewater, and Brickell performed over Q1 2021, along with a detailed comparison to the overall Miami luxury condo trends in terms of sales, prices, days on market, and inventory.
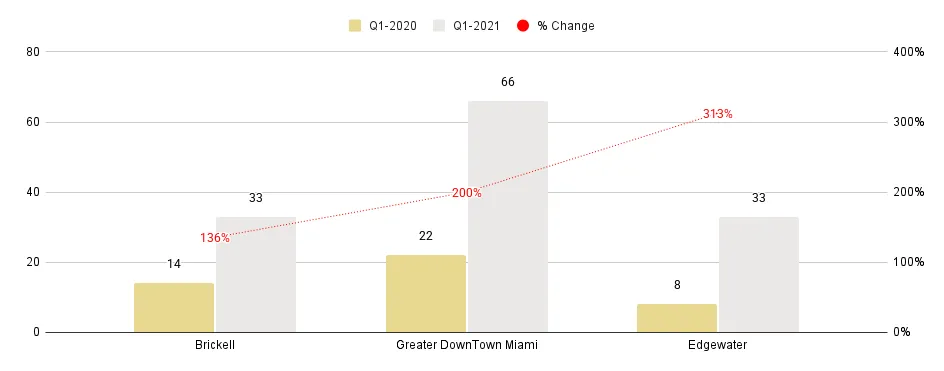
Overall Greater Downtown Miami Luxury Condo Markets at a Glance - Q1 2021 YoY (Number of Sales)
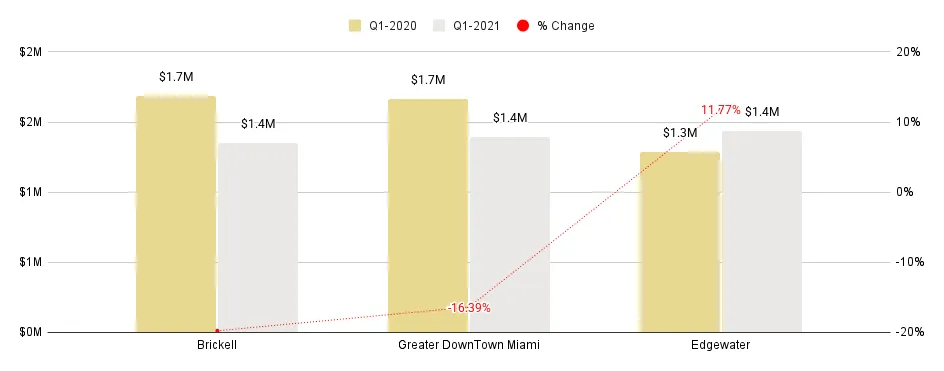
Overall Greater Downtown Miami Luxury Condo Markets at a Glance - Q1 2021 YoY (Median Sales Price)
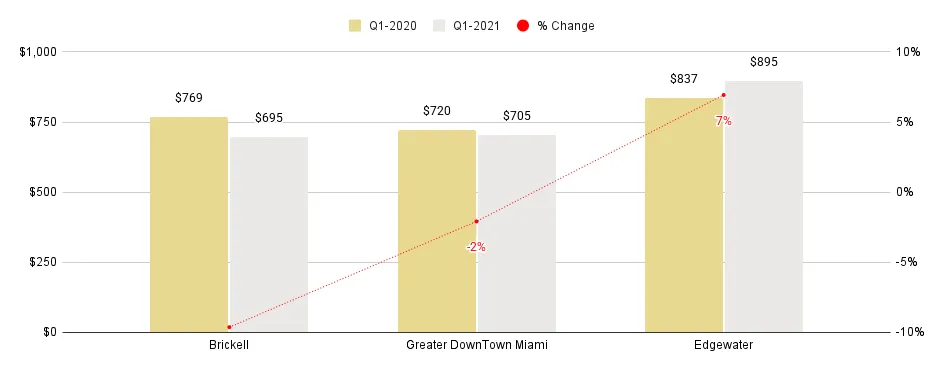
Overall Greater Downtown Miami Luxury Condo Markets at a Glance - Q1 2021 YoY (Median SP/SqFt)
For the purpose of this report, we've included areas with the zipcodes 33129, 33130, 33131, 33132, 33137 – essentially Brickell Hammock, Brickell, Brickell Key, Downtown, Arts & Entertainment District, Edgewater, Wynwood, Midtown and the Design District. This luxury condo market report only features properties priced $1 million and above.
Q1 2021 - Greater Downtown Miami Area Luxury Condo Market Highlights
- Sales soar 200% year-over-year
- 12-month Sales Trendline stays positive between Q4 2020 and Q1 2021
- Price per Square Foot stays flat (-2.1%) at $705/sq. ft.
- Median Sales Price down 16.4% year-over-year
- Days on Market up 98% year-over-year
- Inventory drops 51.4% year-over-year to 34 months
Edgewater
- Winner: One of top 2 leading neighborhoods in all of Miami for year-over-year sales growth with 313% increase, just behind Fisher Island (with a 340% increase)
- 12-month Sales Trendline stays positive between Q4 2020 and Q1 2021
- Price per Square Foot at $705, up 18% year-over-year, offering great value to sellers
- Median Sales Price up 11.8% year-over-year
- Days on Market up 82% year-over-year
- Inventory drops 58.3% year-over-year to 30 months
Brickell
- Sales soar 135.7% year-over-year
- 12-month Sales Trendline stays positive between Q4 2020 and Q1 2021
- Price per Square Foot at $695, down 9.6% year-over-year
- Median Sales Price down 19.8% year-over-year
- Days on Market up 97% year-over-year
- Inventory down 44.1% year-over-year, but highest of all Miami neighborhoods
Table of Contents
- Greater Downtown Miami Luxury Condo Sales Trends
- Greater Downtown Miami Luxury Condo Price Trends
- Greater Downtown Miami Luxury Condo Days on Market Trends
- Greater Downtown Miami Luxury Condo Inventory Trends
- Edgewater Neighborhood Trends - Overall Sales
- Edgewater Neighborhood Trends - Sales Price, Price/Square Foot
- Edgewater Neighborhood Trends - Days on Market
- Edgewater Neighborhood Trends - Inventory
- Brickell Neighborhood Trends - Overall Sales
- Brickell Neighborhood Trends - Sales Price, Price/Square Foot
- Brickell Neighborhood Trends - Days on Market
- Brickell Neighborhood Trends - Inventory
- Conclusion
|
Q1-2021 Greater Downtown Miami Luxury Condo Market Summary - Fig. 1 |
|||||||
|
Quarters |
Number of Sales |
% change in Sales |
Median Sale Price |
% change in Median Sale Price |
Median Sp/Sqft |
% change in Median Sp/Sqft |
Median of DOM |
|
Q1-2021 |
66 |
200.0% |
$1,390,000 |
-16.4% |
$705 |
-2.1% |
259 |
|
Q1-2020 |
22 |
$1,662,500 |
$720 |
131 |
|||
Overall Greater Downtown Miami Luxury Condo Market Trends: Q1 Sales Up to Record-High
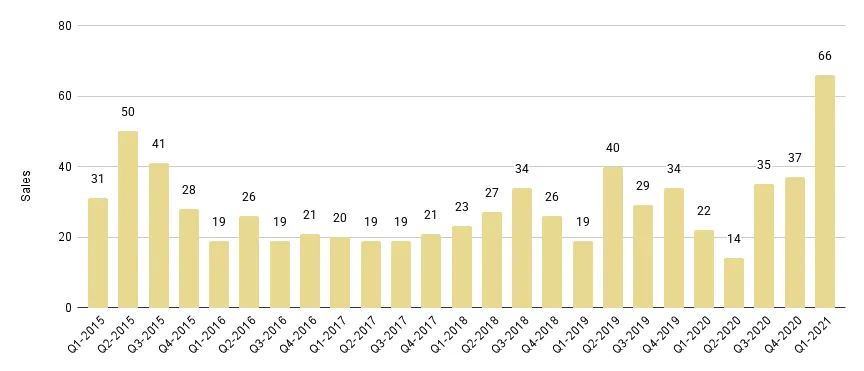
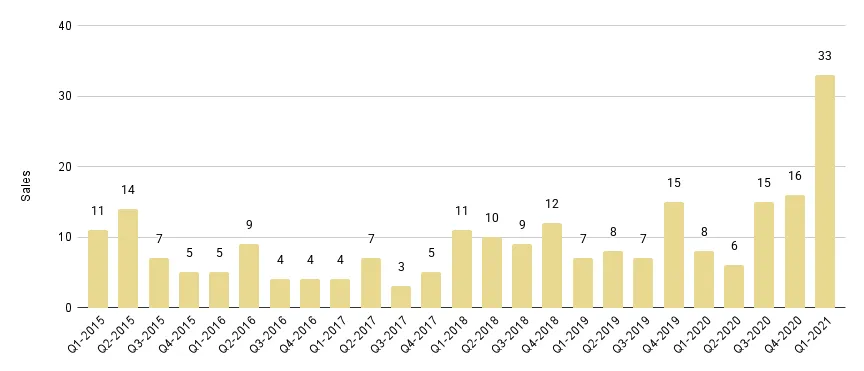
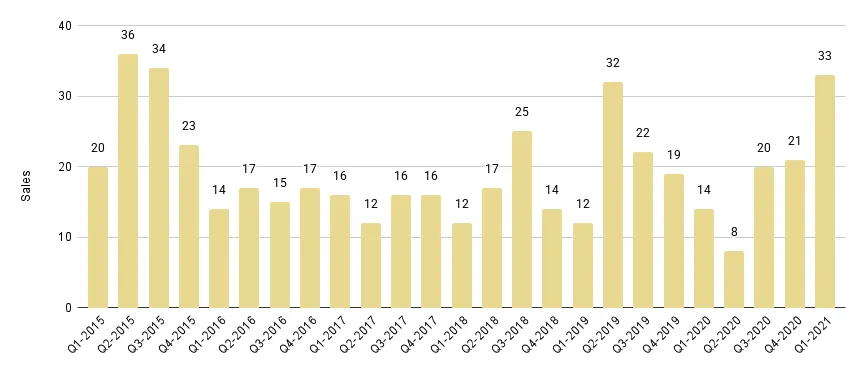
200% growth in year-over-year Sales with positive trendline. After hitting their lowest point in Q2 2020, sales have been steadily on the increase in this collective neighborhood (see Fig 2.1). Posting higher quarter-over-quarter sales for 3 consecutive quarters, volumes finally boomed to a total of 66 closed sales for luxury condos in Q1 2021 - setting a new record with the highest quarterly sales seen in over 6 years.
Consistent with the overall sales trend seen in Miami, Greater Downtown Miami also posted triple-digit, year-over-year growth - an impressive 200% increase over Q1 2020. This also sets a new record for growth in the combined district.
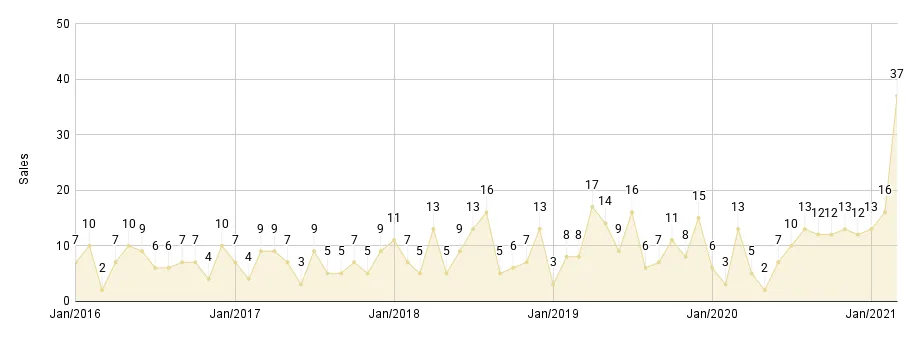
A look into the Monthly Sales chart of Fig. 2.2 below shows that sales were consistently higher throughout the quarter. January closed with 13 sales against the previous year's 6 sales. February posted 16 sales compared to last year's 3 sales. And, March reported the highest monthly sales in over 6 years with 37 sales, compared to the previous year's 13 sales.
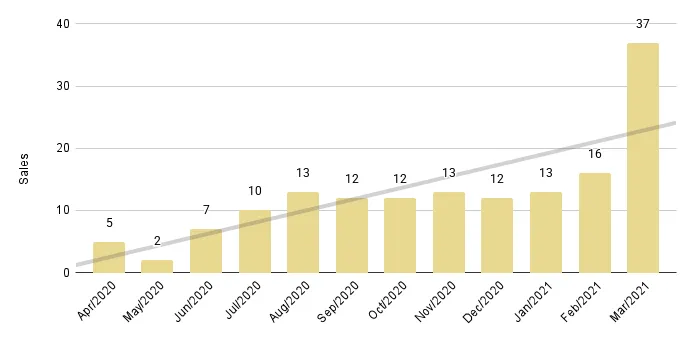
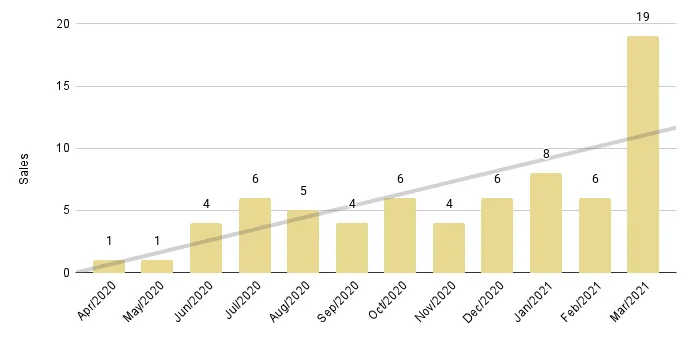
Owing to this booming growth, the 12-month Sales Trendline of Fig. 2.3 stays positive between Q4 2020 and Q1 2021.
With an increasing number of businesses, their top talent, and wealthy folks from the northeast, midwest, and California migrating to Miami for our bevy of tax benefits, as real estate experts, we expect this momentum to carry into the second quarter of 2021, at least, after which the market is historically known to cool off for a few cycles.
Greater Downtown Miami Luxury Condo Quarterly Sales 2015 - 2021 - Fig. 2.1
Greater Downtown Miami Luxury Condo Monthly Sales from Jan. 2016 to Mar. 2021 - Fig. 2.2
Greater Downtown Miami Luxury Condo 12-Month Sales with Trendline - Fig. 2.3
Downtown Miami Luxury Condo Price per Square Foot Flat, Sales Price Down YoY
Price per Square Foot flat at $705, Median Sales Price down 16.4% year-over-year. Moving against the overall Miami market trend of higher year-over-year prices, luxury condos in Greater Downtown Miami report flat-to-lower prices.
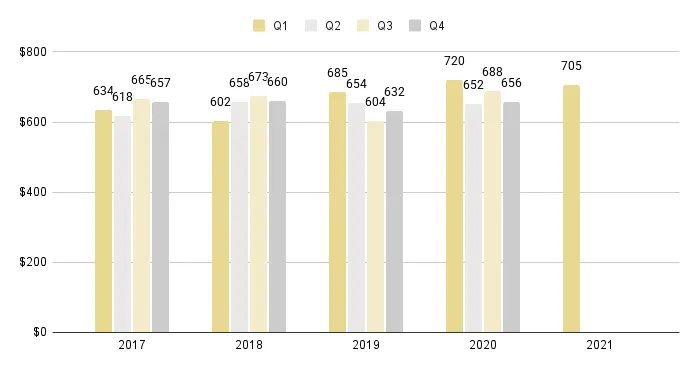
The Price per Square Foot is mostly flat year-over-year, adjusting only slightly (-2.1%), down from $720 in Q1 2020 to $705 for the same quarter 2021. However, the Median Sales Price posts a significant decrease of 16.4%, down from $1,662,500 in Q1 last year to $1,390,000 for the same quarter 2021 (Fig. 1).
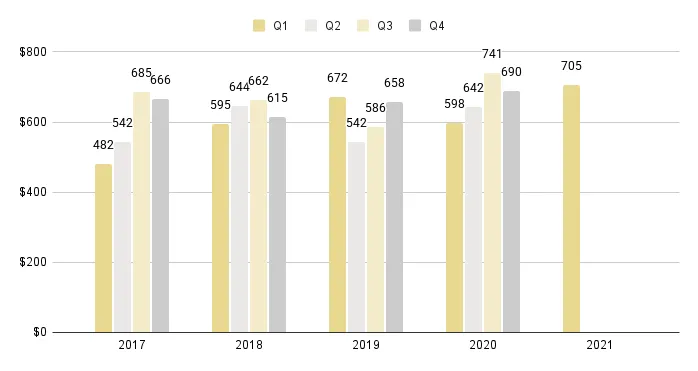
A look at the five-year snapshot of quarterly prices per square foot below (Fig. 3) reveals that prices still closed in the higher range - indicating that prices in the area will continue to increase in tandem with market demand, even though they seem to be taking a break this quarter.
Greater Downtown Miami Luxury Condo Quarterly Price per Sq. Ft. 2016-2021 - Fig. 3
Days on Market Up QoQ & YoY in Downtown Miami
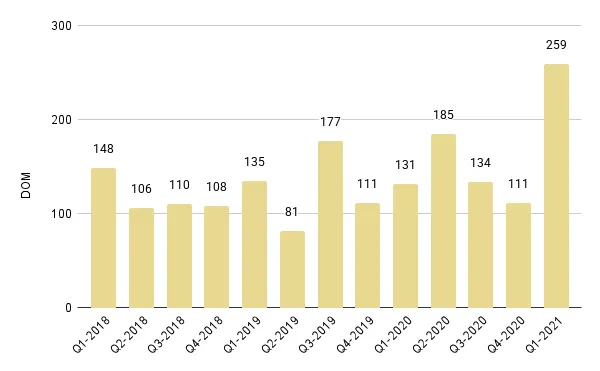
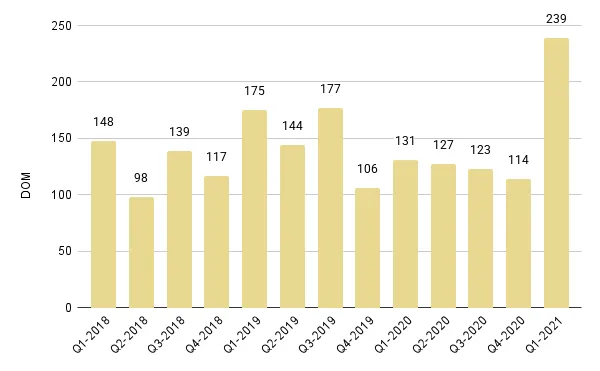
98% increase in year-over-year Days on Market. Consistent with the overall Miami luxury condo market trend of higher year-over-year Days on Market, luxury condos in this neighborhood spent 128 extra days on the market compared to Q1 last year (Fig. 4). The metric also posts an increase of 148 days (median) on a quarter-over-quarter basis.
What's worth noting here is that while Days on Market (DOM) is up significantly, this increase is because the market finally caught up with many sellers who were holding their line on pricing, or had paused or temporarily taken their listings off the market and then relisted again to make the most of a booming sales season. So, even as sales momentum picked up during the first quarter, these properties carried their "original date" of listing, increasing their overall days spent on the market. We will likely continue to see high DOM for the same reasons during subsequent quarters until the market recalibrates.
Greater Downtown Miami Luxury Condo Quarterly Days on Market 2018 - 2021 – Fig. 4
Condo Inventory Down to Historical Low in Downtown Miami, Sellers Gain Advantage
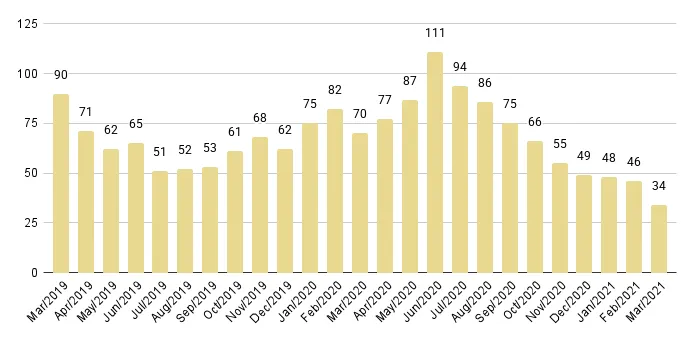
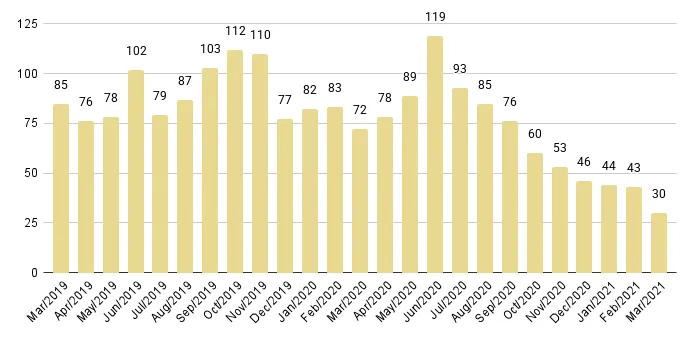
Q1 2021 closes with 34 months of Inventory. In sync with the overall market trend in Miami, inventory in this core neighborhood has been constantly dropping over the past quarters (Fig. 5). Down to only 34 months from June 2020's peak of 111 months, inventory in the neighborhood has shrunk by almost 70% in less than a year.
Marking unprecedented progress, levels have come down 30.6% quarter-over-quarter and 51.4% year-over-year. This is the lowest level of inventory we've seen for the neighborhood in over 5 years of our reporting.
With levels getting closer to the ideal 9-12-month mark of a balanced market, buyers have a very short window of opportunity to grab the best luxury condo deals. With prices trekking upwards and inventory continuing its descent, Miami's luxury condo segment is moving towards a seller's market.
To see luxury condos available now, search the Greater Downtown Miami area here.
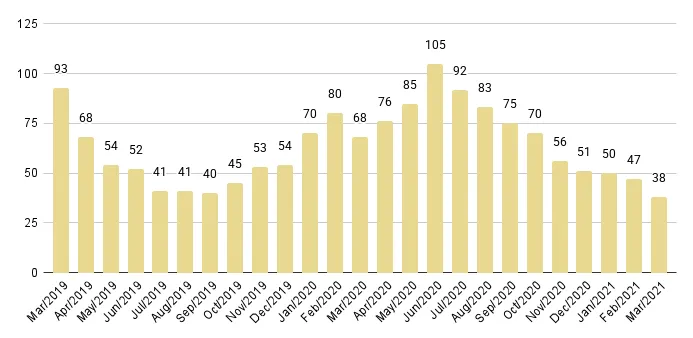
Greater Downtown Miami Luxury Condo Months of Inventory from Mar. 2019 to Mar. 2021 - Fig. 5
A balanced market has only 9-12 months of inventory. The months of inventory are calculated as – no. of active listings + no. of pending listings divided by the average number of deals in the last 6 months.
Greater Downtown Miami Neighborhoods: Edgewater Market Trends (33132 and 33137)
|
Q1 2021 Edgewater Luxury Condo Market Summary – Fig. 6 |
|||||||
|
Quarters |
Number of Sales |
% change in Sales |
Median Sale Price |
% change in Median Sale Price |
Median Sp/Sqft |
% change in Median Sp/Sqft |
Median of DOM |
|
Q1-2021 |
33 |
312.5% |
$1,439,000 |
11.8% |
$705 |
18.0% |
239 |
|
Q1-2020 |
8 |
$1,287,500 |
$598 |
131 |
|||
Edgewater Luxury Condo Sales Up YoY, Leading Growth in Miami
Q1 2021 sales skyrocket 313% with positive trendline. Maintaining its Q3 2020 position of being one of the leading neighborhoods for sales growth in Miami, Edgewater retains its tag of "one of the fastest-growing neighborhoods" in Q1 2021 as well. (It is second only to Fisher Island, which reported a year-over-year growth rate of 340% in Q1).
Consistent with the overall market trend in Miami, Edgewater sets a new record with the highest sales in a quarter in over 6 years of our reporting (Fig. 7.1). With a 313% year-over-year increase, the neighborhood also set a new record for year-over-year growth.
With such incredible momentum, the 12-month Sales Trendline expectedly stays positive between Q4 2020 and Q1 2021 (see Fig. 7.2).
Edgewater Luxury Condo Quarterly Sales 2015 - 2021 - Fig. 7.1
Edgewater Luxury Condo 12-Month Sales Trendline - Fig. 7.2
Edgewater Price per Square Foot & Sales Price Up YoY
Price per Square Foot up 18% to $705, Median Sales Price up 11.8% year-over-year. Moving with the overall market trend of higher year-over-year prices, Edgewater posts an increase in both its Price per Square Foot and Median Sales Price.
The Price per Square Foot for the neighborhood increased 18% from $598 in Q1 last year to $705 this year (Fig. 8). The Median Sales Price rose 11.8%, up from $1,287,500 in Q1 2020 to $1,439,000 for the same quarter this year (Fig. 6).
A look at the five-year snapshot of quarterly Price per Square Foot below reveals that prices closed in the higher ranges for this bayfront neighborhood. With the last 2 quarters posting higher year-over-year prices, in addition to an increase in sales, sellers in Edgewater are getting great value for their luxury properties and seeing ample buyer demand, as we are seeing many deals close with multiple offers.
Edgewater Luxury Condo Quarterly Price per Sq. Ft. 2016-2021 - Fig. 8
Days on Market Up QoQ & YoY in Edgewater
82% increase in year-over-year Days on Market. Consistent with the overall market trend of higher year-over-year Days on Market, Edgewater's luxury condos spent 108 extra days on market (median) compared to Q1 2020, and 125 more days compared to Q4 last year (Fig. 9). Again, this uptick has less to do with buyer-seller communication and more to do with market calibration and "temp off the market" properties becoming active again, as mentioned earlier in this report.
Edgewater Luxury Condo Quarterly Days on Market 2018-2021 – Fig. 9
Edgewater Inventory Down to Record Low
Q1 closes with 30 months of Inventory. Emerging as one of the fastest moving Miami neighborhoods in recent quarters, inventory dropped to one-fourth (30) of its peak numbers (119) in June 2020.
Going with the overall market trend of historically low levels, Edgewater posted the lowest inventory (30 months) we've seen in over 5 years of our reporting. Luxury condo inventory declined 34.8% quarter-over-quarter and 58.3% year-over-year. This puts this residential neighborhood closer than ever to reaching the 9-12-month benchmark of a balanced market. Interested buyers can search Edgewater condos for sale here while the market is still in their favor.
Edgewater Luxury Condo Months of Inventory from Mar. 2019 to Mar 2021 - Fig. 10
A balanced market has only 9-12 months of inventory. The months of inventory are calculated as – no. of active listings + no. of pending listings divided by the average number of deals in the last 6 months.
Greater Downtown Miami Neighborhoods: Brickell Market Trends (33129, 33130 and 33131)
|
Q1 2021 Brickell Luxury Condo Market Summary - Fig. 11 |
|||||||
|
Quarters |
Number of Sales |
% change in Sales |
Median Sale Price |
% change in Median Sale Price |
Median Sp/Sqft |
% change in Median Sp/Sqft |
Median of DOM |
|
Q1-2021 |
33 |
135.7% |
$1,350,000 |
-19.8% |
$695 |
-9.6% |
264 |
|
Q1-2020 |
14 |
$1,682,500 |
$769 |
134 |
|||
Brickell Luxury Condo Sales Highest Seen in a First Quarter
135.7% growth in year-over-year Sales with positive trendline. In sync with the overall Miami market trend of higher year-over-year sales, the luxury condo market in Brickell posted a 135.7% increase. Setting the record for sales in a first-quarter, this is the highest recorded volume for a first quarter in over 6 years for this key financial district of Miami.
Consistent quarter-over-quarter sales further keep the 12-month Sales Trendline positive between Q4 2020 and Q1 2021 (Fig. 12.2).
Brickell Luxury Condo Quarterly Sales 2015 - 2021 - Fig. 12.1
Brickell Luxury Condo 12-Month Sales with Trendline - Fig. 12.2
Brickell Luxury Condo Price per Square Foot + Sales Price Down YoY
Price per Square Foot dips 9.6% to $695, Median Price also down 19.8% year-over-year. In contrast to the overall market trend in Miami, Brickell reported a decline in both its year-over-year Price per Square Foot and Median Sales Price.
The Price per Square Foot dropped 9.6%, down from $769 in Q1 last year to $695 this year. The Median Sales Price dropped 19.8%, from $1,682,500 in Q1 last year to $1,350,000 for the same quarter this year (Fig. 11).
A look at the five-year snapshot of quarterly prices per square foot below (Fig. 13) reveals that prices closed in the mid-ranges for the period under review – keeping a window open for buyers and investors to get good deals in this business district.
Brickell Luxury Condo Quarterly Price per Sq. Ft. 2016-2021 - Fig. 13
Brickell Days on Market Up QoQ & YoY
97% increase in year-over-year Days on Market. In line with the overall market trend in Miami of higher year-over-year days on market, Brickell's luxury condos spent 130 extra days on the market compared to Q1 last year, and 159 more days compared to the previous quarter. As mentioned earlier in this report, this increase is more about market recalibration and reactivated listings, raising their overall days spent on the market, rather than significant buyer-seller communication issues.
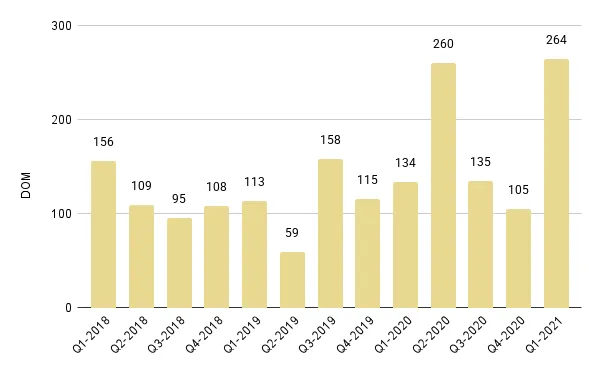
Brickell Luxury Condo Quarterly Median Days on Market 2018 – 2021 - Fig. 14
Brickell Inventory Down YoY, but Highest in Miami Overall
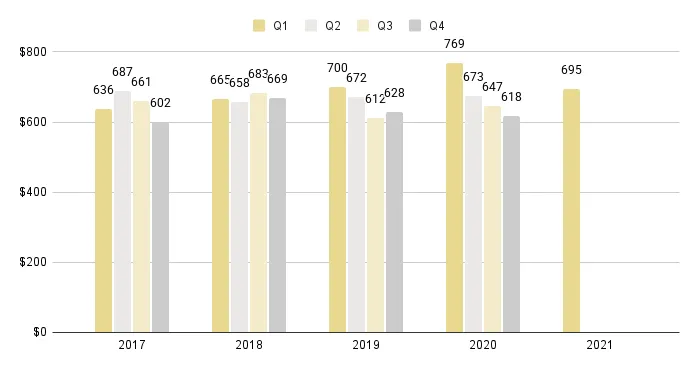
Q1 closes with 38 months of Inventory. In line with the overall market trend of lower year-over-year inventory, Brickell posted huge progress reducing inventory levels. Down 63% from June 2020's peak of 105 months, inventory is at its lowest in over 6 years of our reporting.
At 38 months, inventory is down 25.5% quarter-over-quarter and 44% year-over-year. With levels closer to reaching a market ideal of 9-12 months, buyers have only a limited time before the market corrects to a seller-favoring position. Still, as Brickell reports the highest levels of inventory in all of Miami, buyers can take this as a chance to drive deals in their favor. Search here for available Brickell luxury condos for sale.
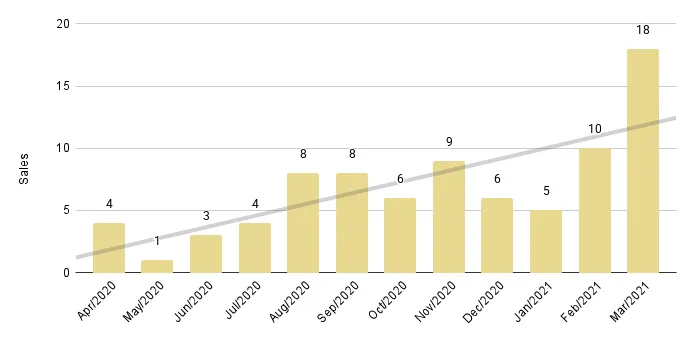
Brickell Luxury Condo Months of Inventory from Mar. 2017 to Mar. 2021 - Fig. 15
A balanced market has only 9-12 months of inventory. The months of inventory are calculated as – no. of active listings + no. of pending listings divided by the average number of deals in the last 6 months.
Q1 2021 Greater Downtown Miami Market Conclusion
While we had predicted the market to open 2021 on a strong note (read Q4 2020 report here), the numbers we're seeing are beyond expectations. With all 3 sub-markets in the Miami urban core posting triple-digit, year-over-year sales growth, the luxury condo market is moving out of the long, buyer-friendly cycle we've been reporting for more than 6 years.
Edgewater again takes the limelight this first quarter as one of the fastest growing markets in Miami. Reporting the second highest percentage increase in year-over-year sales out of all Miami neighborhoods in our analysis, Edgewater has emerged as a leading neighborhood for growth for 3 quarters in a row.
On the whole, Greater Downtown, Brickell, and Edgewater, all report outstanding sales and record-breaking numbers, just like the overall Miami luxury condo market trend. The 12-month Sales Trendline is positive across the board, like the overall Miami market report for Q1 2021.
On the price front, Edgewater is the only neighborhood to post year-over-year gains, like the overall Miami numbers – offering great value to sellers and owners. Deviating from this positive trend, while Greater Downtown posted flat prices, Brickell posted a decline in year-over-year prices.
The Days on Market are higher across the board, like the overall Miami trend, majorly due to market recalibration and renewed listings. So, even if they were sold quickly on their return, the original date of listing matters, taking their overall days on market count high even in a booming market.
One of the biggest impacts that these last two quarters of exceptional sales have had is that for the first time in over 5 years, inventory levels in this urban core have dropped to near-balanced levels. Luxury condo Inventory is down to its lowest in over 5 years of our reporting, across the board.
With Q1 opening as it has, we expect second quarter numbers to be strong, since historically it is known to be the best-performing quarter of the year. After that, the market naturally cools off, however, until then most sub-markets in Miami would have corrected to a balanced (if not completely seller's market), owing to the following factors:
- businesses as well as people continuing their migration from high-tax states,
- those working from home, exercising their newfound flexibility to build a life closer to the water or a tropical climate, and
- inventory keeping a low pace due to fewer deliveries in the immediate future.
|
Metric |
Overall Miami |
GDM |
Edgewater |
Brickell |
|
Sales |
Up |
Up |
Up |
Up |
|
Sales Trendline |
Positive |
Positive |
Positive |
Positive |
|
Price/Sq. Ft. |
Up |
Flat |
Up |
Down |
|
Days on Market |
Up |
Up |
Up |
Up |
|
Inventory |
Down |
Down |
Down |
Down |
Want more data and Miami market analyses? Subscribe (see the subscribe link on the top menu) to receive the latest market news in your inbox and share our blog.
Questions or comments about the stats? Interested in browsing the market? Contact Sep at sniakan (at) hbroswell.com or call 305-725-0566.
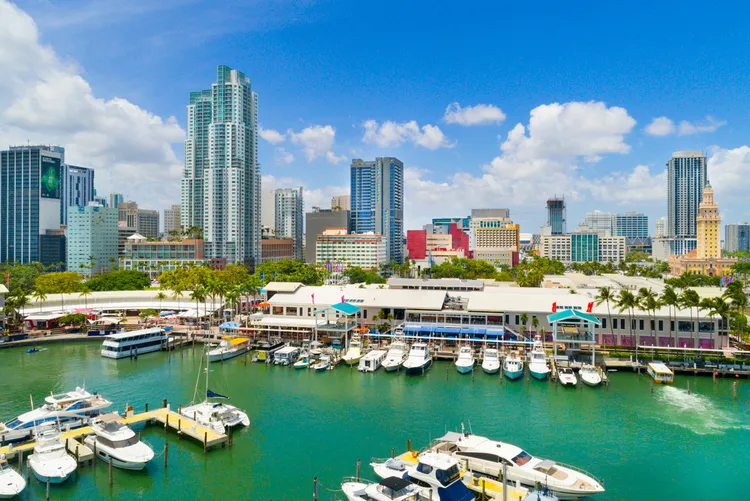
Cover: Bayside Marketplace in Downtown Miami. Photo courtesy of Bayside Marketplace