



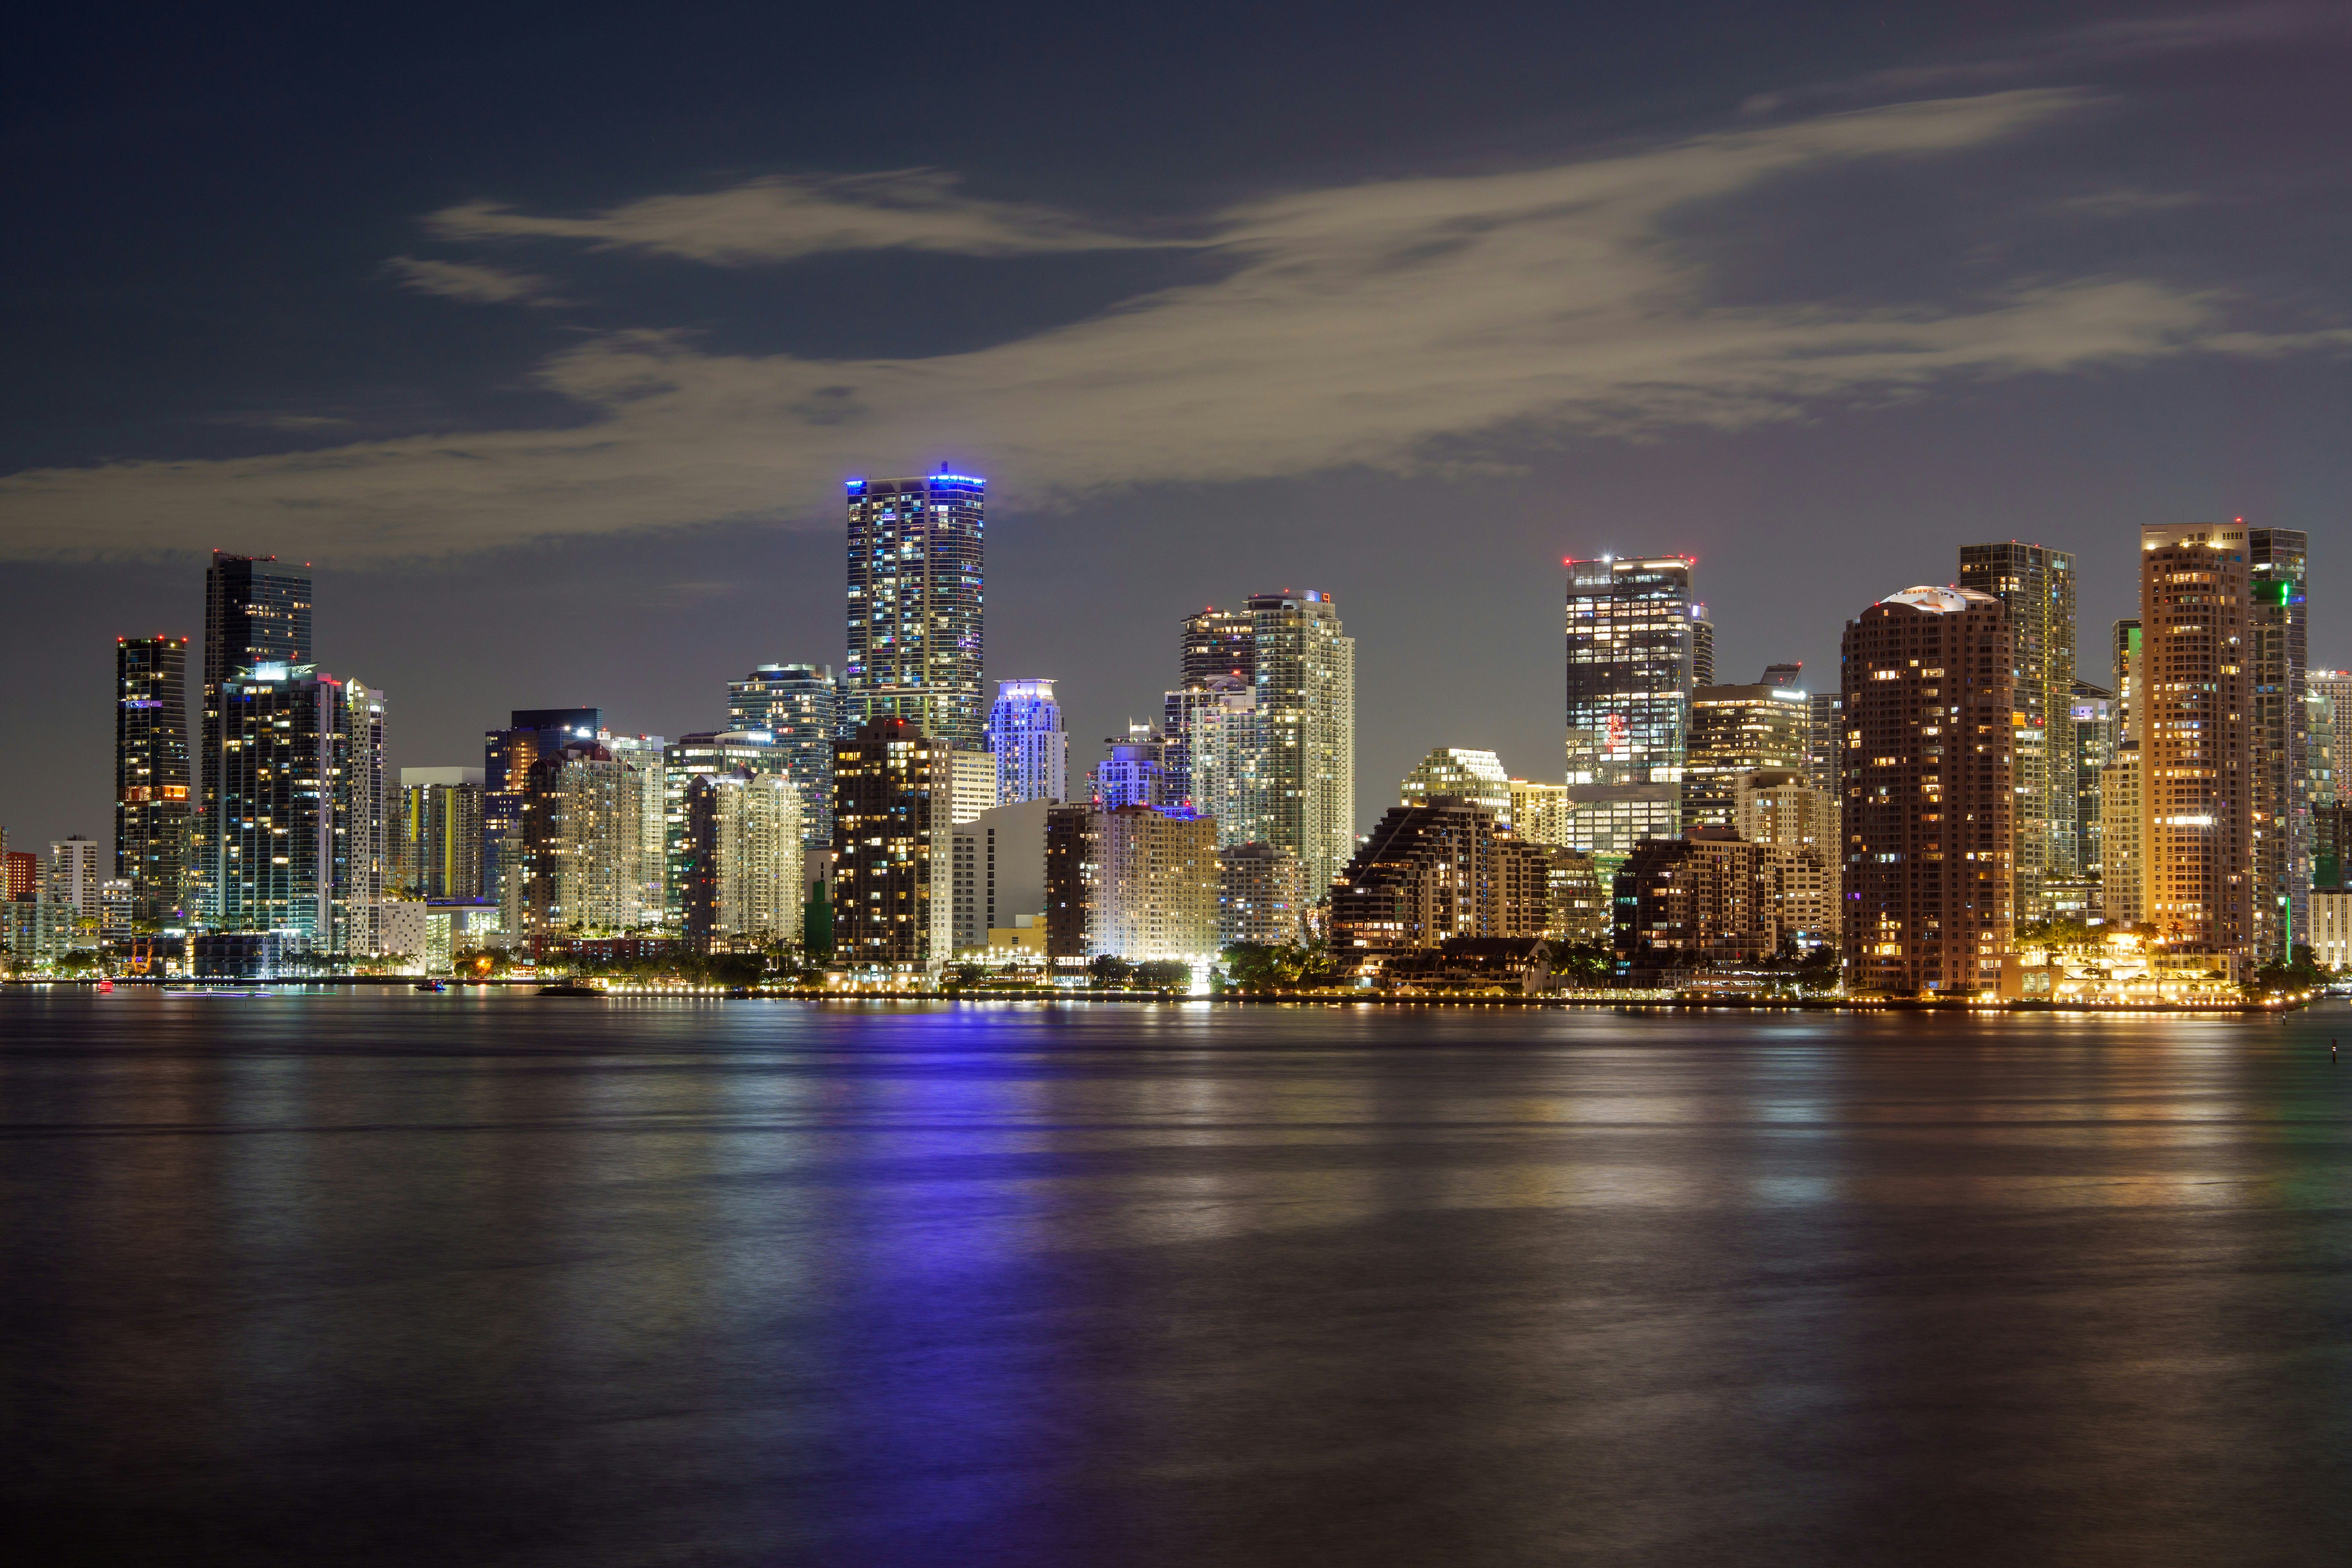
Miami is on a roll. Following the favorable conditions seen in Q4 2025, the Magic City’s $1M condo market recorded its third-strongest first quarter ever, with sales increasing 15.2% year-over-year and momentum expected to continue throughout 2026. Reduced interest rates and HOA fees made Miami and South Florida an attractive option for domestic buyers from high-tax areas concerned with protecting their wealth, reflecting a recent trend that’s still in full force. On the global front, the weakened U.S. dollar, a phenomenon that began in early 2025, captivated international buyers looking for a discount.
In the Miami region, Coconut Grove and Coral Gables emerged as the (combined) market leader, recording the highest-percentage sales growth, the strongest-percentage price gains, the fastest days on market, and the lowest inventory levels compared to the broader Great Downtown and Miami Beach.
We still find ourselves in a buyer’s market, where sellers have clarity as to what buyers are willing to pay but face competition due to surplus inventory; meanwhile, buyers are emboldened by the array of options available to them. Read on for our Q1 2026 Miami luxury-condo market summary, complete with on-the-ground data and our predictions for what’s to come.
— Key Statistics for Luxury Condos in Miami in Q1 2026
-
Closed sales: 424
-
Year-over-year change in closed sales: +15.2% (424 vs. 368 sales in Q1 2025)
-
Quarter-over-quarter change in closed sales: +25.4% (424 vs. 338 sales in Q4 2025)
-
Median sale price: $1.84M
-
Year-over-year change in median sale price: +2.3% ($1.84M vs. $1.8M in Q1 2025)
-
Quarter-over-quarter change in median sale price: +3.7% ($1.84M vs. $1.78M in Q4 2025)
-
Median price per square foot: $1,040
-
Year-over-year change in price/sq. ft.: -3.7% ($1,040 vs. $1,080 in Q1 2025)
-
Quarter-over-quarter change in price/sq. ft.: +2.1% ($1,040 vs. $1,019 in Q4 2025)
-
Inventory: 19 months
— Is Miami a Seller’s or a Buyer’s Market?
Inventory levels remained above the balanced 9–12-month range, keeping Miami’s luxury-condo segment firmly in buyer’s-market territory at the close of the first quarter. Based on our extensive experience in tracking luxury housing cycles, we expect buyer-friendly conditions to persist through the remainder of 2026.
At the same time, we anticipate several tailwinds contributing to a gradual reduction in excess supply. Stabilized HOA costs across many buildings, mortgage rates easing from year-ago levels, and a weaker U.S. dollar supporting international demand should help move the market toward more balanced conditions by early to mid-2027.
— Miami’s $2M+ Condo Market
Thanks to continued business and wealth migration along with sellers adjusting prices to remain competitive in a buyer’s market, Miami’s top-end condo segment received a significant boost this first quarter, with sales growing 25.9% year-over-year. Days on market have remained flat.
Miami’s luxury segment now effectively begins at around $2.5 million, while ultra-luxury properties typically start in the $10–15-million range. Our $2M+ Spotlight further down contains additional insights and trends.
— The Takeaway
As we move into Q2, historically Miami’s strongest quarter for the luxury condo market, we expect further growth in sales activity, a reduction in inventory levels, and relatively stable pricing. Positive momentum-building catalysts are already beginning to take effect, as reflected in our Q1 2026 Miami condo report, supporting Miami’s continued evolution from a discretionary housing market into a more strategic luxury destination.
If you’re thinking of selling your Miami condo, contact us for a personalized market evaluation and expert guidance on maximizing returns in today's buyer-friendly environment. With an exceptional track record of helping sellers achieve outstanding results, we're here to help you buy or sell with satisfaction.
Q1 2026 MIAMI LUXURY CONDO QUARTERLY MARKET SUMMARY
|
Quarter |
Closed Sales |
% Change in Closed Sales |
Median Sale Price |
% Change in Median Sale Price |
Median Price/sq. ft. |
% Change in Median Price/sq. ft. |
Median Days On Market |
|
Q1 2026 |
424 |
+15.2% |
$1,841,000 |
+2.3% |
$1,040 |
-3.7% |
93 |
|
Q1 2025 |
368 |
$1,800,000 |
$1,080 |
82 |
For this Miami luxury condo market report, we've only included properties priced $1 million and above. The neighborhoods included in this summary include Downtown Miami, Edgewater, Wynwood, Midtown, the Design District, Brickell, Coconut Grove, Coral Gables, Key Biscayne, Miami Beach, Fisher Island, Surfside, Bal Harbour, and Sunny Isles Beach.
— Q1 2026: Miami Luxury Condo Market Sales
Overall Sales Volume Up 15.2% from Q1 2025
With 424 Sales, Miami’s luxury condo market concluded Q1 2026 on a robust note. Starting the year strong, the market recorded its highest first-quarter sales outside the pandemic-triggered boom, trailing only Q1 2022 (744 sales) and Q1 2021 (478 sales).
Both year-over-year and quarter-over-quarter volumes increased, rising 15.2% compared to Q1 2025 and 25.4% versus Q4 2025. Unlike the pandemic-era spike, which was mostly driven by a reordering of lifestyle priorities, today’s market is operating under more normalized conditions, indicating that we’re looking at a more durable demand base for Miami’s luxury properties.
Moving into the typically high-energy second quarter of the year, the market is poised for further momentum. We expect improving fundamentals, including mortgage rates dropping to their lowest in over a year, insurance premiums declining, and reductions in HOA fees across most buildings.
Combined with Miami’s enduring appeal as a no-personal-income-tax state and an active lifestyle destination, these trends, in our view as market experts, should continue supporting demand for high-end housing through 2026.
Q1 2026 NEIGHBORHOOD SALES AT A GLANCE
|
Neighborhood |
Q1 2026 |
Q1 2025 |
% Change |
|
Greater Downtown Miami* |
112 |
92 |
+21.7% |
|
Miami Beach** |
231 |
220 |
+5% |
|
Coconut Grove & Coral Gables |
81 |
56 |
+44.6% |
*Greater Downtown Miami includes Edgewater, Brickell, and Downtown.
**Miami Beach includes South Beach, Mid-Beach, North Beach, Surfside, Bal Harbour, Sunny Isles, and Fisher Island.
Coconut Grove and Coral Gables (collectively) reported the highest year-over-year sales growth with a 44.6% surge, reflecting a buyer preference for prime, low-density residential enclaves located close to the water. It’s also worth noting that the Grove-Gables pairing has mostly led quarterly growth trends since 2023, now surpassing Miami Beach after two quarters.
In a more detailed breakdown of Miami’s neighborhoods, including Brickell, South Beach, Sunny Isles Beach, and others, Edgewater took the lead this first quarter, with the highest year-over-year sales growth. The bayfront neighborhood recorded a remarkable 120% uptick in year-over-year closed sales (44 in Q1 2026 vs. 20 in Q1 2025).
As anticipated in our Q4 2025 luxury condo market analysis, the market opened the year on a strong note, shifting the 12-month sales trendline from negative to flat. While this trajectory suggests a stable next quarter, Q2 is known to be the high season for Miami’s luxury condo market, from which we can anticipate even stronger momentum.
— Q1 2026: Miami Luxury-Condo Market Prices
Price per Square Foot Down 3.7% Year-over-Year to $1,040/Sq. Ft.
Q1 2026 closed with a median price of $1,040/sq. ft., reflecting a 3.7% year-over-year decline. Of note, the $1,000/sq. ft. threshold seems to be the new norm. The median sales price increased 2.3% year-over-year this first quarter, despite a softening in the price-per-square-foot stats.
As sellers continue adjusting prices to remain competitive in today’s market, we foresee either stability or slight corrections in upcoming quarters, particularly in segments facing higher inventory levels. As luxury housing specialists, our outlook for investor-driven and Airbnb-friendly properties remains unchanged, with further pricing pressure expected in the near future.
For a detailed trend analysis of prices by building year, subscribe to our newsletter to receive our comprehensive Miami Luxury Condo Market Report for Q1 2026.
Fisher Island stood out with the strongest price appreciation in Q1 2026, ranking as Miami’s most expensive neighborhood. Luxury condos in this exclusive island community posted a 19% year-over-year increase in price per square foot, with values rising from $2,004 in Q1 2025 to $2,391 in Q1 2026.
Meanwhile, the combined segment of Coconut Grove & Coral Gables recorded the highest year-over-year price gain at 9.2%, and Brickell hit a record-high $950/sq. ft. Downtown Miami remained the most affordable entry point into the luxury-condo segment, closing the first quarter with a median price of $730/sq. ft.
Q1 2026 PRICE-PER-SQUARE-FOOT AT A GLANCE
|
Neighborhood |
Q1 2026 |
Q1 2025 |
% Change |
|
Greater Downtown Miami* |
$886 |
$889 |
(-0.4%) |
|
Miami Beach** |
$1,178 |
$1,382 |
-14.8% |
|
Coconut Grove & Coral Gables |
$949 |
$869 |
+9.2% |
*Greater Downtown Miami includes Edgewater, Brickell, and Downtown.
**Miami Beach includes South Beach, Mid-Beach, North Beach, Surfside, Bal Harbour, Sunny Isles, and Fisher Island.
— Q1 2026: Miami Luxury-Condo Days on Market
Days on Market Up 13.4% Year-over-Year—Luxury Condos Took 93 Days to Sell
Even with one of the strongest first quarters on record in recent years, the days on market posted a year-over-year increase. We also saw the return of previously paused or withdrawn listings as sellers look to maximize exposure ahead of Miami’s traditional high season in Q2.
Reporting a median of 93 days on market in Q1 2026, the statistic rose 13.4% from the 82 days recorded in Q1 2025, as most neighborhoods in our first-quarter analysis posted increases. In a broader comparison of the three submarkets outlined below, Coconut Grove & Coral Gables (collectively) emerged as Miami’s fastest-selling in Q1 2026, with properties taking only 63 days to sell on median.
Q1 2026 DAYS ON MARKET AT A GLANCE
|
Neighborhood |
Q1 2026 |
Q1 2025 |
% Change |
|
Greater Downtown Miami* |
88 |
69 |
+28% |
|
Miami Beach** |
99 |
83 |
+19% |
|
Coconut Grove & Coral Gables |
63 |
96 |
-34% |
*Greater Downtown Miami includes Edgewater, Brickell, and Downtown.
**Miami Beach includes South Beach, Mid-Beach, North Beach, Surfside, Bal Harbour, Sunny Isles, and Fisher Island.
— Q1 2026: Miami Luxury-Condo Market Inventory
Overall Inventory Down to 19 months
A strong sales momentum contributed to a decline in the months of inventory this first quarter, following a broader trend of year-over-year increases observed over the past three years. There was a decline of 15.8% year-over-year from 22 months in Q1 2025.
With 11 months of inventory, Coconut Grove & Coral Gables (combined) recorded the lowest levels among the three broader Miami markets. While supply edged up slightly year-over-year, it remains the only sub-market approaching balanced market conditions, solidifying its position as one of Miami's most dynamic luxury enclaves.
Inventory levels remained elevated in Q1 2026, ending the quarter at 19 months and above the balanced market range of 9–12 months. This surplus continues to offer buyers more favorable negotiation dynamics as more properties fall within their target budgets.
We’re not expecting a full return to balanced market conditions this year, although we do anticipate the high season absorbing a significant amount of inventory in Q2. For the remainder of 2026, inventory levels are expected to remain above the ideal 9–12-month range, with stabilization likely to emerge first in the top-end segment as well as with homes that are either new or upgraded, reflecting the trend of buyers prioritizing move-in-ready convenience.
Q1 2026 INVENTORY AT A GLANCE
|
Neighborhood |
Q1 2026 |
Q1 2025 |
% Change |
|
Greater Downtown Miami* |
41 |
35 |
+17% |
|
Miami Beach** |
19 |
23 |
-17% |
|
Coconut Grove & Coral Gables |
11 |
9 |
+22% |
*Greater Downtown Miami includes Edgewater, Brickell, and Downtown.
**Miami Beach includes South Beach, Mid-Beach, North Beach, Surfside, Bal Harbour, Sunny Isles, and Fisher Island.
— Spotlight: Miami’s $2M+ Condo Market
Q1 2026 MIAMI $2M+ CONDO MARKET SUMMARY
|
Quarter |
Closed Sales |
% Change in Closed Sales |
Median Sale Price |
% Change in Median Sale Price |
Median Price/sq. ft. |
% Change in Median Price/sq. ft. |
Median Days On Market |
|
Q1 2026 |
204 |
+25.9% |
$3,635,396 |
+4.6% |
$1,381 |
-11.6% |
97 |
|
Q1 2025 |
162 |
$3,475,000 |
$1,562 |
98 |
$2M+ Segment Sales Up, Price/Sq. Ft. Down, Days on Market Flat
A closer look at the $2-million-and-up condo market data reveals the following key trends for Q1 2026:
-
Reporting 204 sales, first-quarter volumes surged 25.9% year-over-year, outperforming the broader $1-million-and-up condo market discussed above. As sellers adjusted pricing strategies, this “true luxury” segment received a significant boost, drawing motivated buyers back to the market.
-
Closing Q1 2026 at a median price of $1,381/sq. ft., this category recorded an 11.6% year-over-year decline, reflecting the price adjustments made by sellers in response to the buyer’s market. However, the median sales price increased 4.6% year-over-year to $3,635,396, indicating that larger residences, which have been the trend for new builds, continued to outperform even within this premium segment. Both price trends echo the patterns observed in the $1-million-and-up condo market.
-
At 97 days, the median days on market remained flat compared to the 98 days reported in Q1 2025.
— Q1 2026 Miami Neighborhood Luxury-Condo Market Summary
As mentioned, Miami’s luxury-condo market experienced one of its strongest first quarters on record with a sales increase of 15.2% year-over-year. Predictable mortgage rates and lower HOA fees were the driving factors behind restoring buyer confidence, while a weaker U.S. dollar motivated international buyers and helped accelerate momentum, which was already starting to build toward the tail end of last year.
Although the price per square foot softened 3.7% year-over-year to $1,040/sq. ft., the median sales price rose 2.3% to $1,841,000, highlighting sustained buyer preference for newer, larger, and higher-quality residences. And despite a decline (read: improvement) in inventory levels, Miami’s luxury-condo market closed Q1 2026 with 19 months of supply, maintaining its buyer-friendly position. With Q2 underway, we expect continued momentum beyond the typically active second quarter.
— Miami Luxury-Housing Market Predictions in 2026
With over two decades of luxury-condo market expertise and a close observation of evolving macroeconomic trends, we expect the following to influence market performance in 2026:
-
Thanks to the FIFA World Cup 2026, Miami is expected to see a major boost in short-term rental activity throughout June and July, particularly across the luxury segment. While we do not expect a dramatic surge in sales solely tied to the event, the added international exposure and influx of affluent visitors should contribute to an above-average summer market and a modest uptick in third-quarter sales activity.
-
Over the past few years, Miami has shed its vacation-city image to emerge as a globally recognized center for wealth, business, and financial power. The relocation of influential firms and founders, including Citadel, Palantir, Thiel Capital, Mark Zuckerberg, and Larry Page, has helped propel the city into the global elite and position it as the second-best U.S. city for entrepreneurs.
Today, Miami ranks among the world’s top 30 global cities, with the unique positioning of being a tropical oasis as well as a growing economic hub. As this reputation continues to strengthen, we expect sustained demand from affluent domestic and international buyers seeking security and opportunity in one of the world's most dynamic global cities. -
With tax pressures increasing in high-cost markets such as Seattle, New York, and California, Miami is increasingly emerging as a preferred portfolio and primary-residency destination for affluent buyers seeking a more favorable fiscal environment.
Beyond Florida’s longstanding advantage of having no personal-income tax, the state continues to strengthen its financial appeal through homestead exemptions and a growing legislative focus on reducing the property-tax burden for full-time homeowners. -
Miami concluded 2025 as the nation’s most competitive rental market, and continued wealth migration driven by corporate relocations is bringing more high-income residents to South Florida. Together, these trends are expected to further strengthen Miami’s appeal as a long-term investment market, particularly for its collection of luxury condos that allow rental flexibility.
-
As predicted, a weaker U.S. dollar combined with softer pricing helped drive increased foreign investment into Miami’s luxury residential market. In 2025 alone, foreign-buyer sales volume, led by Colombian buyers, reached $3.2 billion in Miami-Dade County, confirming Miami’s position as the number-one U.S. market for foreign home buyers. This momentum should continue as the dollar is expected to remain weak throughout 2026.
Watch our Miami 2026 condo-market-trends video for the full picture. |
For an in-depth analysis of the Q1 2026 Miami luxury-condo market, subscribe to this blog as we will soon be sharing additional reports for Miami (overall), Miami Beach, Greater Downtown Miami, and Coconut Grove plus Coral Gables (collectively). If you have specific questions about the data we covered or want a market assessment of your property, please reach out to us directly via call, email, or text. We’re always happy to help.