


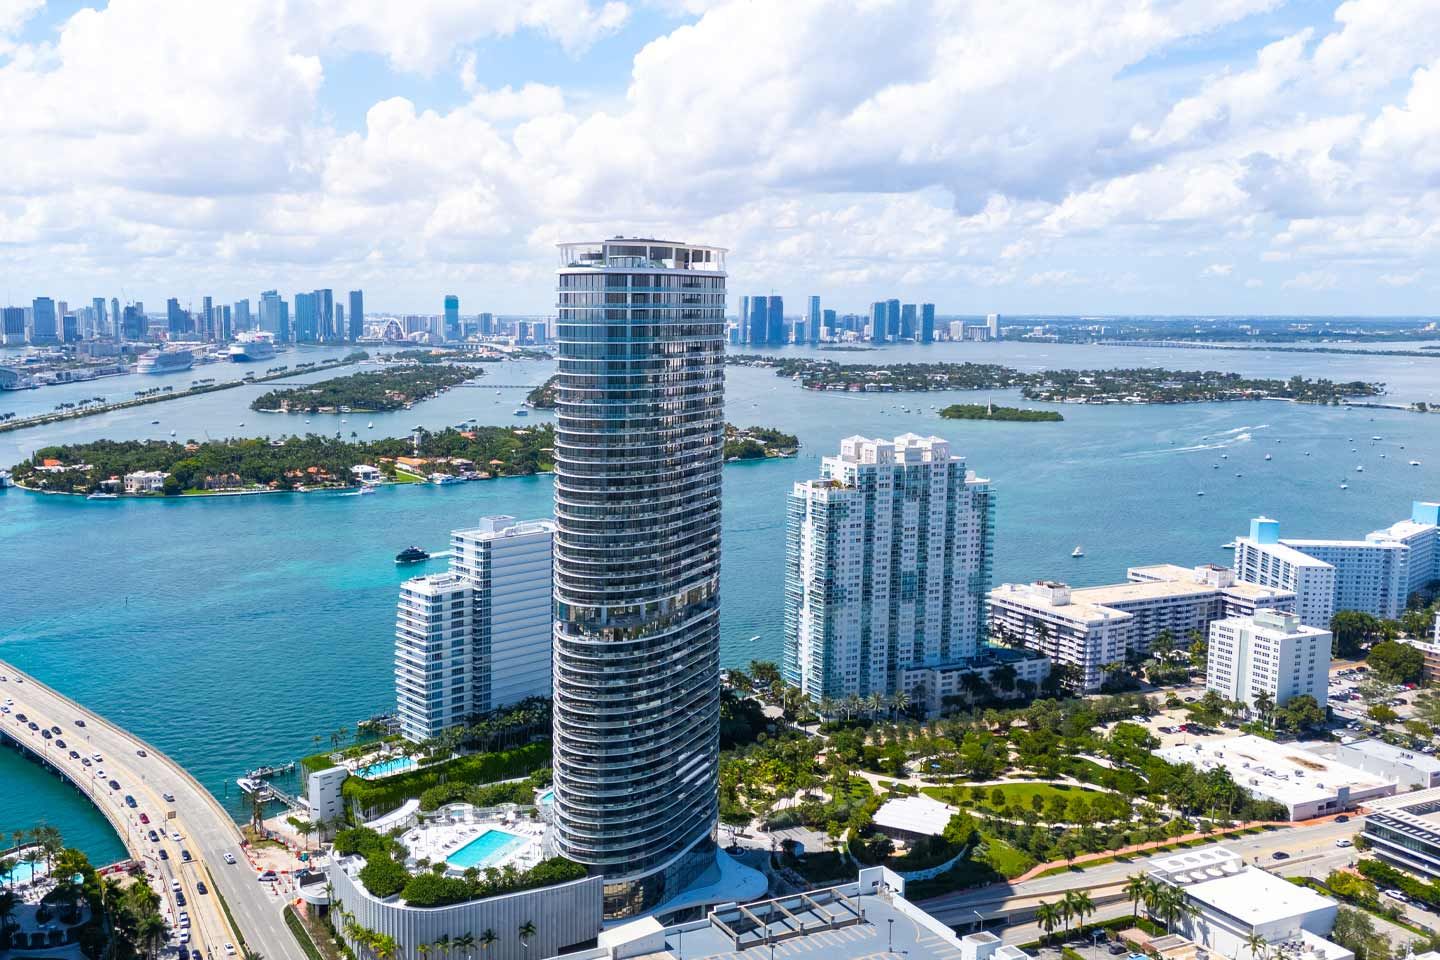
As Miami’s luxury condo market entered the traditionally slower half of the year, Miami Beach reported a relatively stable picture in Q3 2026, with sales remaining largely flat year-over-year. While the Coastal Mainland recorded stronger sales growth, Miami Beach accounted for $648 million or 63% of Miami’s total dollar volume in the $1M+ condo segment. Additionally, tighter inventory across Miami Beach continued to give sellers greater leverage.
Within this relatively stable market, Surfside & Bal Harbour emerged as the quarter’s standout performers, extending a trend established in Q2 2026 and accounting for five of Miami’s seven most expensive condo closings.
Meanwhile, South Beach stood out for its stronger all-around performance, combining the highest year-over-year price gains in Miami Beach with relatively steady sales and a sharp decline in inventory, making it the area's most seller-friendly market.
Sunny Isles Beach presented a contrasting opportunity. Despite leading Miami Beach in sales activity, its elevated inventory and softer pricing created more favorable conditions for buyers, particularly in the higher-priced tiers. Read on for a closer look.
This luxury condo market report only includes data for condos in Miami Beach priced $1 million and above. The Miami Beach grouping covers South Beach, Mid- & North Beach, Surfside & Bal Harbour, Sunny Isles Beach, and Fisher Island.
Contrasting Q2 2026, we have returned to the $1M+ price threshold for Q3 2026 to provide a more comprehensive overview of Miami’s luxury condo market. We’ve also expanded our market coverage to include a deeper analysis of four price tiers: Premium ($1–2M), Luxury ($2–5M), High Luxury ($5–10M), and Ultra Luxury ($10M+).

— Q3 2026 Miami Beach Highlights: $1M+ Condo Market
-
South Beach recorded Miami Beach’s strongest price gains, with a 9.1% year-over-year increase.
-
Fisher Island reaffirmed its position as Miami’s most expensive luxury condo market, with a median sale price of $10,400,000. Surfside & Bal Harbour followed at $3,100,000.
-
Surfside & Bal Harbour led Miami Beach in sales growth, with a 13.8% year-over-year increase.
-
Mid-Beach & North Beach emerged as Miami Beach’s fastest-selling luxury condo market, with a median of 59 days on market.
-
South Beach was Miami Beach’s most seller-friendly luxury condo market, with just 9 months of inventory.
-
Sunny Isles Beach remained the region’s strongest buyer’s market, with the highest inventory surplus at 19 months.
Median Sale Price

Closed Sales

Months of Inventory


— South Beach
-
Median sale price up from $2,090,000 to $2,280,000, a 9.1% year-over-year increase.
-
Closed sales slightly down from 45 to 43, a 4.4% year-over-year decrease.
-
Months of inventory down from 16 to 9 months, a 43.8% year-over-year decline.
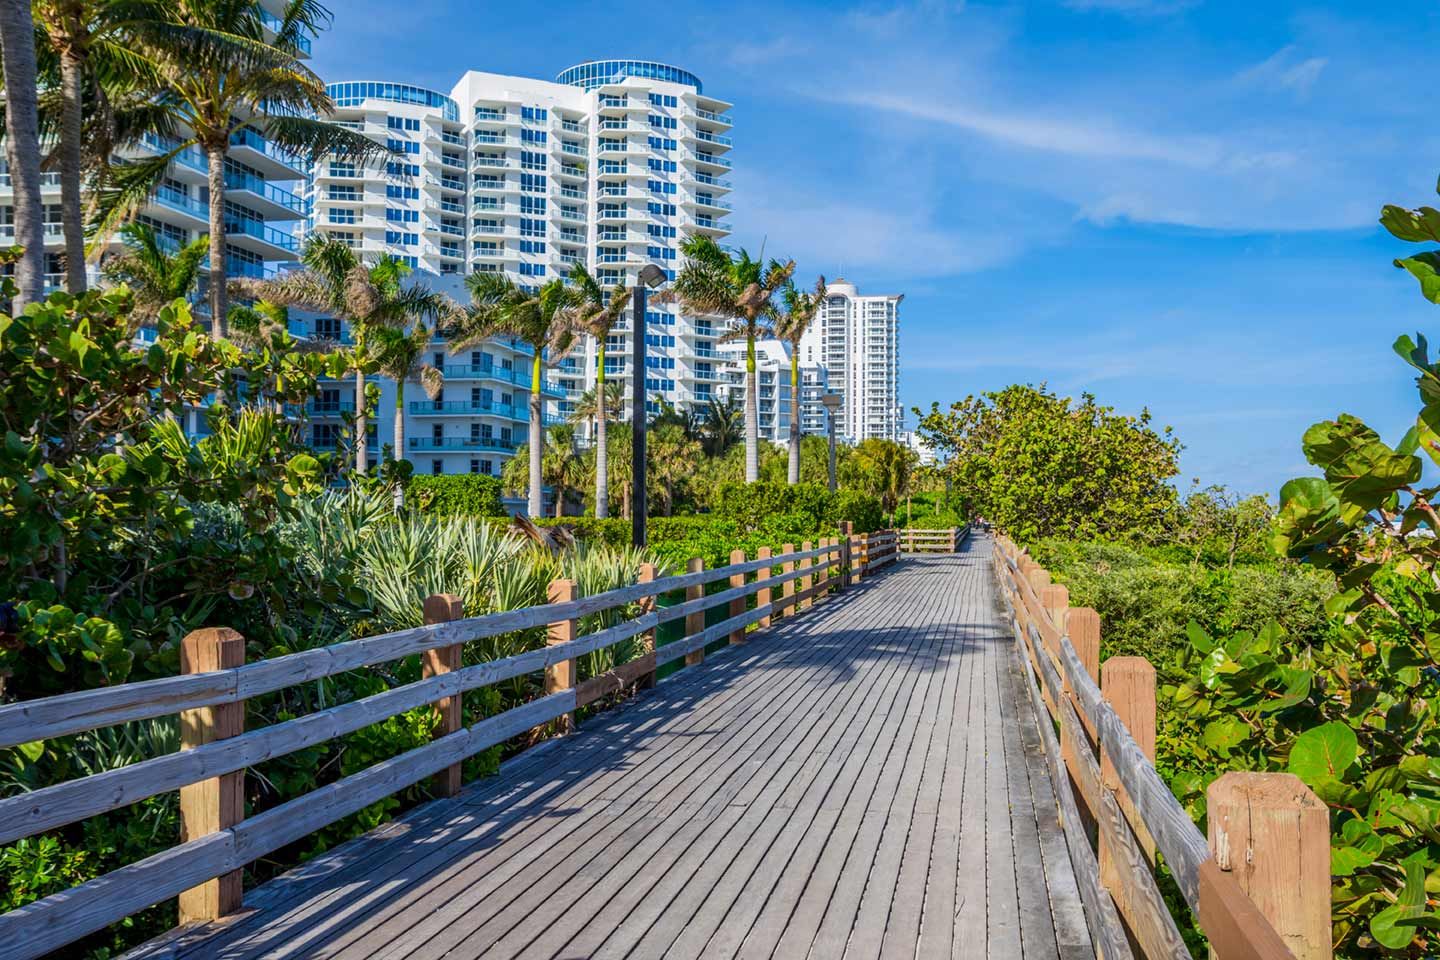
South Beach continued to rank among Miami’s strongest luxury condo markets in Q3 2026, with a median sale price of $2.28 million. It was among the top performers in overall Miami’s $1M+ market for price appreciation and the third most expensive neighborhood overall. It also reported its third-strongest Q3 on record, behind only 2021 and 2025.
South Beach’s top sale closed for $18.37 million at the Continuum South Tower, a legacy building, where two units were combined into a spacious five-bedroom, four-bathroom residence with a wraparound balcony and direct ocean views.
The $5–10M High Luxury tier led the quarter, with sales more than doubling year-over-year and dollar volume following suit. While most segments offered balanced opportunities for buyers and sellers, the $1–2M Premium tier gave buyers the greatest choice and negotiating leverage.
Blackbook Recommends
With momentum holding firm, inventory in South Beach’s $1M+ condo market fell sharply from 16 to 9 months—the lowest among Miami Beach neighborhoods and the second-lowest in the ten key markets we reviewed. This makes South Beach one of overall Miami’s most seller-friendly areas in an otherwise strong buyer’s market.
Beyond its residential appeal, South Beach is also seeing a shift in its commercial profile. Long associated with tourism, nightlife, and recreation, the neighborhood is increasingly attracting office investment. Pebb Capital’s recent $70M+ acquisition signals growing investor confidence in the area’s emergence as a serious office market.
Meanwhile, the reinvention of landmark Art Deco properties, including the Shore Club Private Collection Residences and Ritz-Carlton Residences South Beach, is ushering some of the neighborhood’s architectural gems into a new era of luxury living.
For buyers with a longer investment horizon, this blend of commercial growth, luxury development, and historic character adds another dimension to South Beach’s appeal.
Deeper Q3 2026 Analysis by Price Tier
|
|
$1–2M | $2–5M | $5–10M | $10M+ |
| Median Sale Price | $1,300,000 | $3,000,000 | $8,087,500 | $15,183,750 |
| Median Sale Price YoY | -8.60% | -8.40% | 20.70% | 2.80% |
| Median Price per Square Foot | $1,083 | $1,795 | $3,432 | $3,491 |
| Closed Sales | 19 | 15 | 7 | 2 |
| Closed Sales YoY | -5.00% | -21.10% | 133.30% | -33.30% |
| $ Volume | $26M | $46M | $55M | $30M |
| $ Volume YoY | -10.10% | -20.00% | 178.60% | -32.50% |
| % Share | 44.20% | 34.90% | 16.30% | 4.70% |
| $ Share | 16.30% | 29.20% | 35.20% | 19.30% |
| Months of Inventory | 10 | 9 | 8 | 9 |
| Days on Market | 69 | 107 | 145 | 89 |
— Mid-Beach & North Beach
-
Median sale price flat at $1,700,000, a negligible 0.1% year-over-year adjustment.
-
Closed sales slightly down from 36 to 35, a 2.8% year-over-year decrease.
-
Months of inventory down from 18 to 13 months, a 27.8% year-over-year decrease.
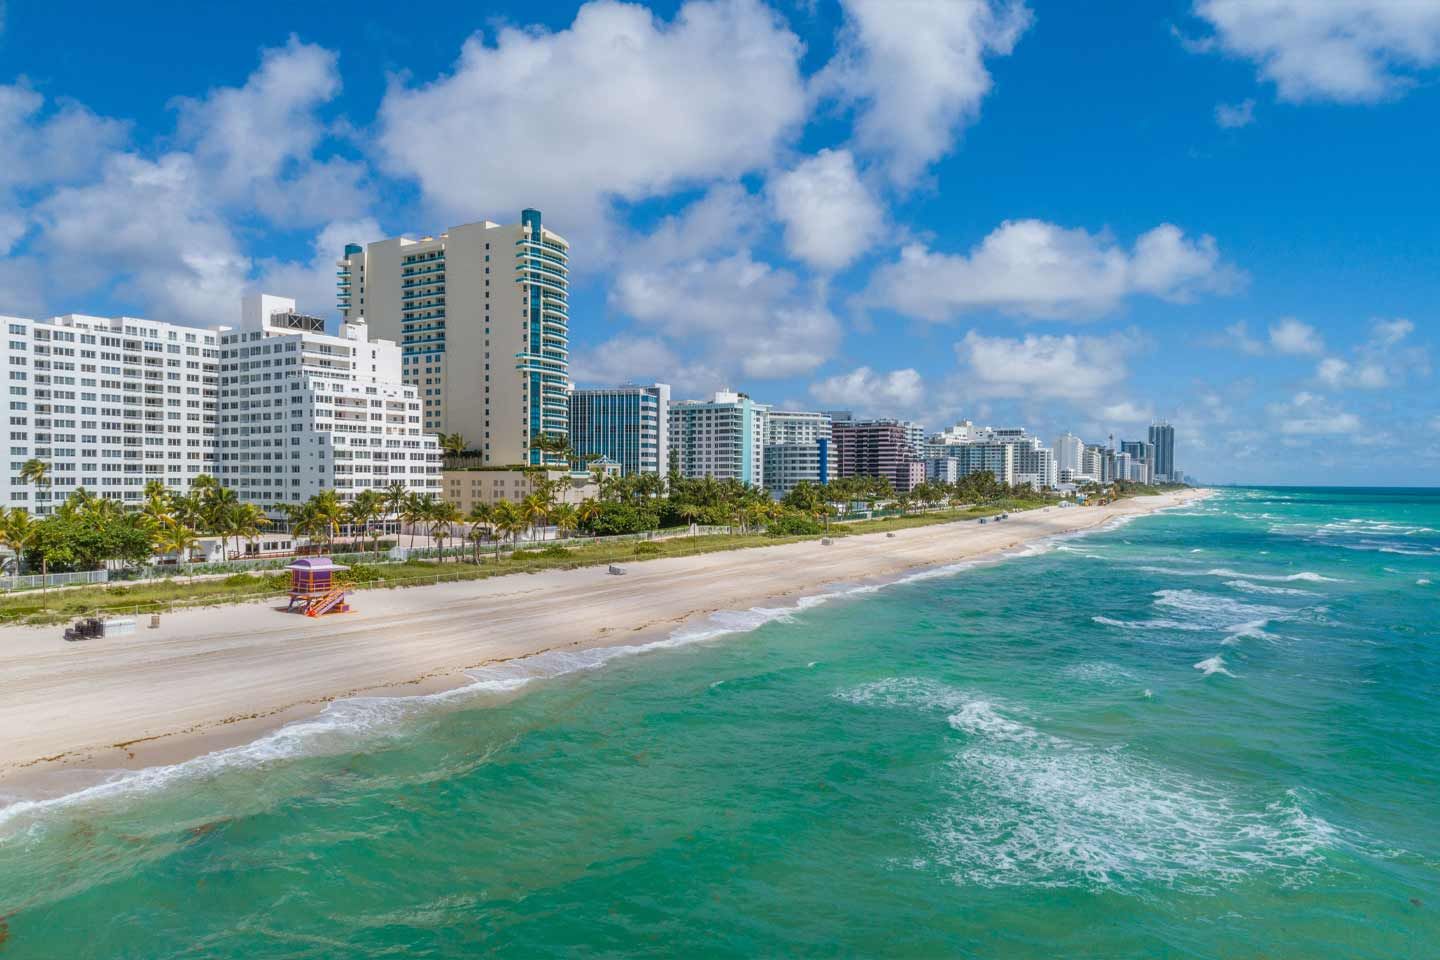
Mid-Beach & North Beach’s $1M+ condo market appeared relatively steady in Q3 2026, with median sale price, closed sales, and total dollar volume largely unchanged year-over-year. However, the underlying picture varied considerably by price tier.
The $10M+ Ultra-Luxury tier stole the spotlight, with three closings driving a 271.4% surge in dollar volume and a 23.6% increase in median sale price. By contrast, the $1–2M Premium segment continued to dominate activity, accounting for 57.1% of all sales, even as its median price dropped 10.2%. The $2–5M Luxury segment also gained traction, with sales up 33.3% and a 26.9% correction in median sale price.
These contrasting trends illustrate exactly what we have been highlighting this past year: relatively stable year-over-year market-wide figures mask considerable differences across individual price segments.
Blackbook Recommends
Inventory in Mid-Beach & North Beach’s luxury condo market tightened from 18 to 13 months in Q3 2026. Despite this improvement, supply remained above the balanced 9–12-month range, keeping the area a buyer’s market.
With several new developments scheduled for delivery in 2027—including North Beach’s short-term-rental-friendly Palma Miami Beach Residences and Ella Miami Beach, along with Mid-Beach’s Casa Cipriani Miami and The Perigon—we expect supply to remain elevated through much of 2027.
Buyers can therefore expect to retain negotiating leverage with a wider selection of properties, while sellers will need to price realistically or be prepared to hold through the area’s current growth phase.
Deeper Q3 2026 Analysis by Price Tier
|
|
$1–2M | $2–5M | $10M+ |
| Median Sale Price | $1,324,500 | $2,375,000 | $13,600,000 |
| Median Sale Price YoY | -10.20% | -26.90% | 23.60% |
| Median Price per Square Foot | $861 | $1,220 | $3,587 |
| Closed Sales | 20 | 12 | 3 |
| Closed Sales YoY | -4.80% | 33.30% | 200.00% |
| $ Volume | $27M | $31M | $41M |
| $ Volume YoY | -10.20% | 5.60% | 271.40% |
| % Share | 57.10% | 34.30% | 8.60% |
| $ Share | 27.50% | 31.10% | 41.40% |
| Months of Inventory | 13 | 12 | 7 |
| Days on Market | 65 | 45 | 116 |
— Surfside & Bal Harbour
-
Median sale price down from $4,075,000 to $3,100,000, a 23.9% year-over-year decline.
-
Closed sales up from 29 to 33, a 13.8% year-over-year increase.
-
Months of inventory down from 17 to 13 months, a 23.5% year-over-year decrease.
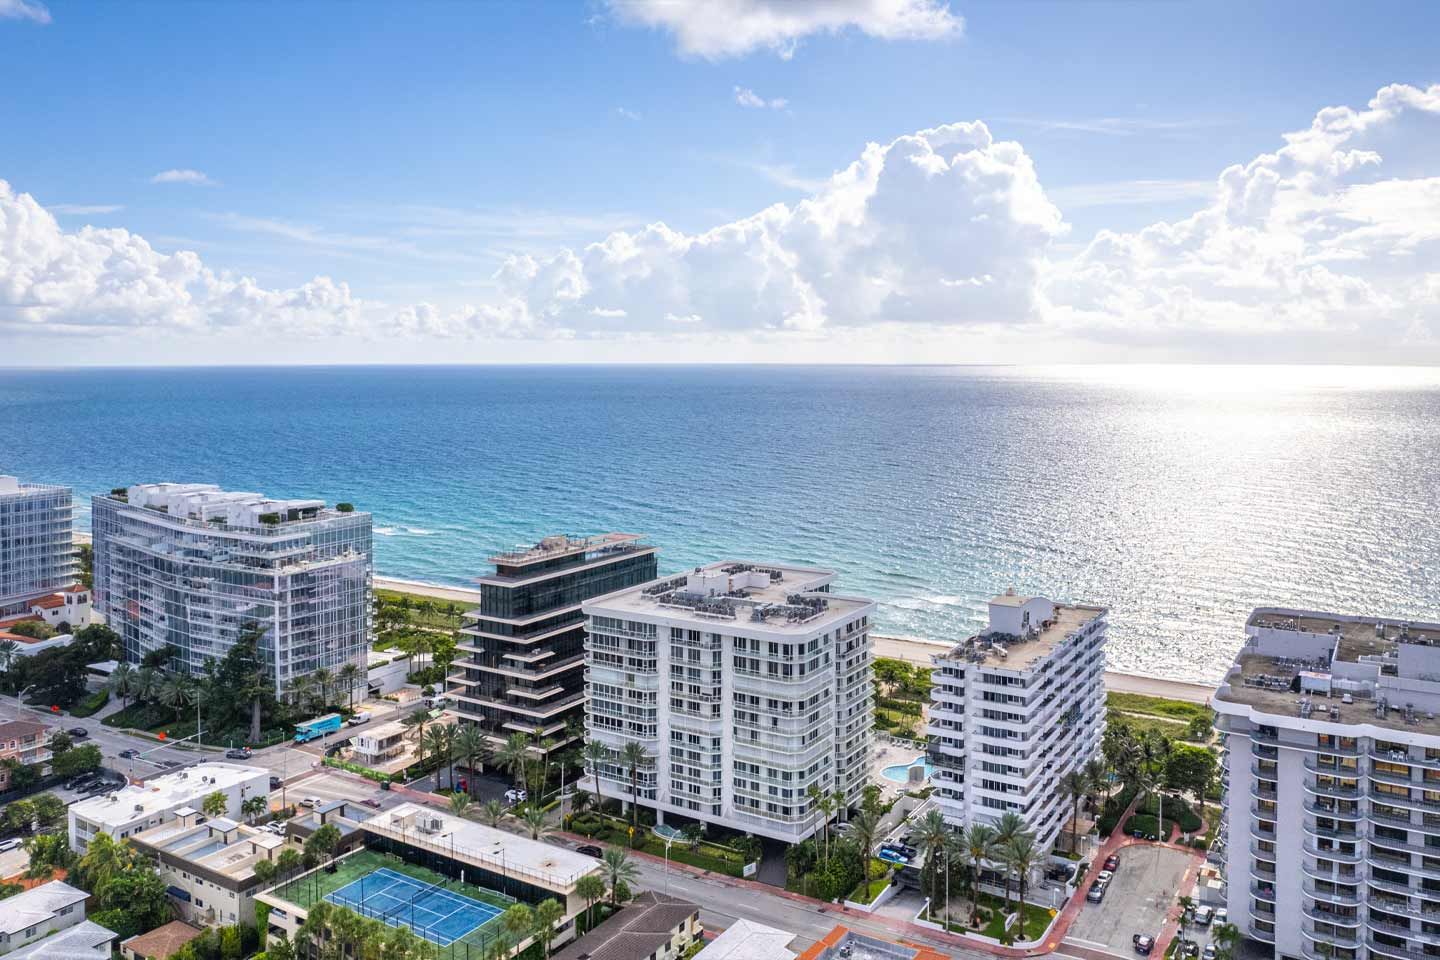
Along with recording the grouping’s second-strongest Q3 sales on record, behind only 2021, Surfside & Bal Harbour continued to build on its reputation as Miami’s trophy-sales destination, with ultra-luxury transactions once again leading the quarter as they did in Q2 2026.
In Q3 2026, this combined market accounted for five of Miami’s seven most expensive condo closings. The top three were led by two residences at The Surf Club Four Seasons, which sold for $30.25 million and $25.6 million, followed by a $22-million closing at Oceana Bal Harbour.
These high-value transactions reinforce the appeal of established waterfront properties in coastal enclaves and helped drive total dollar volume to $208 million, 20% of overall Miami’s dollar volume and the highest among all ten areas we reviewed.
Interestingly, the median sale price fell 23.9% year-over-year, overall Miami’s second-largest decline, while total dollar volume decreased just 2.1%. This suggests a shift in sales mix, particularly the pullback in the $5–10M High Luxury tier, rather than broader price weakness.
Blackbook Recommends
At 13 months of inventory, Surfside & Bal Harbour sat just above the balanced 9–12-month range. Inventory in the Ultra-Luxury tier was the tightest at 10 months, while the $2–5M Luxury segment had nearly two years of supply, offering buyers the greatest advantage.
Looking ahead, new developments such as Rivage Bal Harbour, Surf Row Residences, and Ocean House Surfside will add more options to the area’s luxury residential offerings. Buyers in the $2–5M segment may find more room to negotiate favorable deals, while limited supply in the $10M+ tier could help well-positioned trophy properties continue to register gains.
Sellers should price strategically, taking into account the considerably different supply conditions across price segments.
Deeper Q3 2026 Analysis by Price Tier
| $1–2M | $2–5M | $5–10M | $10M+ | |
| Median Sale Price | $1,450,000 | $3,250,000 | $6,425,000 | $19,873,550 |
| Median Sale Price YoY | 24.20% | 3.50% | -12.70% | 8.30% |
| Median Price per Square Foot | $920 | $1,222 | $2,201 | $5,785 |
| Closed Sales | 11 | 12 | 4 | 6 |
| Closed Sales YoY | 37.50% | 50.00% | -50.00% | 20.00% |
| $ Volume | $15M | $39M | $26M | $127M |
| $ Volume YoY | 47.00% | 50.50% | -56.60% | 10.00% |
| % Share | 33.30% | 36.40% | 12.10% | 18.20% |
| $ Share | 7.20% | 19.00% | 12.60% | 61.20% |
| Months of Inventory | 11 | 20 | 12 | 8 |
| Days on Market | 61 | 87 | 156 | 41 |
— Sunny Isles Beach
-
Median sale price up from $1,900,000 to $2,025,000, a 6.6% year-over-year increase.
-
Closed sales up from 57 to 60, a 5.3% year-over-year increase.
-
Months of inventory down from 21 to 19 months, a 9.5% year-over-year decrease.
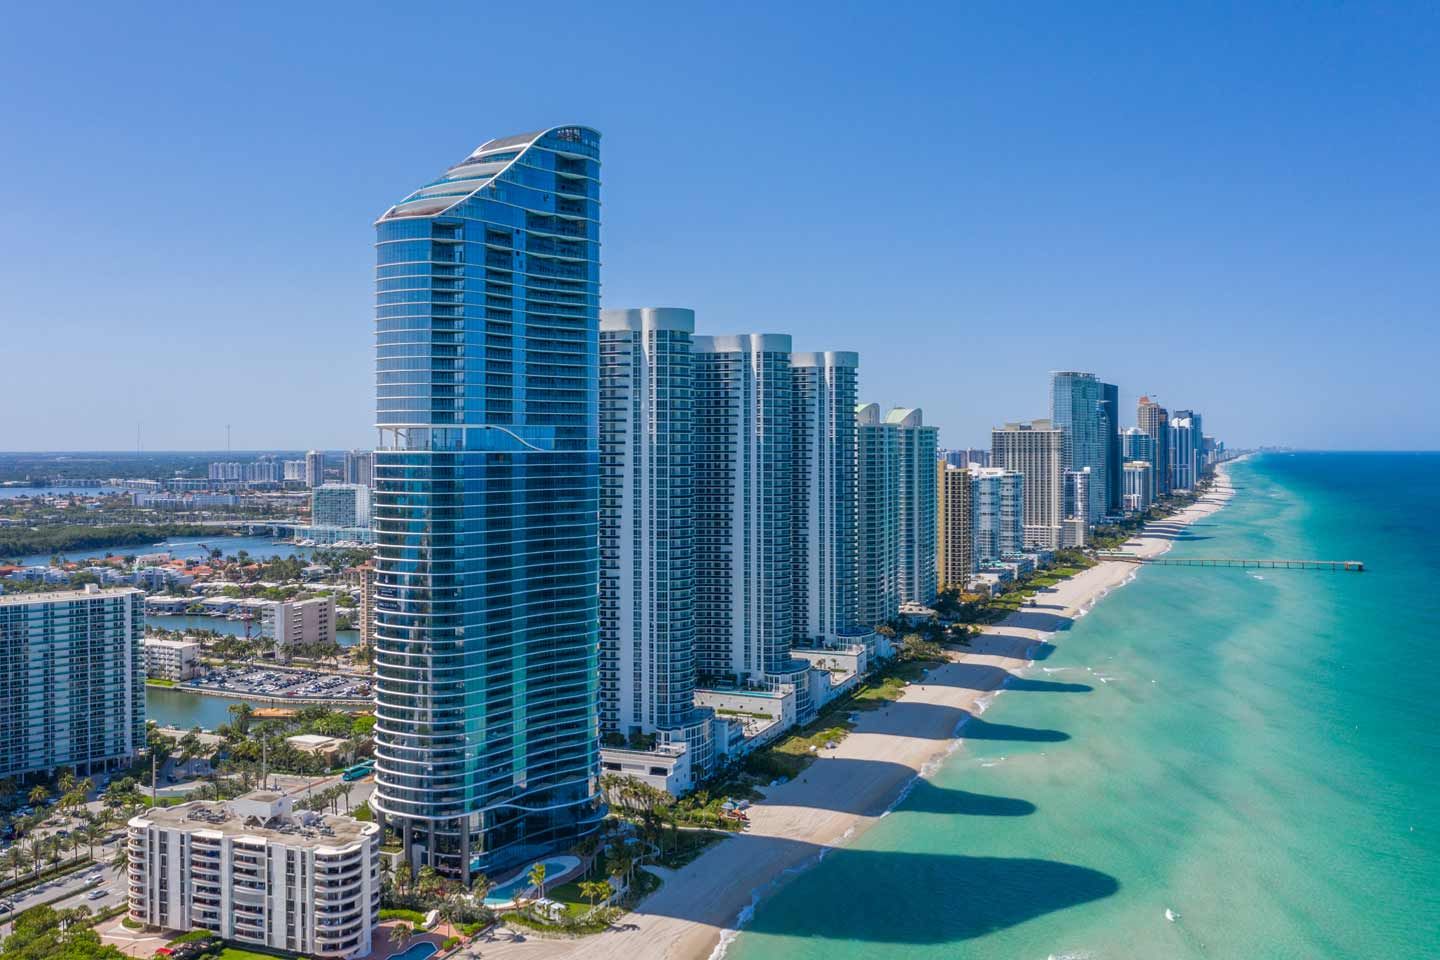
Sunny Isles Beach was Miami’s most active $1M+ condo market in Q3 2026. Despite year-over-year increases in both sales and median sale price, total dollar volume declined 25.7% to $164 million. This reflects a shift in the sales mix, with activity concentrated in the $1–5M range while the $5M+ segment softened.
The $2–5M Luxury tier was the quarter’s standout performer, with sales more than doubling and dollar volume rising 86.2% to $74 million. Meanwhile, the $1–2M Premium segment continued to account for the largest share of transactions, with 29 closings representing 48.3% of sales. In contrast, combined sales in the High Luxury and Ultra-Luxury tiers fell from 15 to 6.
Blackbook Recommends
With 19 months of inventory, Sunny Isles Beach reported the third-highest inventory levels in overall Miami and the highest in Miami Beach, keeping it firmly buyer friendly. Looking ahead, new-construction deliveries over the next two years, including St. Regis Residences Sunny Isles and Bentley Residences, are expected to keep supply levels elevated in this oceanfront neighborhood.
Buyers currently have the greatest advantage in the $5M+ tiers where inventory exceeds 32 months, making them the slowest-clearing price segments across all Miami markets we reviewed.
Meanwhile, sellers in the more active $1–5M range, which accounted for nearly 90% of transactions, will still need competitive pricing and strong property presentation to stand out.
Deeper Q3 2026 Analysis by Price Tier
| $1–2M | $2–5M | $5–10M | $10M+ | |
| Median Sale Price | $1,500,000 | $2,750,000 | $6,850,000 | $11,900,000 |
| Median Sale Price YoY | -3.20% | -29.50% | 11.40% | -9.80% |
| Median Sale Price per Square Foot | $796 | $1,167 | $2,150 | $1,949 |
| Closed Sales | 29 | 25 | 5 | 1 |
| Closed Sales YoY | -6.50% | 127.30% | -44.40% | -83.30% |
| $ Volume | $42M | $74M | $36M | $12M |
| $ Volume YoY | -7.60% | 86.20% | -38.90% | -84.40% |
| % Share | 48.30% | 41.70% | 8.30% | 1.70% |
| $ Share | 25.90% | 45.00% | 21.90% | 7.20% |
| Months of Inventory | 19 | 15 | 33 | 34 |
| Days on Market | 86 | 145 | 260 | 308 |
— Fisher Island
-
Median sale price down from $11,245,250 to $10,400,000, a 7.5% year-over-year decrease.
-
Closed sales down* from 4 to 2, a 50% year-over-year decrease.
-
Months of inventory up from 15 to 18 months, a 20% year-over-year increase.
*Given the low transaction volume, quarterly changes are amplified. Results are interpreted as directional only.
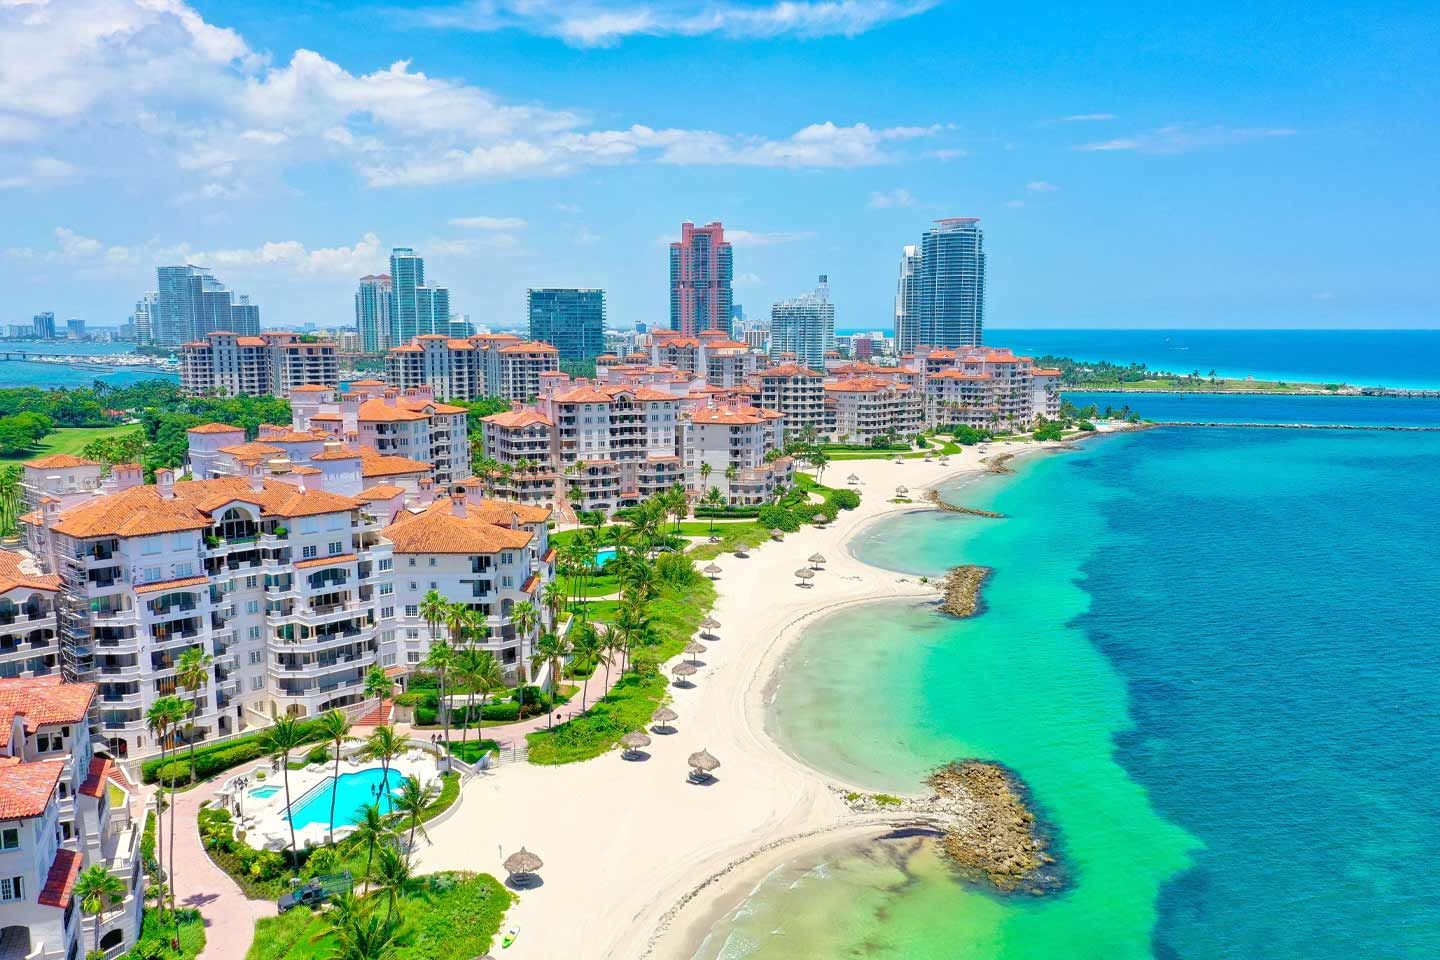
Fisher Island continued to hold its position as overall Miami’s most expensive condo market in Q3 2026, with a median sale price of $10.4 million. Activity, however, remained limited with just two closings compared to four in Q3 2025.
The island’s top sale was a $17-million 4-bedroom, 4.5-bathroom residence spanning 4,231 square feet at Palazzo Della Luna. The bayfront home offered scenic water views, a seamless blend of indoor and outdoor living, and the scale and feel of a single-family home.
Blackbook Recommends
With just two closings in Q3 2026, Fisher Island remains an outlier within Miami's luxury condo market, with its low-density setting and exceptionally high price points naturally constraining transaction activity. Inventory stood at 18 months, although this figure should be interpreted in the context of the island's low sales volume.
Given the small number of transactions in Q3, we will continue monitoring sales and pricing over the next few quarters before drawing conclusions about the direction of this niche market.
Deeper Q3 2026 Analysis by Price Tier
| $2–5M | $10M+ | |
| Median Sale Price | $3,800,000 | $17,000,000 |
| Median Sale Price YoY | N/A | 15.30% |
| Median Sale Price per Square Foot | $1,987 | $4,018 |
| Closed Sales | 1 | 1 |
| Closed Sales YoY | N/A | -50.00% |
| $ Volume | $4M | $17M |
| $ Volume YoY | N/A | -42.40% |
| % Share | 50.00% | 50.00% |
| $ Share | 18.30% | 81.70% |
| Months of Inventory | 16 | 20 |
| Days on Market | 159 | 0 |
— Miami Beach Neighborhood Comparison
| South Beach | Mid- & North Beach | Surfside & Bal Harbour | Sunny Isles Beach | Fisher Island | |
| Median Sale Price | $2,280,000 | $1,700,000 | $3,100,000 | $2,025,000 | $10,400,000 |
| % Change in Median Sale Price | 9.10% | 0.10% | -23.90% | 6.60% | -7.50% |
| Median Price per Square Foot | $1,475 | $989 | $1,199 | $980 | $3,003 |
| Closed Sales | 43 | 35 | 33 | 60 | 2 |
| % Change in Closed Sales YoY | -4.40% | -2.80% | 13.80% | 5.30% | -50.00% |
| Months of Inventory | 9 | 13 | 13 | 19 | 18 |
| Days on Market | 90 | 59 | 76 | 107 | 80 |
| South Beach | Mid- & North Beach | Surfside & Bal Harbour | Sunny Isles Beach | Fisher Island | |
| Median Sale Price | Up | Flat | Down | Up | Down |
| Median Price per Square Foot | Down | Down | Down | Flat | Up |
| Closed Sales | Down | Down | Up | Up | Down |
| Months of Inventory | Down | Down | Down | Down | Up |
| Days on Market | Up | Down | Down | Up | Down |
— Conclusion
As anticipated in our Q2 2026 Miami Beach report, Miami Beach maintained stable footing through Q3. With another seasonally slower quarter underway, we expect year-over-year sales activity across the $1M+ market to remain steady to somewhat softer.
However, several longer-term tailwinds will continue to support Miami Beach. Business and wealth migration remain important drivers of overall growth, and Lincoln Road's multimillion-dollar reinvention will help the area evolve beyond its traditional tourist-oriented appeal. South Beach's expanding office market is also poised to further elevate the area.
The recent passing of Amendment 3, which provides additional property-tax relief for primary homeowners, offers another potential advantage alongside the state's lack of personal-income tax. Read our expert opinion on Florida’s Amendment 3 here.
In terms of prices, best-in-class residences and properties at the upper end of the market should continue to command a premium, even as overall appreciation remains moderate and performance varies widely across different neighborhoods and pricing segments.
Inventory will be a key factor to watch in 2027, particularly as several pre-construction developments move toward delivery across Miami Beach. The resulting increase in available supply could create greater competition among sellers and further differentiate properties based on location, build quality, views, and amenities.
For guidance on buying, selling, or investing in luxury real estate, turn to the best boutique brokerage in Miami. We’ll help make sense of the numbers and identify opportunities tailored to your specific goals and needs. Call, text, or email us to get started.