


With sales consistently higher than in pre-pandemic years and prices affording stable gains, the Greater Downtown Miami market opened 2024 strong, revealing a new normal for the neighborhood's luxury housing market. In this era, even as the market experienced seasonal fluctuations, sales activity remained higher than previous benchmarks, prices appreciated in single digits, and inventory took relatively fewer days on the market to sell.
According to Miami condo analytics for Q1 2024, Downtown Miami remained the strongest market in Greater Downtown, reporting steady year-over-year sales. Edgewater maintained its title as the most expensive market for luxury condos in Greater Downtown, reporting a median Price/sq. ft. of $924. And, Downtown Miami again sealed its status as the fastest-selling neighborhood for luxury condos, with properties taking about two months (65 days) to sell on average, a nod to this core neighborhood's increasing desirability.
Read below for our exclusive, in-depth analysis of how Greater Downtown, including Edgewater, Brickell, and Downtown Miami performed over Q1 2024, along with a detailed comparison to the overall Miami luxury condo market trends in terms of sales, prices, days on market, and inventory.
*For this Greater Downtown Miami luxury condo market report for Q1 2024, we've only included areas with zipcodes 33129, 33130, 33131, 33132, and 33137—Brickell Hammock, Brickell, Brickell Key, Downtown Miami, Arts & Entertainment District, Edgewater, Wynwood, Midtown and the Design District. This luxury condo market report only features properties priced at $1 million and above and does not include pre-construction condo sales.
Number of Sales for Overall Greater Downtown Miami Q1 2024 (YoY)
Median Sales Price for Overall Greater Downtown Miami Q1 2024 (YoY)
Median SP/Sq. Ft. for Overall Greater Downtown Miami Q1 2024 (YoY)
Q1 2024 - Greater Downtown Miami Luxury Condo Market Updates
- Sales were down 15.1% year-over-year but reported a new normal with higher sales than in 2020 and earlier years.
- The 12-month Sales Trendline stayed negative between Q4 2023 and Q1 2024.
- Price per Square Foot is almost flat year-over-year at $881, the second-highest in recent history.
- Median Sales Price was down 10.9% year-over-year to $1.4M.
- Days on Market was up year-over-year to 78 days.
- Inventory was up to 24 months.
- Greater Downtown Miami showed signs of a shift towards a buyer's market while offering equal footing to buyers and sellers.
Q1 2024 - Greater Downtown Neighborhood Highlights
- Winner: Downtown Miami led market growth in Greater Downtown by matching the sales pace from a year ago.
- The 12-month Sales Trendline was negative across the board.
- Winner: Luxury condos in Brickell and Downtown Miami offered maximum value to sellers in Greater Downtown, recording the highest percentage gains (3% each) in year-over-year Price per Square Foot.
- Winner: Edgewater continued to be the most expensive neighborhood in Greater Downtown, priced at $924/sq. ft.
- Winner: Edgewater also reported the highest Median Sales Price in Greater Downtown at $1.5 million.
- Winners: Downtown Miami remained the fastest-selling market of Greater Downtown, with luxury condos taking only 65 days to sell.
- Brickell continued reporting the lowest inventory in the Greater Downtown area at 22 months.
— Table of Contents
- Greater Downtown Miami
- Luxury Condo Sales Trends
- Luxury Condo Price Trends
- Luxury Condo Days on Market Trends
- Luxury Condo Inventory Trends
- Edgewater Neighborhood Trends
- Brickell Neighborhood Trends
- Downtown Neighborhood Trends
- Conclusion
- What's Greater Downtown Miami's Luxury Condo Market Prediction in 2024?
— Greater Downtown Miami
|
Q1 2024 Greater Downtown Miami Luxury Condo Market Summary - Fig. 1 |
|||||||
|
Quarters |
Number of Sales |
% change in Sales |
Median Sale Price |
% change in Median Sale Price |
Median Sp/Sqft |
% change in Median Sp/Sqft |
Median of DOM |
|
Q1 2024 |
90 |
7.1% |
$1,412,500 |
9.5% |
$881 |
0.8% |
78 |
|
Q4 2023 |
84 |
$1,290,000 |
$874 |
71 |
|||
|
Q1 2024 Greater Downtown Miami Luxury Condo Market Summary - Fig. 1.1 |
|||||||
|
Quarters |
Number of Sales |
% change in Sales |
Median Sale Price |
% change in Median Sale Price |
Median Sp/Sqft |
% change in Median Sp/Sqft |
Median of DOM |
|
Q1 2024 |
90 |
-15.1% |
$1,412,500 |
-10.9% |
$881 |
-1.1% |
78 |
|
Q1 2023 |
106 |
$1,585,500 |
$891 |
61 |
|||
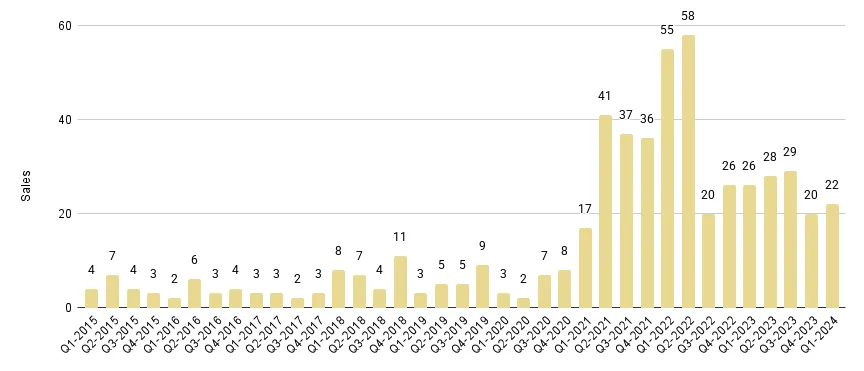
Greater Downtown Miami Sales Trends
Greater Downtown Miami echoed the overall Miami market trend of an increase in quarter-over-quarter sales, reflected historical patterns of momentum picking up after a slower winter, and had lower year-over-year volume.
Key Q1 2024 Sales Statistics for Greater Downtown Miami:
- Q1 2024 vs Q4 2023. Sales increased 7.1% quarter-over-quarter, up from 84 in the previous quarter to 90 in Q1 2024. (Fig. 1)
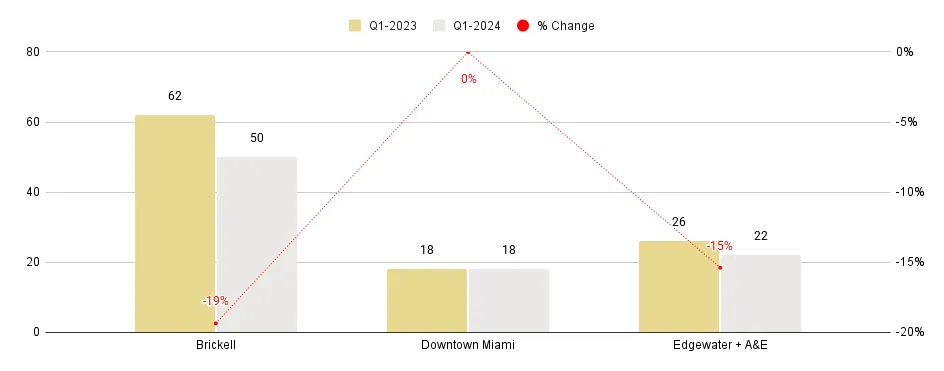
- Q1 2024 vs Q1 2023. Sales declined 15.1% year-over-year, down from 106 in Q1 last year to 90 sales in the same quarter this year. (Fig.1.1)
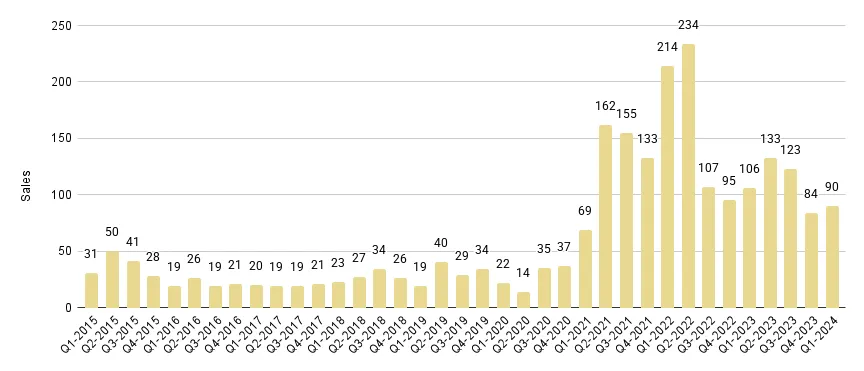
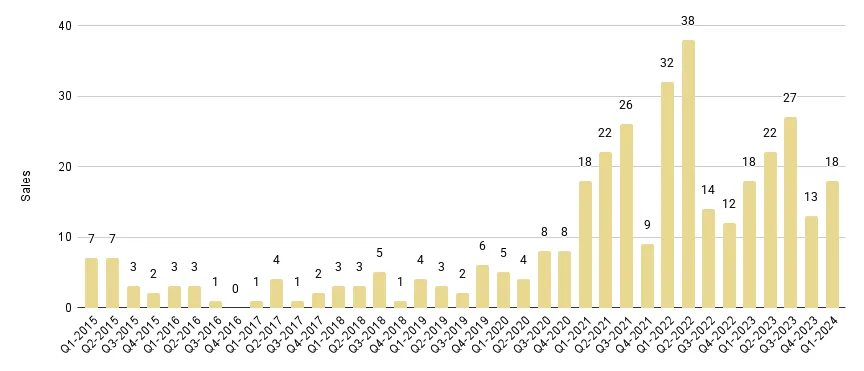
- What's worth noting is that Q1 2024 volumes outpaced those recorded in Q1 2021 and earlier, confirming a paradigm shift in sales parameters compared to a more modest pre-pandemic market, where quarterly volumes typically ranged between 10 and 70. This demonstrates a permanent improvement in this market's value and desirability. (Fig. 2.1)
- Brickell continued as the highest contributor in terms of volume, reporting 50 sales in Q1 2024. On the other hand, Downtown Miami stood out as the strongest market in Greater Downtown, reporting steady year-over-year sales, whereas other neighborhoods in this study report a decline from year-ago numbers.
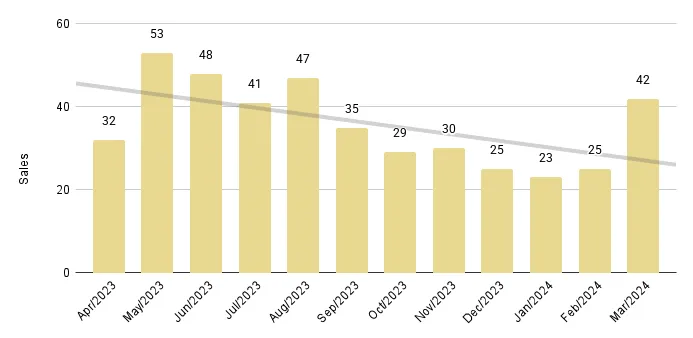
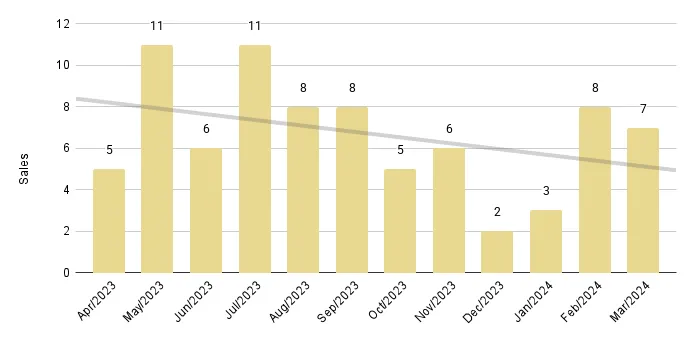
Looking into the monthly Sales trends of Fig. 2.2 for Greater Downtown Miami:
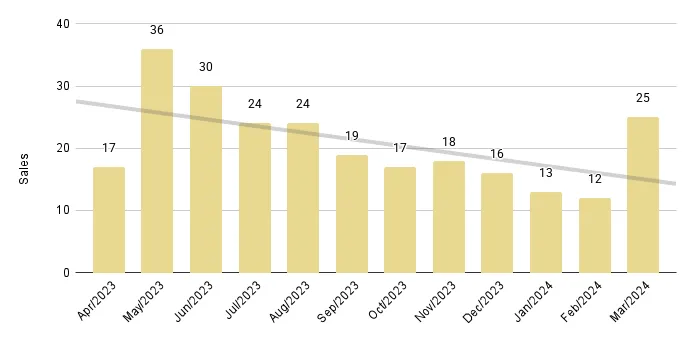
- January 2024 closed with 23 sales, higher than the 20 sales noted in the same month last year.
- February closed with 25 luxury condo sales versus 32 in the comparable month of 2023.
- March closed with 42 sales, lower than the 54 sales noted for the same period in 2023.
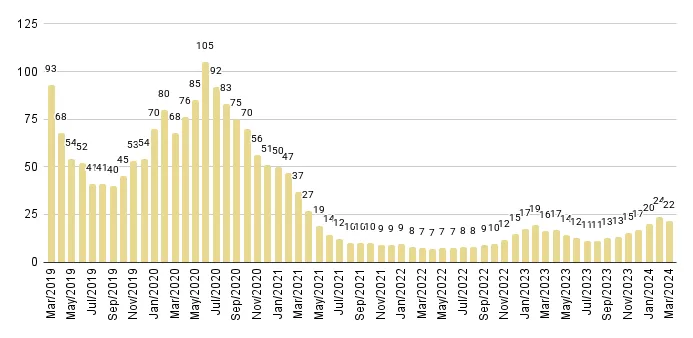
The 12-month Sales Trendline of Fig. 2.3 maintained a negative trajectory between Q4 2023 and Q1 2024, suggesting a slower pace for the upcoming quarter. However, as Miami luxury housing experts, we recommend interpreting this as an indication of a softer peak season (typically Q2) this year, given the current pace of sales.
Greater Downtown Miami Luxury Condo Quarterly Sales 2015 - 2024 - Fig. 2.1
Greater Downtown Miami Luxury Condo Monthly Sales from Jan. 2016 to Mar. 2024 - Fig. 2.2
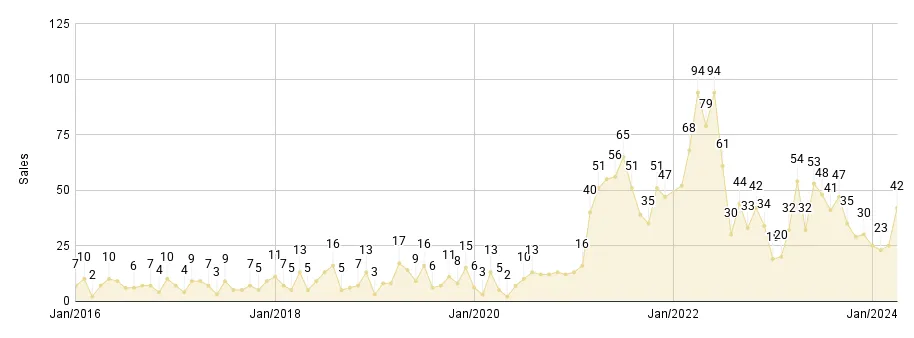
Greater Downtown Miami Luxury Condo 12-Month Sales with Trendline - Fig. 2.3
Greater Downtown Miami Price Trends
Deviating from the overall Miami market trend of a higher year-over-year Price per Square Foot and Median Price, this mainland grouping reported the following Price Stats for Q1 2024:
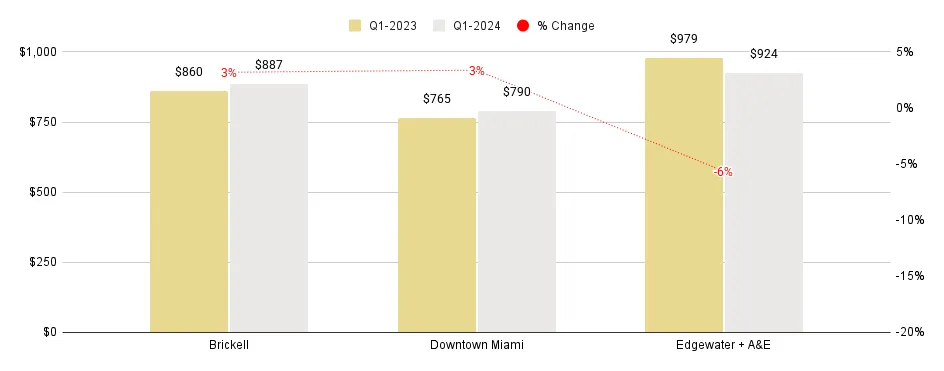
- Q1 2024 vs Q1 2023. Price per Square Foot stayed mostly flat year-over-year, adjusting only by -1.1%, slightly down from $891 in Q1 last year to $881 for the same quarter of 2024. (Fig. 1.1)
- Q1 2024 vs Q4 2023. Price per Square Foot stayed mostly flat quarter-over-quarter as well, adjusting only 0.8%, marginally up from $874 in the previous quarter to $881 in Q1 2024. (Fig. 1)
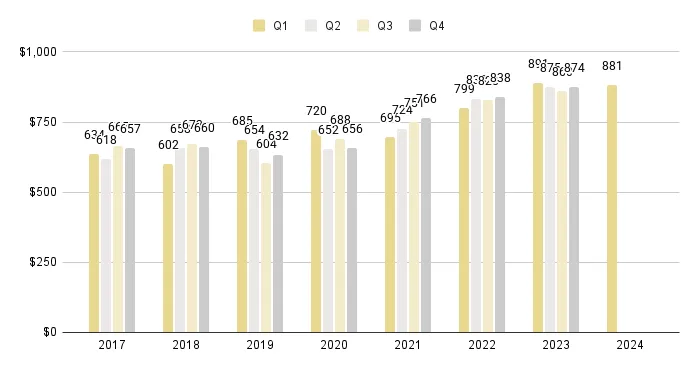
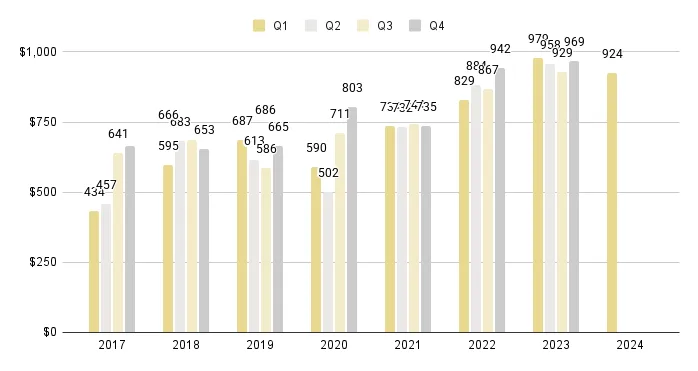
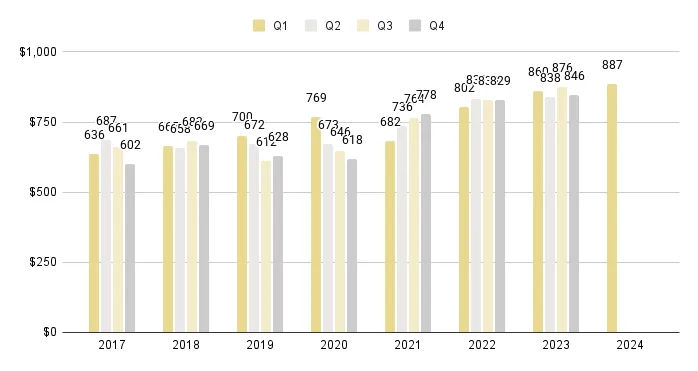
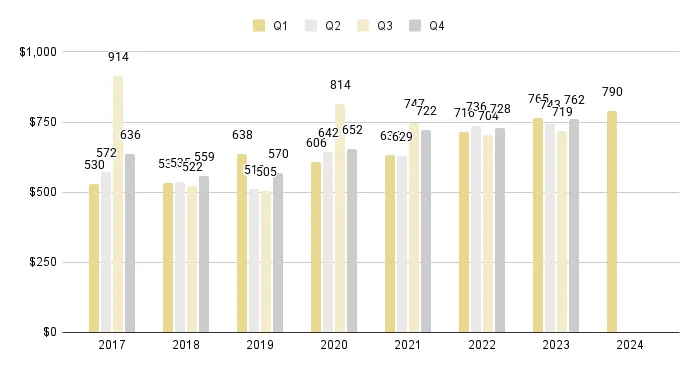
- A closer look at the five-year snapshot of quarterly luxury condo prices below (Fig. 3) shows that the Price per Square Foot closed at its second-highest value in recent history, just shy of the peak of $891/sq. ft. recorded in Q1 2023, indicating that luxury condo investments in Miami's urban core continued providing gains to sellers.
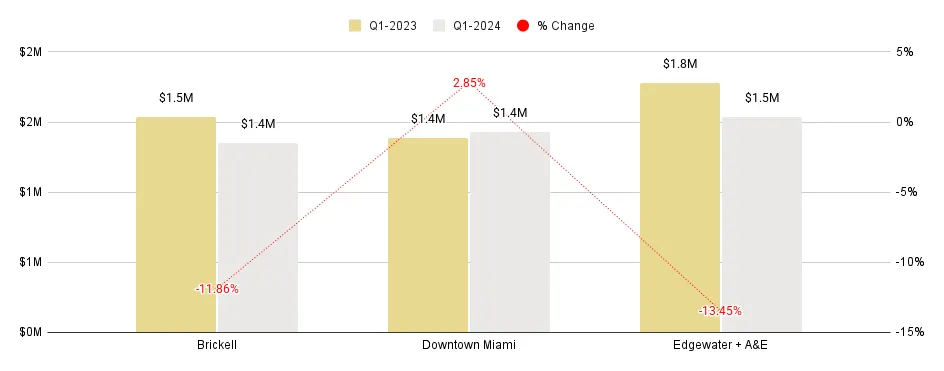
- Q1 2024 vs Q1 2023. Median Sales Price decreased 10.9%, down from $1,585,500 in Q1 last year to $1,412,500 for the comparable quarter this year. (Fig. 1.1)
Greater Downtown Miami Luxury Condo Quarterly Price per Sq. Ft. 2017-2024 - Fig. 3
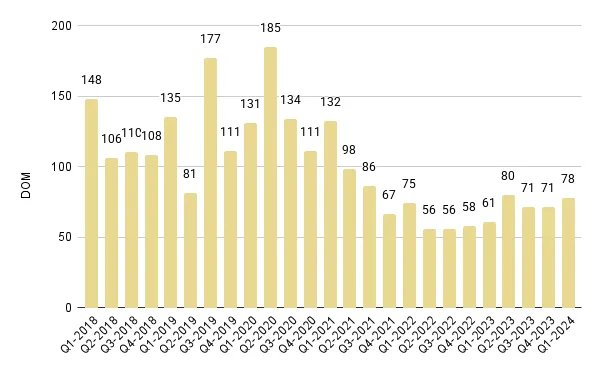
Greater Downtown Miami Days on Market
Days on Market were up 27.9% year-over-year. Following the overall Miami market trend of an increase in quarter-over-quarter and year-over-year values, Greater Downtown Miami reported the following Days on Market (DOM) statistics:
- Q1 2024 vs Q4 2023. Luxury condos spent 7 more days on the market compared to Q4 2023, posting a 9.9% increase in quarter-over-quarter DOM. (Fig. 1)
- Q1 2024 vs Q1 2023. Luxury condos spent 17 more days on the market compared to Q1 last year, reporting a 27.9% increase in year-over-year stats. (Fig. 1.1)
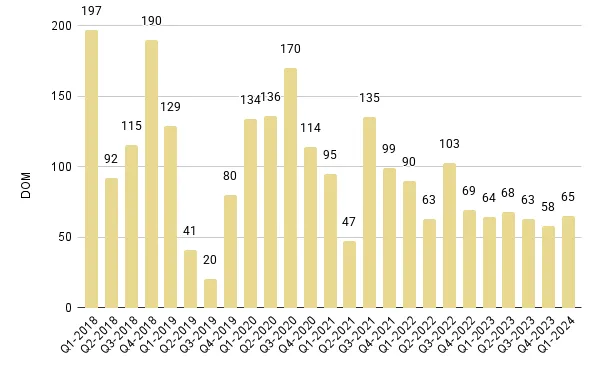
- At 78 days, the Miami condo report statistic shows healthy buyer-seller communication compared to pandemic and pre-pandemic levels, where listings would easily spend 100+ days on the market.
Greater Downtown Miami Quarterly Days on Market 2018 - 2024 – Fig. 4
As a top seller's brokerage and agent in Edgewater, we can provide a free evaluation of your luxury condo and position it to attract the best offers. You can call, chat, or e-mail us, and an Edgewater expert real estate agent will help you.
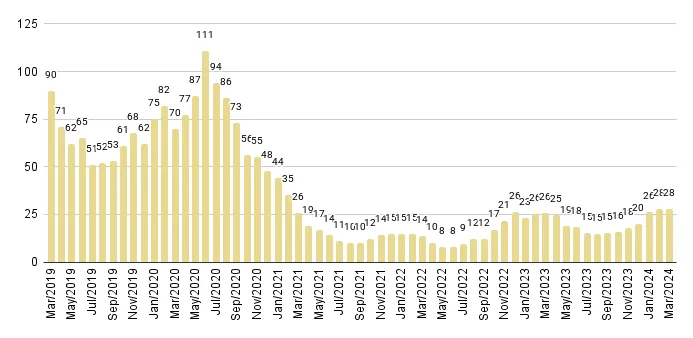
Greater Downtown Miami Inventory
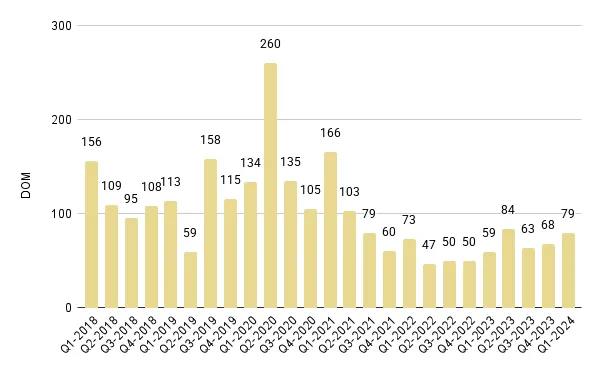
Q1 2024 closed with 24 months of inventory. As predicted, inventory increased at the beginning of 2024 as sellers listed in anticipation of March kicking off the high season. Reading into historical patterns, Miami's luxury housing market is known to be cyclical, experiencing high and low sales seasons.
Reflecting the overall Miami trend of an increase in year-over-year as well as quarter-over-quarter inventory, our in-depth Greater Downtown Miami luxury condo market report shows the following stats for Q1 2024:
- On a quarter-over-quarter basis, inventory increased from 19 months in December 2023 to 24 months in March this year, recording a 26.1% increase. (Fig. 5)
- On a year-over-year basis, inventory was up from 17 months in March 2023 to 24 months in March this year, reporting a 41.2% increase.
Considering luxury condo inventory closed above the 9-12-month range of an ideal market, this would generally indicate a buyer-friendly market. However, given that inventory generally increases ahead of peak season (typically Q2 in Miami) as more sellers enter the market and by our day-to-day interactions with buyers, we recommend reading this as a rather balanced market that offers a leveled playing field for both sides.
That said, as luxury housing experts with more than 15 years in the Miami market, we anticipate inventory levels will stay above the ideal range throughout 2024, giving buyers a little relaxation with more choices within their expected price range.
Buyers looking to live closer to the bay in Edgewater or work in Brickell can use our exclusive search engine to look for available condos for sale in Greater Downtown Miami.
Months of Inventory in Greater Downtown Miami from Mar. 2019 to Mar. 2024 - Fig. 5
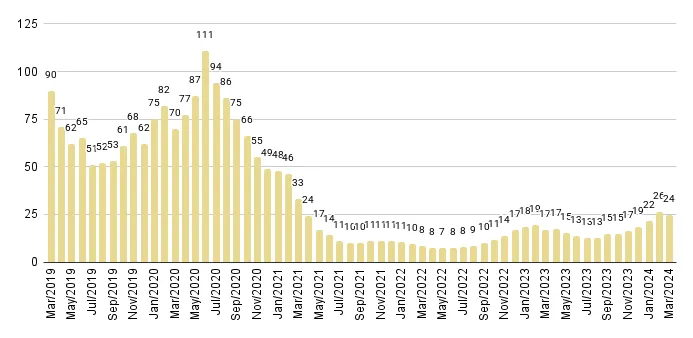
A balanced market has only 9-12 months of inventory. The months of inventory are calculated as – no. of active listings + no. of pending listings divided by the average number of deals in the last six months.
— Edgewater Market Trends
|
Q1 2024 Edgewater Luxury Condo Market Summary – Fig. 6 |
|||||||
|
Quarters |
Number of Sales |
% change in Sales |
Median Sale Price |
% change in Median Sale Price |
Median Sp/Sqft |
% change in Median Sp/Sqft |
Median of DOM |
|
Q1 2024 |
22 |
10.0% |
$1,537,500 |
-16.8% |
$924 |
-4.6% |
87 |
|
Q4 2023 |
20 |
$1,847,500 |
$969 |
85 |
|||
|
Q1 2024 Edgewater Luxury Condo Market Summary – Fig. 6.1 |
|||||||
|
Quarters |
Number of Sales |
% change in Sales |
Median Sale Price |
% change in Median Sale Price |
Median Sp/Sqft |
% change in Median Sp/Sqft |
Median of DOM |
|
Q1 2024 |
22 |
-15.4% |
$1,537,500 |
-13.4% |
$924 |
-5.6% |
87 |
|
Q1 2023 |
26 |
$1,776,380 |
$979 |
61 |
|||
Consistent with the overall Miami pattern of higher quarter-over-quarter sales and lower year-over-year volume this first quarter, Edgewater reported similar Miami real estate market trends with the following key sales statistics:
- Q1 2024 vs Q4 2023. Sales increased 10% quarter-over-quarter, up from 20 in the previous quarter to 22 sales in Q1 2024. (Fig. 6)
- Q1 2024 vs Q1 2023. Sales declined 15.4% year-over-year, down from 26 in Q1 last year to 22 sales in Q1 this year. (Fig. 6.1)
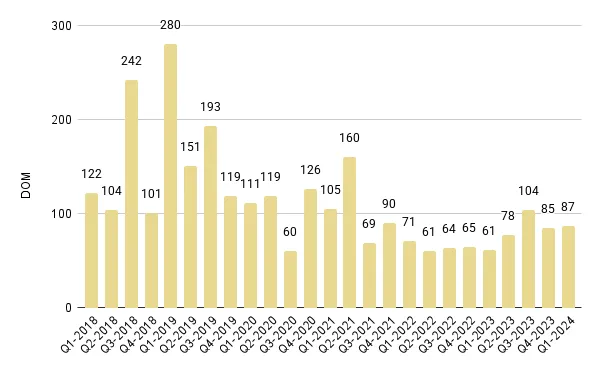
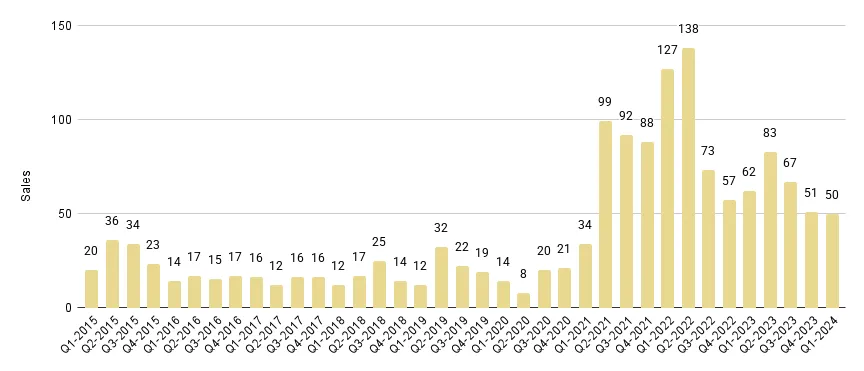
- What's worth noting is that sales exceeded Q1 2021 levels and all previous quarters, indicating a significant improvement post-pandemic and the emergence of a new normal for the luxury condo market in this bayfront neighborhood. (Fig. 7.1)
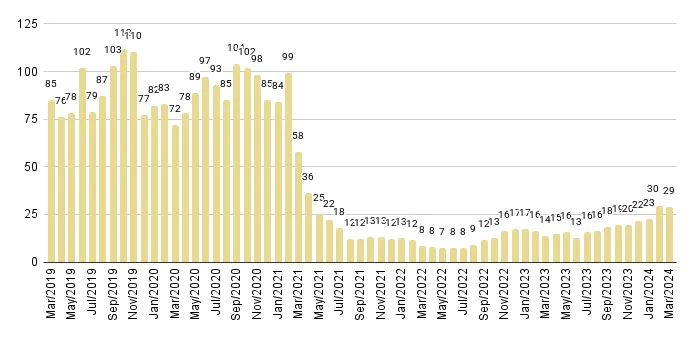
The 12-month Sales Trendline of Fig. 7.2 retained its negative curve from Q3 2023 to Q1 2024, owing to the market slowly shaking off its holiday mood.
Edgewater Luxury Condo Quarterly Sales 2015 - 2024 - Fig. 7.1
Edgewater Luxury Condo 12-Month Sales with Trendline - Fig. 7.2
Edgewater Price Trends
In contrast to the overall Miami condo market trend of a higher year-over-year Price per Square Foot and Median Price, luxury condos in Edgewater reported the following Price Stats for Q1 2024:
- Q1 2024 vs Q4 2023. Price per Square Foot declined 4.6%, down from $969 in the previous quarter to $924 in Q1 2024. (Fig. 6)
- Q1 2024 vs Q1 2023. Price per Square Foot decreased 5.6%, down from $979 in Q1 last year to $924 for the comparable quarter of 2024. (Fig. 6.1)
- A closer look at the five-year snapshot of quarterly luxury condo prices below (Fig. 8), shows that the Price per Square Foot again closed in the higher ranges for Q1 2024, revealing sellers continued receiving incredible value for their luxury condo investments in this premium bayfront neighborhood.
- With Price per Square Foot at $924 and Median Sales Price at $1,537,500, Edgewater was still the most expensive neighborhood in the Greater Downtown area.
- Q1 2024 vs Q1 2023. Median Sales Price declined 13.4%, down from $1,776,380 in Q1 last year to $1,537,500 for the same quarter this year. (Fig. 6.1)
Edgewater Luxury Condo Quarterly Price per Sq. Ft. 2017-2024 - Fig. 8
Edgewater Days on Market Trends
Days on Market were up 42% year-over-year. In line with the overall Miami market trend of an increase in quarter-over-quarter and year-over-year numbers, Edgewater reported the following Days on Market (DOM) statistics:
- Q1 2024 vs Q1 2023. Luxury condos spent 26 more days on the market compared to Q1 of the previous year, reporting a 42% increase in year-over-year stats. (Fig. 9)
- Q1 2024 vs Q4 2023. Luxury condos spent two more days on the market than in Q4 2023, recording a 2.4% increase in quarter-over-quarter DOM.
- At 87 days, luxury condos sold at a relatively healthy pace in this bayfront neighborhood, indicating positive buyer-seller communication.
Edgewater Quarterly Days on Market 2018-2024 – Fig. 9
Edgewater Inventory Trends
Q1 2024 closed with 29 months of inventory. Following the overall Miami real estate trend of an increase in year-over-year as well as quarter-over-quarter inventory, luxury condos in Miami's Edgewater reported the following stats for Q1 2024:
- On a quarter-over-quarter basis, inventory was up from 22 months in December 2023 to 29 months in March this year, recording a 31.8% increase. (Fig. 10)
- On a year-over-year basis, inventory increased from 14 months in March 2023 to 29 months in March this year, reporting a 107% uptick.
- At 29 months, Edgewater had the highest inventory of all the Miami neighborhoods in our quarterly review. In an otherwise balanced market, this bayfront market offered buyers the added advantage of having more options available within their desired price range.
Edgewater Luxury Condo Months of Inventory from Mar. 2019 to Mar. 2024 - Fig. 10
A balanced market has only 9-12 months of inventory. The months of inventory are calculated as – no. of active listings + no. of pending listings divided by the average number of deals in the last six months.
— Brickell Market Trends
|
Q1 2024 Brickell Luxury Condo Market Summary - Fig. 11 |
|||||||
|
Quarters |
Number of Sales |
% change in Sales |
Median Sale Price |
% change in Median Sale Price |
Median Sp/Sqft |
% change in Median Sp/Sqft |
Median of DOM |
|
Q1 2024 |
50 |
-2.0% |
$1,352,500 |
9.1% |
$887 |
4.9% |
79 |
|
Q4 2023 |
51 |
$1,240,000 |
$846 |
68 |
|||
|
Q1 2024 Brickell Luxury Condo Market Summary - Fig. 11.1 |
|||||||
|
Quarters |
Number of Sales |
% change in Sales |
Median Sale Price |
% change in Median Sale Price |
Median Sp/Sqft |
% change in Median Sp/Sqft |
Median of DOM |
|
Q1 2024 |
50 |
-19.4% |
$1,352,500 |
-11.9% |
$887 |
3.2% |
79 |
|
Q1 2023 |
62 |
$1,534,500 |
$860 |
59 |
|||
Brickell Sales Trends
Partly deviating from the overall Miami trend of higher quarter-over-quarter volume and lower year-over-year numbers, Brickell luxury condo report delivered the following key sales statistics:
- Q1 2024 vs Q4 2023. Sales stayed mostly flat, adjusting only -2% quarter-over-quarter, marginally down from 51 in the previous quarter to 50 sales in Q1 2024. (Fig. 11)
- Q1 2024 vs Q1 2023. Sales declined 19.4% year-over-year, down from 62 in Q1 last year to 50 sales for the same quarter in 2024. (Fig. 11.1)
- What's worth noting is that despite this decrease, Brickell continued reporting the highest sales volume of all the Greater Downtown Miami neighborhoods under review. First-quarter sales also surpassed levels from Q1 2021 and previous years, demonstrating the establishment of a new normal sales benchmark in Miami's financial hub. (Fig. 12.1)
The 12-month Sales Trendline of Fig. 12.2 maintained a negative trajectory from Q4 2023 to Q1 2024, in line with the overall Miami market.
Brickell Luxury Condo Quarterly Sales 2015 - 2024 - Fig. 12.1
Brickell Luxury Condo 12-Month Sales with Trendline - Fig. 12.2
Brickell Price Trends
Partly consistent with the overall Miami real estate market trends of a higher year-over-year Price per Square Foot and Median Price, luxury condos in Brickell reported the following Price Stats for Q1 2024:
- Q1 2024 vs Q4 2023. Price per Square Foot reported an uptick of 4.9%, up from $846 in the previous quarter to $887 in Q1 2024. (Fig. 11)
- Q1 2024 vs Q1 2023. Price per Square Foot increased 3.2%, up from $860 in Q1 2023 to $887 for the same quarter in 2024. (Fig. 11.1)
- With the Price per Square Foot recording a new all-time high of $887/sq. ft. (Fig. 13), most sellers in Brickell received the best value to date for their luxury condo investments this first quarter.
- Brickell tied with Downtown Miami to report the highest percentage growth (3%) in year-over-year price per sq. ft.
- Q1 2024 vs Q1 2023. Median Sales Price declined 11.9%, down from $1,534,500 in Q1 last year to $1,352,500 for the comparable quarter this year. (Fig. 11)
Brickell Luxury Condo Quarterly Price per Sq. Ft. 2017-2024 - Fig. 13
Brickell Days on Market Trends
Days on Market were up 34% year-over-year. Consistent with the overall Miami market trend of an increase in quarter-over-quarter and year-over-year values, Brickell reported the following Days on Market (DOM) statistics:
- Q1 2024 vs Q1 2023. Luxury condos spent 20 more days on the market compared to Q1 last year, reporting a 34% increase in year-over-year stats. (Fig. 14)
- Q1 2024 vs Q4 2023. Luxury condos spent 11 more days on the market than in Q4 2023, recording a 16.2% increase in quarter-over-quarter DOM.
- At 79 days, luxury properties sold at a softer pace than a year ago, suggesting that buyers and sellers took a while to reach a consensus in this financial district.
Brickell Luxury Condo Quarterly Median Days on Market 2018 – 2024 - Fig. 14
Brickell Inventory Trends
Q1 2024 closed with 22 months of inventory. Echoing the overall Miami trend of an increase in year-over-year as well as quarter-over-quarter inventory, Brickell luxury condo market report shows the following stats for Q1 2024:
- On a quarter-over-quarter basis, inventory was up from 17 months in December 2023 to 22 months in March this year, recording a 29.4% increase. (Fig. 15)
- On a year-over-year basis, inventory increased from 16 months in March 2023 to 22 months in March this year, reporting a 37.5% uptick.
- At 22 months, inventory closed above the 9-12-month range of an ideal market, hinting at a transition into a buyer's market. However, a look at the overall Miami trends and broader market perspective reveals that the market stands in equilibrium for buyers and sellers, providing equal value and opportunity for both in this business district.
- Further, Brickell continued reporting the lowest levels of inventory in Greater Downtown Miami.
Brickell Luxury Condo Months of Inventory from Mar. 2019 to Mar. 2024 - Fig. 15
A balanced market has only 9-12 months of inventory. The months of inventory are calculated as – no. of active listings + no. of pending listings divided by the average number of deals in the last six months.
— Downtown Miami Market Trends
|
Q1 2024 Downtown Miami Luxury Condo Market Summary - Fig. 15 |
|||||||
|
Quarters |
Number of Sales |
% change in Sales |
Median Sale Price |
% change in Median Sale Price |
Median Sp/Sqft |
% change in Median Sp/Sqft |
Median of DOM |
|
Q1 2024 |
18 |
38.5% |
$1,426,995 |
-9.4% |
$790 |
3.7% |
65 |
|
Q4 2023 |
13 |
$1,575,000 |
$762 |
58 |
|||
|
Q1 2024 Downtown Miami Luxury Condo Market Summary - Fig. 15.1 |
|||||||
|
Quarters |
Number of Sales |
% change in Sales |
Median Sale Price |
% change in Median Sale Price |
Median Sp/Sqft |
% change in Median Sp/Sqft |
Median of DOM |
|
Q1 2024 |
18 |
0.0% |
$1,426,995 |
2.8% |
$790 |
3.4% |
65 |
|
Q1 2023 |
18 |
$1,387,500 |
$765 |
64 |
|||
Downtown Miami Sales Trends
Partly consistent with the overall Miami trend of higher quarter-over-quarter sales and lower year-over-year volumes, our exclusive Downtown Miami luxury condo market report delivered the following key sales statistics:
- Q1 2024 vs Q4 2023. Sales jumped 38.5% quarter-over-quarter, up from 13 in the previous quarter to 18 sales in Q1 2024. (Fig. 15)
- Q1 2024 vs Q1 2023. Sales remained flat year-over-year, reporting no change from the 18 sales recorded in Q1 last year. (Fig. 15.1)
- What's worth noting is that Downtown Miami was the most resilient neighborhood in the Greater Downtown area this first quarter. The urban neighborhood also reported higher quarterly volumes than those noted in 2020 or any other previous year, indicating a shift to a new normal with updated sales parameters this first quarter. (Fig. 16.1)
The 12-month Sales Trendline of Fig. 17.2 retained its negative curve from Q4 2023 to Q1 2024, owing to the market still building momentum ahead of peak season in Q2.
Downtown Miami Luxury Condo Quarterly Sales 2015 - 2024 - Fig. 16.1
Downtown Miami Luxury Condo 12-Month Sales with Trendline - Fig. 16.2
Downtown Miami Price Trends
Echoing the overall Miami market trend of a higher year-over-year Price per Square Foot and Median Price, luxury condos in Downtown Miami reported the following Price Stats for Q1 2024:
- Q1 2024 vs Q4 2023. Price per Square Foot increased by 3.7%, up from $762 in the previous quarter to $790 in Q1 2024. (Fig. 15)
- Q1 2024 vs Q1 2023. Price per Square Foot increased by 3.4%, up from $765 in Q1 last year to $790 for the same quarter in 2024. (Fig. 15.1)
- Continuing to offer buyers the most affordable entry point into Miami's luxury condo market, Downtown closed the quarter at $790/sq. ft.
- A closer look at the five-year snapshot of quarterly luxury condo prices below (Fig. 17), shows that Downtown prices closed in the higher ranges, affording sellers good value for their luxury properties.
- Downtown Miami further shared the top spot with Brickell to report the highest percentage growth (3%) in year-over-year price per sq. ft. this first quarter.
- Q1 2024 vs Q1 2023. Median Sales Price increased 2.8%, up from $1,387,500 in Q1 of the previous year to $1,426,995 for the same quarter this year. (Fig. 15.1)
Downtown Miami Luxury Condo Quarterly Price per Sq. Ft. 2017-2024 - Fig. 17
Downtown Miami Days on Market Trends
Days on Market were flat year-over-year. Partly consistent with the overall Miami condo market trend of an increase in quarter-over-quarter and year-over-year numbers, Downtown Miami reported the following Days on Market (DOM) statistics:
- Q1 2024 vs Q1 2023. Luxury condos spent almost the same number of days on the market compared to a year ago, reporting a negligible adjustment of 1.6% in year-over-year stats. (Fig. 18)
- Q1 2024 vs Q4 2023. Luxury condos spent seven more days on the market than in Q4 2023, recording a 12% increase in quarter-over-quarter DOM.
- Taking only 65 days to market, Downtown Miami continued to be the fastest-selling market of Greater Downtown Miami in Q1 2024, indicating healthy buyer-seller communication with swift closings.
Downtown Miami Luxury Condo Quarterly Median Days on Market 2018 – 2024 - Fig. 18
Downtown Miami Inventory Trends
Q1 2024 closed with 28 months of inventory. In line with the overall market trend of an increase in year-over-year as well as quarter-over-quarter inventory, luxury condos in Downtown Miami reported the following stats for Q1 2024:
- On a quarter-over-quarter basis, inventory increased from 20 months in December 2023 to 28 months in March this year, reporting a 40% increase. (Fig. 19)
- On a year-over-year basis, inventory increased from 26 months in March 2023 to 28 months in March this year, reporting a 7.7% increase.
- At 28 months, inventory closed above the 9-12-month range of a balanced market, revealing that buyers hold the advantage of having more choices in an otherwise balanced market.
Downtown Miami Luxury Condo Months of Inventory from Mar. 2019 to Mar. 2024 - Fig. 19
A balanced market has only 9-12 months of inventory. The months of inventory are calculated as – no. of active listings + no. of pending listings divided by the average number of deals in the last six months.
— Conclusion
As is evident from the quarterly numbers above, the luxury condo market in Greater Downtown Miami has expanded to report revised benchmarks with higher sales and price parameters than in 2020 and before. In our luxury condo reports for Q1 2024, even as sales were lower than a year ago, quarter-over-quarter numbers reported an expected uptick – indicating that this healthy market was operating in tandem with historical patterns in its new normal.
With a negative 12-month Sales Trendline noted across the board, as Miami real estate experts, we expect the next quarter to unfold on a softer note, even though we will be in the thick of the high season.
Downtown Miami continued to be the most popular neighborhood in the Greater Downtown area with stable year-over-year sales, while other neighborhoods in this analysis reported a decline.
In our price watch for Q1 2024, Greater Downtown Miami reported the second-highest Price per Square Foot at $881, indicating great value for luxury condo owners in this urban core. On a closer look, Brickell and Downtown Miami properties afforded sellers the highest percentage gains in year-over-year price per square foot. Edgewater remained the undisputed winner of the title for the most expensive neighborhood in Greater Downtown, reporting the highest median price at $1.5 million and highest price per square foot at $924.
In line with the overall market trend, the Days on Market increased year-over-year for luxury condos across Greater Downtown. Downtown Miami remained the fastest-selling market in Greater Downtown Miami with the lowest days on the market, as luxury properties spent only about two months (65 days) on the market from listing to closing.
With inventory up across the board, typically above the 9-12-month range of an ideal market, this urban core showed signs of a shift towards a buyer's market.
However, when paired with anecdotal evidence, we noted that the luxury condo market in Greater Downtown still offered buyers and sellers equal footing in terms of negotiations and value this first quarter.
— What's Greater Downtown Miami's Luxury Condo Market Prediction in 2024?
With a higher-paced second quarter ahead of us, and judging from our regular Miami condo market reports, we expect the following to influence luxury condo market trends:
- We expect a broader demographic, consisting of international expats moving to Miami and domestic buyers typically demanding larger residences (minimum of three bedrooms), well-compensated millennial remote workers looking to move closer to art and entertainment in Miami, and top-performing tech workers buying all-cash to continue driving luxury condo sales throughout the year.
- We expect that with FIFA 2026 headquarters and an elite class of business leaders like Jeff Bezos moving to Miami to keep us in the spotlight for those seeking a sophisticated business environment supported by a burgeoning economy.
- We expect to attract more high-net-worth investors to our growing landscape of short-term-rental-friendly luxury condos, as Knight Frank's latest wealth report predicts prime Miami real estate to offer a 4% increase in prices in 2024.
- In contrast, we anticipate sticky mortgage rates and the initial impact of association fee hikes due to our latest State regulations and rising insurance costs to dampen luxury condo sales in 2024.
- We further expect the combination of a moderate pace of sales and a steady stream of new construction condos being delivered to keep inventory levels above their ideal range in Greater Downtown and the market somewhat buyer-friendly but essentially balanced in terms of value.
|
Q1 2024 Trends |
Overall Miami |
GDM |
Edgewater |
Brickell |
Downtown |
|
Sales |
Down |
Down |
Down |
Down |
Flat |
|
Sales Trendline |
Negative |
Negative |
Negative |
Negative |
Negative |
|
Price/Sq. Ft. |
Up |
Flat |
Down |
Up |
Up |
|
Days on Market |
Up |
Up |
Up |
Up |
Flat |
|
Inventory |
Up |
Up |
Up |
Up |
Up |
Do you want more data and Miami market analyses? Subscribe at the top right corner of this page to receive the latest Miami luxury condo market news in your inbox.
If you have any questions or comments about the Greater Downtown Miami luxury condo market updates and stats, are interested in browsing the market, or want to have a valuation of your property, reach out to us directly via email, call, or text and we'll be happy to help you.