Annual Highlights + Q4 2023 Luxury Condo Market Summary: Stable Growth with Positive Outlook

Feb 01, 2024 February 01, 2024
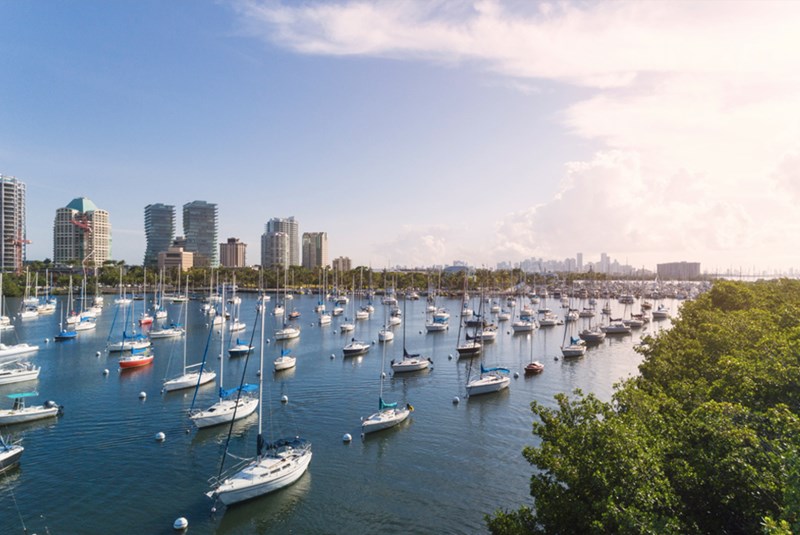
Miami’s luxury condo market closed in 2023 on an incredibly strong note. While Q4 2023 reported the second-highest sales in a fourth quarter, our year-end analysis revealed annual sales exceeded pre-pandemic levels. On a neighborhood basis, the combined areas of Coconut Grove & Coral Gables were winners across the board.
Both of these sales statistics, paired with the annual price per square foot peaking to an all-time high and inventory keeping to moderate levels by year-end 2023, we, as real estate experts, conclude that our luxury housing market has expanded and, as a result, is likely to grow positively in this new year.
While 2023 may not have been a year of epic highs, all sales and price statistics indicate that Miami’s luxury housing market is capable of sustaining the historical shifts and growth garnered during the pandemic-triggered buying spree of 2021. Even as the market continued stabilizing from this extraordinary surge and experienced its usual seasonal slowdown in Q4 2023, it still adhered to its newfound benchmarks, bringing balanced and sustainable growth opportunities for both buyers and sellers.
The takeaway? Overall, Q4 2023 closed with a marginal increase in sales activity and an expected uptick in inventory vs Q3. However, as prices posted moderate gains and days on market stayed low (with properties selling within 2-3 months), the luxury condo market showed signs of incredible stability and great health, making Miami one of the few housing markets in the U.S. to bank on in 2024.
And, while inventory may have temporarily shifted outside its ideal range of 9-12 months, as real estate experts, we expect levels to normalize again as we go through peak season. However, the window for buyers to take advantage of the additional wiggle room and choose from a wider array of options is likely to get smaller. Sellers, too, can take advantage of heightened demand from incoming high-net-worth households and digital nomads by keeping prices competitive.
Finally, relating to annual numbers, sales for 2023 reported a 31.5% decline against 2022. However, they posted an incredible 103.5% increase compared to the annual sales of 2020 and roughly the same for 2019 – showing that Miami’s luxury condo market is in one of its most lucrative cycles and marching strong into 2024.
— Q4 2023 Key Statistics
Q4 2023 Overall Miami luxury condo market closed sales: 285
- Year-over-year change in closed sales: +1.1% (285 vs 282 sales in Q4 2022)
- Quarter-over-quarter change in closed sales: -21.7% (285 vs 364 sales in Q3 2023)
Q4 2023 Overall Miami luxury condo market median sales price: $1.65M
- Change in Median Sales Price: -0.3% (Q4 2023 vs Q4 2022)
Q4 2023 Overall Miami luxury condo market inventory: 18 months
— Year 2023 Key Statistics (Annual Trends)
Total closed sales (2023) - Overall Miami luxury condo market:
- 2023-over-2022 change in closed sales: -31.5% (1,455 vs 2,123 total sales in 2022)
- 2023-over-2020 change in closed sales: 103.5% (1,455 vs 715 total sales in 2020)
Median sales price (2023) - Overall Miami luxury condo market: $1.67M
- Change in median sales price: -1.1% (2023 vs $1.68M in 2022)
Is this a seller’s or buyer’s market? Although current inventory levels (18 months) suggest Miami’s luxury condo market to be a buyer’s market, we recommend reading it as a leveled playing field for buyers and sellers.
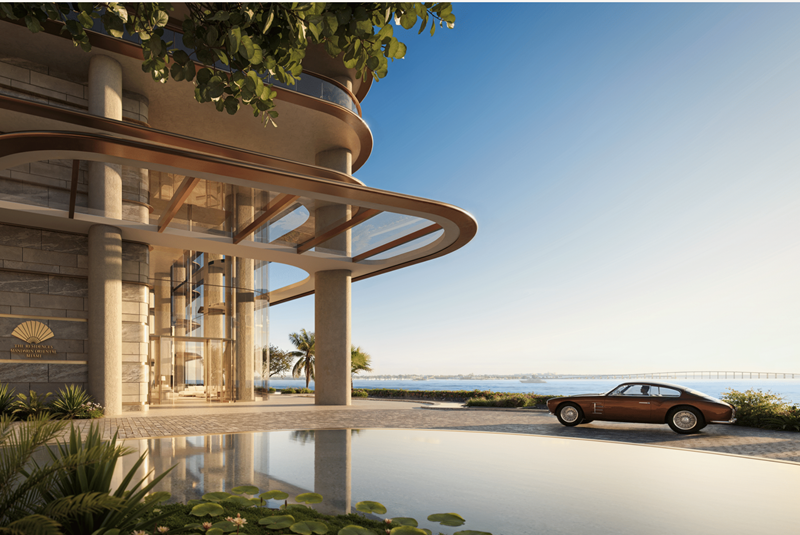
On one hand, we expect inventory to increase in 2024 with prestigious pre-construction condo projects scheduled for delivery such as Una or Aston Martin Residences, and a decline in mortgage rates to give some sellers the confidence to list. However, we also expect continuous demand from high-income households moving to Miami and spring delivering its usual acceleration in sales activity, keeping inventory levels in check and the market fundamentally balanced through 2024.
— Q4 2023 MIAMI LUXURY CONDO MARKET SUMMARY
| Number of Sales | % change in Sales | Median Sale Price | % change in Median Sale Price | Median SP/SqFt | % change in Median SP/SqFt | Median Days On Market |
Q4 2023 | 285 | +1.1% | $1,650,000 | -0.3% | $951 | +0.5% | 66 |
Q4 2022 | 282 | $1,655,000 | $947 | 68 |
— 2023 MIAMI LUXURY CONDO MARKET ANNUAL SUMMARY
| Number of Sales | % change in Sales | Median Sale Price | % change in Median Sale Price | Median SP/SqFt | % change in Median SP/SqFt | Median Days On Market |
2023 | 1455 | -31.5% | $1,670,000 | -1.1% | $950 | +1.9% | 72 |
2022 | 2123 | $1,688,166 | $932 | 68 | |||
2020 | 715 | +103.5% | $1,625,000 | +2.8% | $770 | +23.4% | 127 |
Read on for a closer look into a neighborhood-wise breakdown of our quarterly findings for Q4 2023, plus the overall statistics for 2023.
*For this Miami luxury condo market report, we've only included properties priced at $1 million and above. The neighborhoods included in this market summary are Downtown Miami, Edgewater, Wynwood, Midtown and the Design District, Brickell, Coconut Grove, Coral Gables, Key Biscayne, Miami Beach, Fisher Island, Surfside and Bal Harbour, and Sunny Isles Beach.
— Q4 2023 & Annual Miami Luxury Condo Market Sales
Overall sales flat year-over-year – 2nd-highest volume in a fourth quarter
With 285 sales, Q4 2023 volumes nudged past those in the previous year (282 sales in Q4 2022) by a close margin of 1.1%. Outperforming Q4 2022 to establish itself as the second-best fourth quarter in history, Q4 2023 only fell behind the astronomical high of Q4 2021 (563 sales).
As the market expectedly paced down over winter, volumes declined 21.7% quarter-to-quarter, down from 364 in Q3 2023 to 285 in Q4 2023.
Q4 2023 Miami Neighborhood Condo Sales at a Glance
Neighborhood | Q4 2023 | Q4 2022 | % Change |
Greater Downtown Miami* | 83 | 91 | -8.8% |
Miami Beach** | 156 | 155 | +0.6% |
Coconut Grove & Coral Gables | 46 | 36 | +27.8% |
*Greater Downtown Miami includes Edgewater, Brickell & Downtown.
**Miami Beach includes South Beach, Mid-Beach, North Beach, Surfside & Bal Harbour, Sunny Isles & Fisher Island.
Looking into a broader, neighborhood-wise sales comparison (above), the combined neighborhood of Coconut Grove & Coral Gables topped popularity charts in Q4 2023 – leading market growth with the highest percentage gain in year-over-year sales (46 in Q4 2023 vs. 36 in Q4 2022). On the other hand, sales in the Greater Downtown area slowed with an 8.8% decline in year-over-year sales.
In a more detailed neighborhood watch, Sunny Isles Beach reported the highest sales volume of all neighborhoods under quarterly review, closing this fourth quarter with 54 sales.
With the luxury condo market expectedly pacing down, as it historically does every third and fourth quarter of the year, the 12-month sales trendline down-shifted into a negative trajectory from a positive curve in Q3 2023. Coconut Grove & Coral Gables (collectively) was the only neighborhood to report a positive 12-month trendline in Q4 2023.
While this would generally indicate a further softening of the luxury housing market, as real estate experts, we expect the market to maintain its momentum, if not pace up, owing to steady buyer demand and the high season kicking off in the first quarter of 2024 (evidenced by historical data).
Annual sales down 31.5% from 2022, but higher than pre-pandemic years
With sales expectedly normalizing from the supercharged highs of 2021, one of the biggest questions of 2023 was whether Miami’s luxury condo market would come crashing down or sustain its growth thresholds, and it has been answered. Even as sales fell short of 2021’s record-setting highs, 2023 closed on a strong note, reporting market stability and higher annual sales compared to any pre-pandemic year.
With 1,455 annual sales, 2023 concluded on a high note, as Q3 and Q4 this year outperformed Q3 and Q4 2022. With softer numbers than 2022 (with 2,123 annual sales) and 2021 (with 2,353 annual sales), 2023 far exceeded those in pre-pandemic years: 715 sales in 2020, 718 in 2019, 692 annual sales in 2018, and so on – indicating sustained market strength.
Annual Miami Neighborhood Condo Sales at a Glance
Neighborhood | 2023 | 2022 | % Change |
Greater Downtown Miami* | 445 | 646 | -31.1% |
Miami Beach** | 824 | 1258 | -34.5% |
Coconut Grove & Coral Gables | 186 | 219 | -15.1% |
*Greater Downtown Miami includes Edgewater, Brickell & Downtown.
**Miami Beach includes South Beach, Mid-Beach, North Beach, Surfside & Bal Harbour, Sunny Isles & Fisher Island.
On a more in-depth analysis of neighborhoods, Coconut Grove & Coral Gables (collectively) and Downtown Miami emerged as the most resilient markets of 2023 – reporting only a 15.1% decline in year-over-year total sales, respectively, while Downtown Miami followed closely with only a 17% decline in annual sales (80 in 2023 vs. 96 in 2022) (not shown in chart above). This is most likely because, for several quarters, these two neighborhoods offered exceptional entry price points into the market for buyers, who moving here, sought more affordable luxury housing options along the Grove’s quiet waterfront or closer to work in Miami’s urban core.
In terms of volume, Sunny Isles Beach reported the highest number of sales out of all neighborhoods under review – closing 2023 with a total of 297 sales.
— Q4 2023 & Annual Miami Luxury Condo Market Prices
Q4 2023 price/sq. ft. flat year-over-year at $951/sq. ft. – peaked to second-highest-ever
It was another year of positive price trends in Miami's balanced luxury condo market, with sellers earning top-dollar for their properties. Posting a marginal uptick of 0.5% ($951 in Q4 2023 vs. $947 in Q4 2022), Q4 2023 nudged past its year-ago value to close with the second-highest price per square foot in history. Most Miami neighborhoods in our quarterly review – mainly from the urban core (as can be seen in the table below) – contributed to this statistic with year-over-year gains.
Luxury condos in the combined neighborhood of Surfside & Bal Harbour delivered maximum gains for sellers, closing Q4 2023 with the highest percentage increase in year-over-year price per square foot. Prices in this sub-market increased from $1,028 in Q4 2022 to $1,592 in Q4 2023, reporting a 55% increase in year-over-year values.
Continuing its prominence as the most expensive zip code for luxury condos in Miami and one of the top in the country, Fisher Island reported a median price of $1,854 per square foot. On the other hand, Downtown maintained its title as Miami’s most affordable neighborhood for luxury condos in Q4 2023, reporting a median price of $762 per square foot.
Q4 2023 Price per Square Foot at a Glance
Neighborhood | Q4 2023 | Q4 2022 | % Change |
Greater Downtown Miami* | $870 | $836 | +4.1% |
Miami Beach** | $1,133 | $1,139 | -0.6% |
Coconut Grove & Coral Gables | $801 | $719 | +11.5% |
*Greater Downtown Miami includes Edgewater, Brickell & Downtown.
**Miami Beach includes South Beach, Mid-Beach, North Beach, Surfside & Bal Harbour, Sunny Isles & Fisher Island.
Annual (2023) Price/Sq. Ft. at an all-time high of $950
On an annual basis, the price per square foot for luxury condos in Miami peaked at a record-setting $950/square foot – reporting a marginal 1.9% gain against $932/sq. ft. in 2022 and a 10.5% gain against $860/sq. ft. in 2021. A majority of the Miami neighborhoods under our review contributed with an uptick in their annual price per square foot.
Luxury condos in the combined neighborhood of Coconut Grove & Coral Gables plus Miami’s Edgewater reported maximum gains for sellers, with the highest percentage increase in year-over-year price per square foot. Annual prices in Coconut Grove & Coral Gables increased from $758/sq. ft. in 2022 to $840/sq. ft. in 2023, while those in Edgewater increased from $878/sq. ft. in 2022 to $954/sq. ft. in 2023 – reporting an 11% and 9% gain, respectively.
Fisher Island continued as the most expensive zip code for luxury condos with an annual price of $1,932 per square foot. On the other hand, Downtown Miami retained its position as the most affordable neighborhood, with a median 2023 price of $737 per square foot.
Annual Price per Square Foot at a Glance
Neighborhood | 2023 | 2022 | % Change |
Greater Downtown Miami* | $872 | $824 | +5.8% |
Miami Beach** | $1,087 | $1,103 | -1.4% |
Coconut Grove & Coral Gables | $840 | $758 | +10.7% |
*Greater Downtown Miami includes Edgewater, Brickell & Downtown.
**Miami Beach includes South Beach, Mid-Beach, North Beach, Surfside & Bal Harbour, Sunny Isles & Fisher Island.
— Q4 2023 & Annual Miami Luxury Condo Days on Market
Q4 2023 Days on market down 3% from Q4 2022 – Luxury condos took only 66 days to sell
Even as sales activity slowed down for the winter, as it does every year in Miami’s seasonal housing market, luxury condos sold 3% faster compared to a year ago (66 days in Q4 2023 vs. 68 days in Q4 2022) – showing great market health. Most Miami neighborhoods (in our quarterly analysis) contributed to the trend, reporting a decline in the number of days luxury condos spent on the market before they sold.
Taking only 41 days to sell, the combined neighborhood of Coconut Grove & Coral Gables emerged as the fastest-selling market of Q4 2023. On the other hand, Fisher Island again reported the highest days on market this fourth quarter, as properties took 259 days on average to sell.
Q4 2023 Days on Market at a Glance
Neighborhood | Q4 2023 | Q4 2022 | % Change |
Greater Downtown Miami* | 74 | 58 | +27.6% |
Miami Beach** | 74 | 79 | -6.3% |
Coconut Grove & Coral Gables | 41 | 74 | -44.6% |
*Greater Downtown Miami includes Edgewater, Brickell & Downtown.
**Miami Beach includes South Beach, Mid-Beach, North Beach, Surfside & Bal Harbour, Sunny Isles & Fisher Island.
Luxury condos took 2.5 months (median) to sell in 2023
Overall, in 2023 luxury condos sold 5.9% faster compared to a year ago, indicating that buyers and sellers were quicker to agree (72 days in 2023 vs 68 days in 2022).
Taking only 58 days to sell, the combined neighborhood of Coconut Grove & Coral Gables emerged as the fastest-selling market of 2023 (on an annual basis), followed by Downtown Miami taking 62 days. However, a majority of the Miami neighborhoods under our annual analysis reported an increase in the number of days condos spent on the market, from listing to closing.
Annual Days on Market at a Glance
Neighborhood | 2023 | 2022 | % Change |
Greater Downtown Miami* | 69 | 63 | +9.5% |
Miami Beach** | 77 | 78 | +1.3% |
Coconut Grove & Coral Gables | 58 | 41 | +41.5% |
*Greater Downtown Miami includes Edgewater, Brickell & Downtown.
**Miami Beach includes South Beach, Mid-Beach, North Beach, Surfside & Bal Harbour, Sunny Isles & Fisher Island.
— Q4 2023/Year-end Miami Luxury Condo Market Inventory
Overall Inventory up to 18 months
As predicted in our Q3 2023 luxury housing report, inventory increased towards the end of the year, as our seasonal market paced down for the winter and more sellers listed in anticipation of high season in spring 2024.
With overall inventory at 18 months – up 28.6% from 14 months in September 2023 and 5.9% from 17 months in December 2022 – the statistic closed above the 9-12-month range of a balanced market. While Miami’s luxury condo market seems to have transitioned into a buyer’s market on paper, anecdotal evidence from our day-to-day interactions indicates a healthy market with equal opportunity for buyers and sellers.
Of all the neighborhoods under review, the combined neighborhoods of Coconut Grove and Coral Gables continued to report the lowest months of inventory with 9 months.
With quite a few pre-construction condos scheduled for completion in 2024 and with some relief in mortgage rates nudging more sellers to the market, as luxury real estate experts, we expect a slight increase in inventory levels in the new year. However, we also anticipate heightened demand for luxury housing and an upcoming high season to keep inventory levels in check and prevent them from exceeding pre-pandemic levels.
This means, buyers can enjoy some extra wiggle room with several choices catering to their price point, while sellers can benefit from keeping pricing competitive.
Q4 2023 Inventory at a Glance
Neighborhood | Q4 2023 | Q4 2022 | % Change |
Greater Downtown Miami* | 19 | 17 | +11.8% |
Miami Beach** | 20 | 18 | +11.1% |
Coconut Grove & Coral Gables | 9 | 12 | -25.0% |
*Greater Downtown Miami includes Edgewater, Brickell & Downtown.
**Miami Beach includes South Beach, Mid-Beach, North Beach, Surfside & Bal Harbour, Sunny Isles & Fisher Island.
— Q4 2023 & Annual Miami Neighborhood Luxury Condo Market Summary
Outperforming Q4 2022, luxury condos in Miami recorded their second-best 4th-quarter sales in Q4 2023. On an annual basis, overall sales remained strong, exceeding pre-pandemic levels and staying stable against the new growth thresholds established by the booming market of 2021.
Overall, the annual price per square foot reported a new peak of $950/sq. ft., showing sellers received excellent value in Miami’s balanced market. In Q4 2023, prices jumped to their second-highest levels. At $951/sq. ft., the price per square foot hovered close to its previous year's closing of $947/sq. ft. – indicating steady appreciation in Miami’s mature luxury housing market.
Overall, the annual days on market statistic reported a 6% year-over-year increase. However, pairing this with the 3% year-over-year decline noted in Q4 2023, historically known to be a slower quarter, buyers and sellers were consistently quick to close deals.
Further, inventory levels increased by only 5.9% compared to December 2022, keeping the market balanced and equally favoring both buyers and sellers.
— Miami Luxury Housing Market Predictions – 2024
From reporting historical shifts in 2021 to showing unwavering stability in 2023, it’s no secret that Miami’s luxury condo market is in one of its most favorable cycles in recent history. Shifting focus from being a vacation hotspot to a global city people choose to call home, Miami’s housing market has grown leaps and bounds. With indications of positive growth in 2024, as real estate experts, we expect the following factors to drive our globally coveted luxury housing market:
- Owing to the continued migration of businesses, business moguls such as Jeff Bezos or Ken Griffin, and the ever-increasing demand from high-income households moving to Miami for its lucrative tax benefits, we expect Miami’s luxury housing sector to remain in the buyer spotlight throughout 2024.
- With New Yorkers becoming the new “foreign buyers” in Miami, and our loyalist Latin American buyers returning with an investment of about $5.1 billion in South Florida housing in 2023 alone, we expect deep-pocketed home shoppers to keep the market moving regardless of the mortgage rates.
- With Miami continuing to be in the international spotlight for banking, trade, wealth management, and all major sports – especially with Lionel Messi’s relocation and FIFA moving its headquarters ahead of the 2026 World Cup – we expect our growing economy to continue fueling demand for luxury housing.
- With market analysts predicting mortgage rates to fall under the 6-7% range over the next year, we expect more buyers and sellers to get off the sidelines and re-enter the market.
- Further, with a booming new construction condo market, offering high-end products such as the Bentley Residences or St. Regis Residences, and many of them poised for completion in 2024, like Natiivo and Gale Residences, Aston Martin Residences, and Mr. C Residences, we expect more ultra-high-net-worth and high-net-worth individuals to invest in our evolving landscape.
- Finally, with our international-grade and active lifestyle powered by destination beaches, nature-dominated landscape, collection of world-class restaurants, and year-round calendar of events, we expect more motivated buyers to land on our sunny shores.
To stay tuned for expert and insider market reports of the luxury condo market in Miami and Miami Beach, subscribe to this blog as we will soon be rolling out separate reports for the overall Miami market, Miami Beach, Greater Downtown Miami, and Coconut Grove plus Coral Gables (collectively).
If you have specific questions about this data or would like a market assessment of your property, please reach out to us directly or via our social media @blackbookproperties, call or email us anytime.
Share your thoughts with us
Your Miami Condo Awaits
Recent Posts


