

Olympus Towers and Marina


2500 Parkview Drive, Hallandale, FL 33009
About
Olympus Towers and Marina
Key Building Details


Do you own in Olympus Towers and Marina?
Our condo sales experts and premier marketing team can help you sell your place for top dollar.


Building Amenities


Additional details
Olympus Towers and Marina floorplans
Olympus Towers and Marina building stats


Olympus Towers and Marina building stats
Sales stats
Key averages for the building
$323,241
$269
$321,833*
*past six months
$252*
*past six months
105*
Avg Days on Market
*past six months
Sales history
Number of sold condos by month
Request info
Market Reports
Q3 2026 Miami Beach Luxury Condo Market Report: Steady Market with Distinct Opportunities
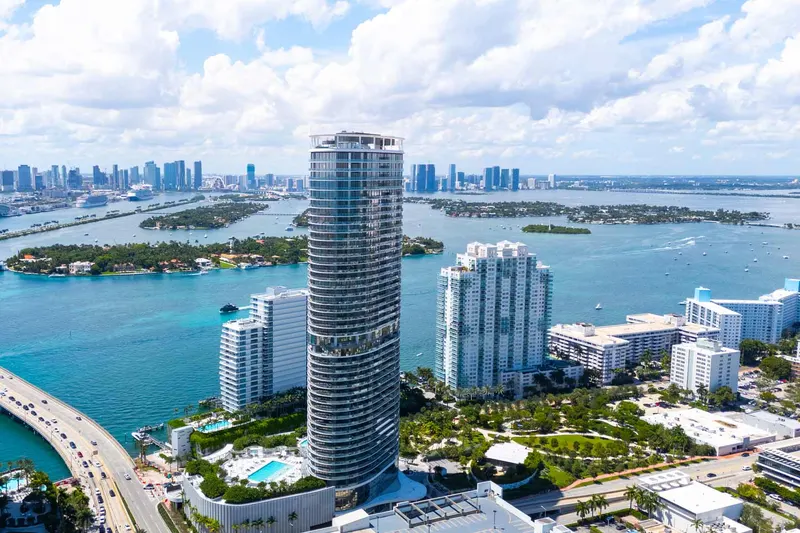
As Miami’s luxury condo market entered the traditionally slower half of the year, Miami Beach reported a relatively stable picture in Q3 2026, with sales remaining largely flat year-over-year. While the Coastal Mainland recorded stronger sales growth, Miami Beach accounted for $648 million or 63% of Miami’s total dollar volume in the $1M+ condo segment. Additionally, tighter inventory across Miami Beach continued to give sellers greater leverage.
Market Reports
Quarterly Reports
Q3 2026 Coastal Mainland Miami Luxury Condo Market Report: Strong Sales, New Development, and Buyer Opportunity
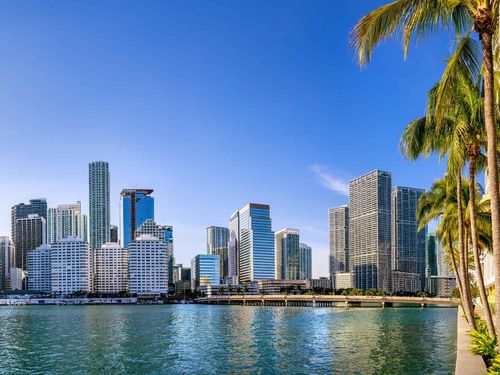
Coastal Mainland Miami sustained its strong sales pace in Q3 2026, extending the momentum established in the first half of 2026. Newer inventory and high-priced sales in the $5M+ tier helped push the region’s median sale price to a record $1.79 million, even with some price softening in select neighborhoods and condos.
Market Reports
Q3 2026 Overall Miami Luxury Condo Market Report: Sales Momentum Holds Amid Seasonal Shifts
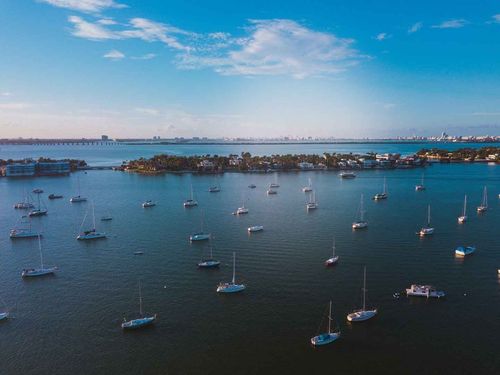
Q3 2026 saw several of the trends that shaped Miami’s luxury condo market earlier this year continue to play out. Sales increased 5% year-over-year, while total dollar volume edged up 1.1% to $1.029 billion, extending the market’s positive sales momentum into the traditionally slower half of the year. As we've seen in previous quarters, price performance varied by tier and location. The $2–5M segment led the quarter in sales and dollar-volume growth, while waterfront properties dominated its most expensive sales.