logo

The Beach Club II

share

1830 S Ocean Drive, Hallandale Beach, FL 33009

Loading...
Sale
32
Rent
103
PRICE
$609,000+
SQ FT
811-2,566
UNITS
480
STORIES
51
BUILT
2006

About

The Beach Club II

Key Building Details

Neighborhood
Avg Price / Sq Ft
$917
Avg Assoc Fee
$1.04 / sq ft / month
Walk Score ®
CBB Rank
4.8/5help popup
Pets
Pets OK for Owners & Renters

Do you own in The Beach Club II?

Our condo sales experts and premier marketing team can help you sell your place for top dollar.

See building stats
See building stats

Building Amenities

Pool / Spa
Pool / Spa
Heated Pool, Spa / Hot Tub, Sauna
Water Access
Water Access
Ocean Access
Sport / Fitness
Sport / Fitness
Exercise Room, Pool
Parking
Parking
Assigned, Garage, Valet
General Amenities
General Amenities
Bar, Elevator
Waterfront
Waterfront
Deeded Beach Access, Waterfront Ocean

Additional details

Avg Price / Sq Ft
$917
Unit Conveniences
Central Cooling, Central Heat, Dishwasher, Electric Cooling, Electric Heat, Walk In Closets, Washer/Dryer
Maintenance Includes
N/A
Type of Association
N/A
Style
Condo, Condo 5+ Stories, Condo/Co-Op/Annual, Condo/Co-Op/Seasonal
Transit Score ®
Bike Score ®

Available Condos at The Beach Club II

There are currently no units listed for sale in the MLS
for price list and members-only developer specials

The Beach Club II floorplans

The Beach Club II floorplans
Apt#
01,02
03
04
05
06,08
07
10
11
Model
Unit B
Unit D
Unit C
Unit G
Unit E
Unit F
Unit H
Unit J
Bed / Baths
2 / 3 + Den
2 / 3 + Den
2 / 3 + Den
Studio / 1 + Den
2 / 2
1 / 1
1 / 2 + Den
2 / 2 + Den
Floors
10 - 50
10 - 50
10 - 50
10 - 51
10 - 51
10 - 51
10 - 50
10 - 50
Interior + Ext (Sq Ft)
2,065 + 586
1,733 + 289
1,675 + 294
811 + 121
1,458 + 566
871 + N/A
1,337 + 198
1,554 + 264

The Beach Club II building stats

Inventory
Condos for Sale and for Rent
480
Total Condos
32 Condos for Sale
7% of building
103 Condos for Rent
21% of building
28%
of building

Sales stats

Key averages for the building

AVG LIST PRICE

$1,282,813

AVG LIST PRICE / SQ FT

$917

AVG SALE PRICE

$1,134,286*

*past six months

AVG SALE PRICE/ SQ FT

$813*

*past six months

91*

Avg Days on Market

*past six months

Sales history

Number of sold condos by month

November 2026
1
October 2026
4
September 2026
2
August 2026
0
July 2026
6
June 2026
1

Request info

By submitting this form, you agree to be contacted by Blackbook Properties via call and email. To opt-out, you can reply “stop” at any time or click the unsubscribe link in the emails. Message and data rates may apply. Terms of Use and Privacy Policy

Q3 2026 Miami Beach Luxury Condo Market Report: Steady Market with Distinct Opportunities

Market Reports

Q3 2026 Miami Beach Luxury Condo Market Report: Steady Market with Distinct Opportunities

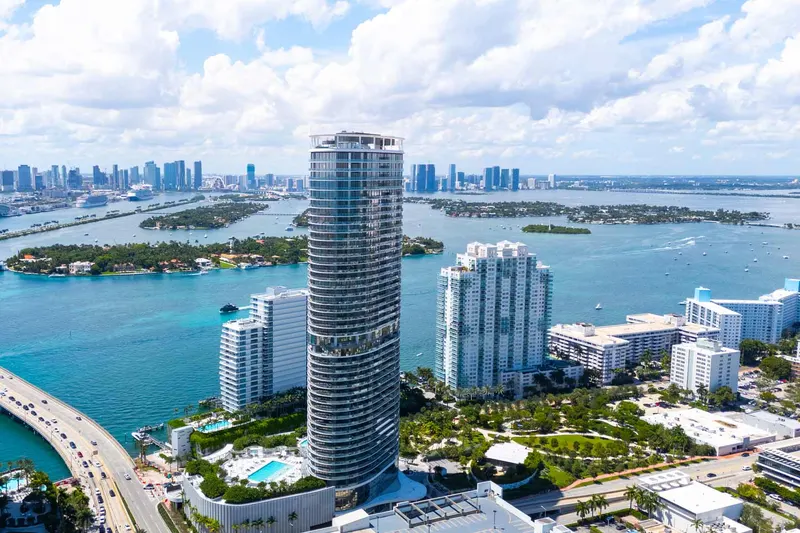
As Miami’s luxury condo market entered the traditionally slower half of the year, Miami Beach reported a relatively stable picture in Q3 2026, with sales remaining largely flat year-over-year. While the Coastal Mainland recorded stronger sales growth, Miami Beach accounted for $648 million or 63% of Miami’s total dollar volume in the $1M+ condo segment. Additionally, tighter inventory across Miami Beach continued to give sellers greater leverage.
Q3 2026 Coastal Mainland Miami Luxury Condo Market Report: Strong Sales, New Development, and Buyer Opportunity

Market Reports

Quarterly Reports

Q3 2026 Coastal Mainland Miami Luxury Condo Market Report: Strong Sales, New Development, and Buyer Opportunity

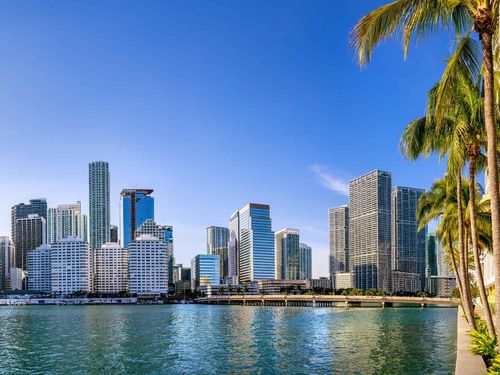
Coastal Mainland Miami sustained its strong sales pace in Q3 2026, extending the momentum established in the first half of 2026. Newer inventory and high-priced sales in the $5M+ tier helped push the region’s median sale price to a record $1.79 million, even with some price softening in select neighborhoods and condos.
Q3 2026 Overall Miami Luxury Condo Market Report: Sales Momentum Holds Amid Seasonal Shifts

Market Reports

Q3 2026 Overall Miami Luxury Condo Market Report: Sales Momentum Holds Amid Seasonal Shifts

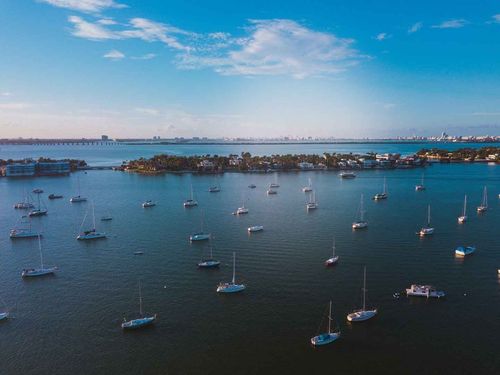
Q3 2026 saw several of the trends that shaped Miami’s luxury condo market earlier this year continue to play out. Sales increased 5% year-over-year, while total dollar volume edged up 1.1% to $1.029 billion, extending the market’s positive sales momentum into the traditionally slower half of the year. As we've seen in previous quarters, price performance varied by tier and location. The $2–5M segment led the quarter in sales and dollar-volume growth, while waterfront properties dominated its most expensive sales.