Greater Downtown Miami Luxury Condo Market Report Q1 2020

May 11, 2020 May 11, 2020
CondoBlackBook.com’s overall Miami luxury condo market report for Q1 2020 shows that the year got off to a good start considering the global health crisis. Even with the coronavirus outbreak, overall sales in Miami did not seem to bear any major impact from the pandemic (except for some Miami Beach areas), and the month of March delivered some interesting spikes.
The overall Miami market report also revealed a decline in the year-over-year days on market and months of inventory for luxury condos, capturing positivity in market momentum. However, Miami’s luxury condo market still turned out to be buyer-friendly, keeping its high levels of inventory. Further, declining prices showed signs of pressure exerted by such a biased market.
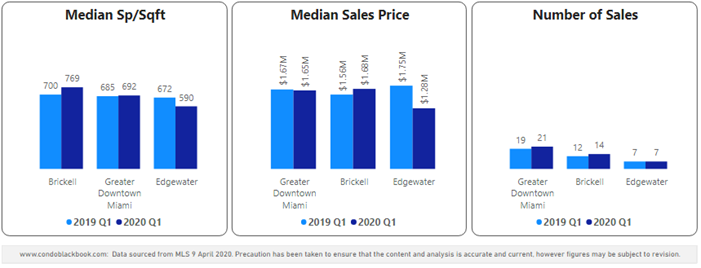
In this Greater Downtown Miami neighborhood-level analysis, sales were up 10% year-over-year, and Brickell reported its highest price per sq. ft. yet since 2016, along with a good bump in sales. Read on to find details on how the luxury condo market fared in Greater Downtown and its sub-markets of Brickell and Edgewater in Q1 2020. The study below also features a comparison to the overall market trends reported in Miami for the quarter.
Overall Greater Downtown Miami Luxury Condo Market & Submarkets at a Glance
For the purpose of this report, we’ve included areas with the zipcodes 33129, 33130, 33131, 33132, 33136, 33137 – essentially Brickell Hammock, Brickell, Brickell Key, Downtown, Arts & Entertainment District, Edgewater, Wynwood, Midtown and the Design District. Further, this luxury condo market report only features properties priced $1 million and above.
Greater Downtown Miami Area Luxury Condo Market Q1 Highlights
- Sales up 10.5% year-over-year
- Price per sq. ft. up 9.2% quarter-to-quarter
- Price per sq. ft. and median sales price stay flat year-over-year
- Days on market down 4.5% year-over-year
- Inventory declines 21.1% year-over-year
Edgewater
- Same sales as 1Q19
- 12-month trendline stays positive from Q4 2019 to Q1 2020
- Price per sq. ft. down 12.3% year-over-year to below $600
- Days on market decline 26.9% year-over-year
- Inventory down 10.6% year-over-year
Brickell
- Sales increase 16.7% year-over-year to post best Q1 in three years
- Price per sq. ft. jumps to $769, highest since Q1 2016
- Days on market increase 18.6% year-over-year
- One of only three Miami neighborhoods with increase in quarter-to-quarter inventory
- Inventory down 26.9% year-over-year
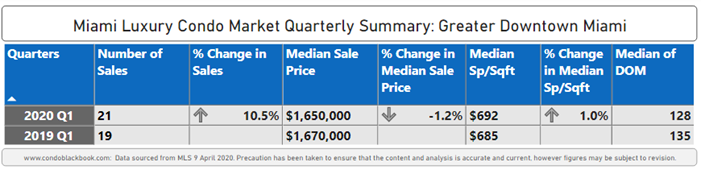
1Q20 Greater Downtown Miami Luxury Condo Market Summary - Fig. 1
Overall Greater Downtown Miami Luxury Condo Market Trends: Q1 YoY Sales Up
Uptick in year-over-year Q1 sales, but trendline negative. Greater Downtown Miami as a whole posted a 10.5% increase over Q1 2019 (fig. 1), while almost all other metrics stayed flat. This uptick in sales goes against the overall market trend in Miami of a soft first-quarter opening (influenced by weak sales in Miami Beach).
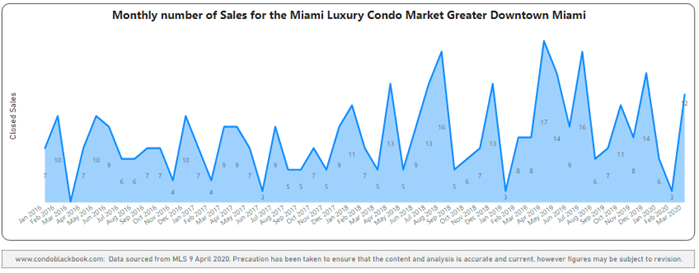
A look at fig. 2.2 below reveals that a spike in January and March’s sales was the biggest contributing factor to this area’s boost. Considering March was beginning the height of the Coronavirus situation, the neighborhood grouping posted a whopping 12 closed sales. While January reported twice as many sales from last year (6 versus 3). Year over year, March posted 12 sales against the previous years’ closing of 8. Only February posted a decline, down from 8 sales in 2019 to 3 this year. This monthly sales analysis further reveals that Miami’s luxury condo market didn’t seem to show any impact of the COVID-19 outbreak during the first quarter.
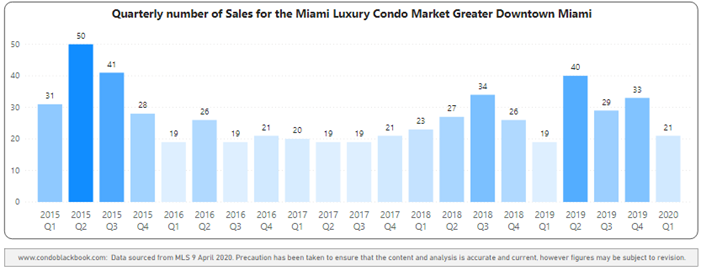
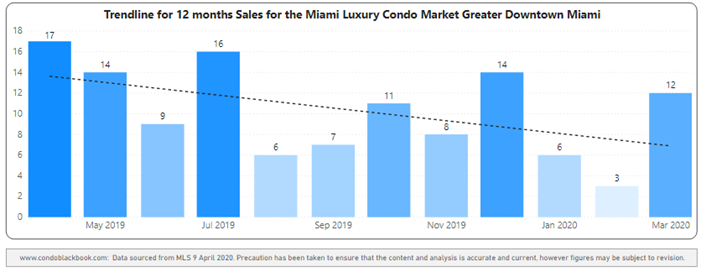
The 12-month trendline in fig. 2.3 changes from positive in the last quarter to negative this quarter due to higher than normal sales in the previous three quarters (Q2-Q4 2019), and a very slow February. Whether this negative trendline will continue into the second quarter of 2020 remains to be seen.
Greater Downtown Quarterly Sales Heatmap 2015 - 2020 - Fig. 2.1
Greater Downtown Monthly Sales from Jan. 2016 to Mar. 2020 - Fig. 2.2
Greater Downtown 12-Month Sales with Trendline - Fig. 2.3
Luxury Condo Prices Flat YoY - Price/Sq. Ft. + Sales Price
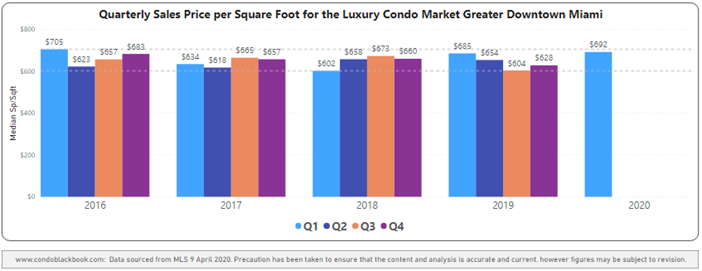
Price/sq. ft. essentially flat at $692. Deviating only slightly from the general trend of declining prices seen in the overall Miami market report for Q1, the price per sq. ft. stayed flat year-over-year, reporting only a marginal (1%) increase (fig. 1) for this mainland grouping. On a quarter-to-quarter basis, however, luxury condos posted an increase of 9.2%, up from $628 in 4Q19 (fig. 3).
The median sales price too stayed flat (-1.2%) year-over-year in Greater Downtown Miami, slipping slightly from $1,670,000 in Q1 last year to $1,650,000 this year. What’s further worth noting is that even though the median price per sq. ft. remained flat year-over-year, it trended towards the higher-end of the four-year price-range seen in fig. 3 below.
Greater Downtown Quarterly Price per Sq. Ft. 2016-2020 - Fig. 3
Days on Market Down YoY in Downtown
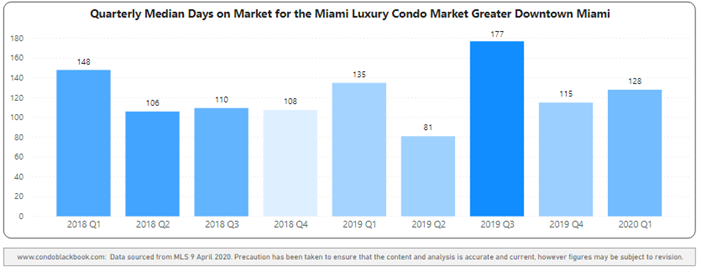
4.5% decline in year-over-year days on market. Greater Downtown’s luxury condos spent 7 fewer days on market compared to the same quarter 2019 (fig. 4), showing that buyers and sellers had an improvement in dialogue compared to last year.
On a quarter-to-quarter basis, however, luxury condos spent 13 more days on market. This increase does not necessarily point towards a decline in buyer-seller communication, but normalization of data after a steep fall from 177 days in Q3 2019 to 115 in Q4 2019.
Greater Downtown Quarterly Days on Market 2018 - 2020 Heatmap – Fig. 4
Higher Quarter-end Inventory Favors Buyers
Q1 closes with 71 months of inventory. Consistent with the overall market trend in Miami, Greater Downtown’s luxury condo inventory dropped 21.11% year-over-year, declining from 90 months last March to 71 months this year (fig. 5).
On a quarter-to-quarter basis, however, inventory increased by 14.5% from December-end’s 62 months. This increase combined with levels already being way off their ideal 9-12-month benchmark gives buyers a great window of opportunity to seize the best deals in the neighborhood. To see which luxury condos are available, search the Greater Downtown area here.
Greater Downtown Months of Inventory from Mar. 2019 to Mar. 2020 - Fig. 5
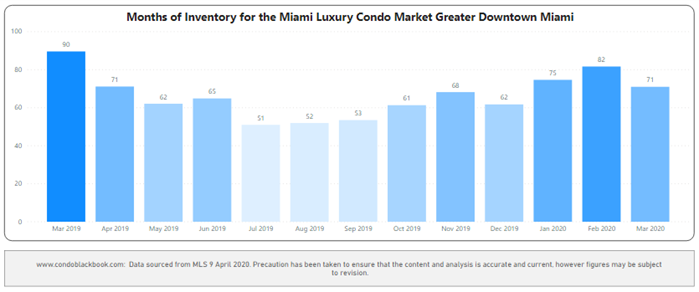
A balanced market has only 9-12 months of inventory. The months of inventory are calculated as – no. of active listings + no. of pending listings divided by the average number of deals in the last 6 months.
Greater Downtown Miami Neighborhoods: Edgewater Market Trends (33132 and 33137)
1Q20 Edgewater Luxury Condo Market Summary – Fig. 6
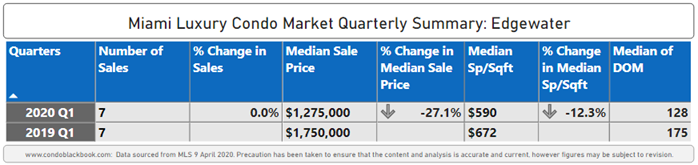
Edgewater Luxury Condo Sales Stable YoY
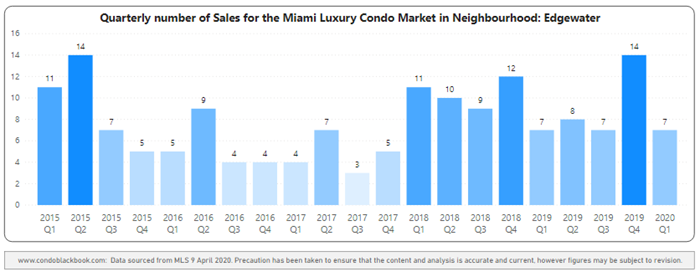
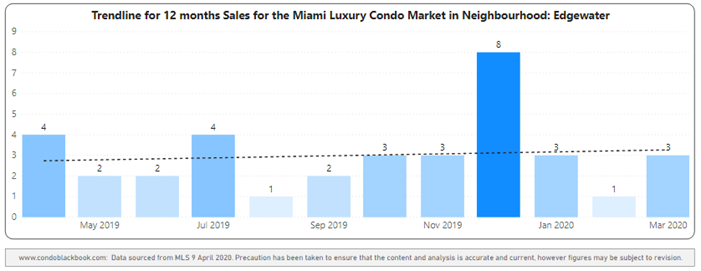
Q1 sales same as previous year with positive trendline. Deviating from the overall market trend of lower year-over-year sales in Miami, Edgewater matches its sales performance from Q1 last year (fig. 6). This, along with a positive 12-month trendline showing in fig. 7.2, indicate good market momentum in the sub-neighborhood.
Edgewater Quarterly Sales Heatmap 2015 - 2020 - Fig. 7.1
Edgewater 12-Month Sales with Trendline - Fig. 7.2
Luxury Condo Prices Drop in Edgewater
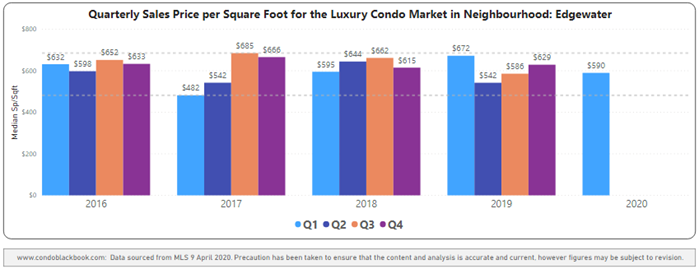
Price/sq. ft. drops 12.3% to $590, median price also down 27.1% year-over-year. In step with the decline in prices seen in the overall Miami luxury condo report for Q1, Edgewater too posts a correction. The price per sq. ft. fell from $672 in Q1 last year to $590 this year. Following suit, the median sales price also dropped significantly from $1,750,000 last year to $1,275,000 this Q1 (fig. 6).
A look at the five-year snapshot of quarterly prices per sq. ft. below (fig. 8) further reveals that prices are trending in the mid ranges for the neighborhood.
Edgewater Quarterly Price per Sq. Ft. 2016-2020 - Fig. 8
Days on Market Down YoY for Luxury Condos in Edgewater
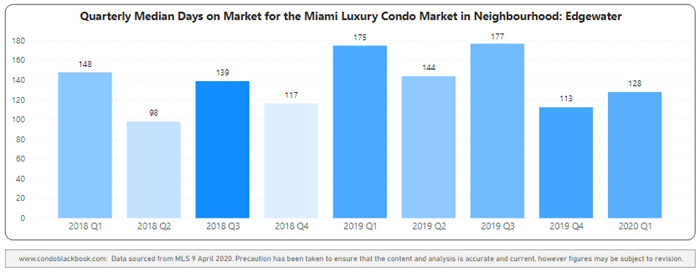
26.9% drop in year-over-year days on market. Moving with the overall market trend in Miami, luxury condos in Edgewater spent 47 fewer days on market (median) compared to Q1 2019 (fig. 6). This is a positive indication for the sub-neighborhood, showing that buyers and sellers found it significantly easier to reach a consensus a year on.
Edgewater Quarterly Days on Market 2018-2020 Heatmap – Fig. 9
Edgewater Inventory Declines but Still Highest in Miami
Inventory down to 76 months. Consistent with the overall market trend for luxury condos in Miami, inventory in Edgewater continues to decline in the first quarter of 2020. The metric is down 10.6% compared to March last year, and also slightly lower than December’s closing of 77 months (fig. 5).
Considering that 76 months is way higher than the 9-12-month benchmark of an ideal market, buyers have the luxury of time to wait for opportunity. It is also worth noting that Edgewater still has the heaviest inventory of all the Miami neighborhoods part of our study. To make the most of the opportunity created by lower prices and high levels of inventory, you can begin with a search of Edgewater condos for sale here.
Edgewater Months of Inventory from Mar. 2019 to Mar 2020 - Fig. 10
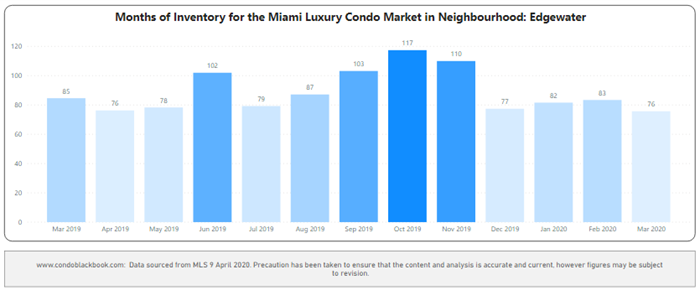
A balanced market has only 9-12 months of inventory. The months of inventory are calculated as – no. of active listings + no. of pending listings divided by the average number of deals in the last 6 months.
Greater Downtown Miami Neighborhoods: Brickell Market Trends (33129, 33130 and 33131)
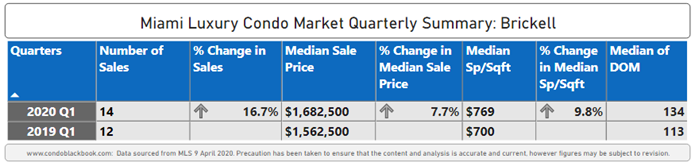
1Q20 Brickell Luxury Condo Market Summary - Fig. 11
Luxury Condo Sales Up YoY in Brickell
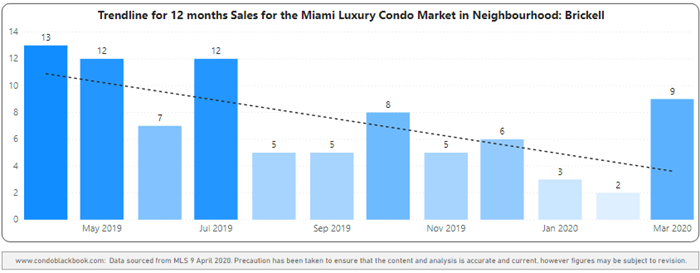
16.7% uptick in year-over-year sales with negative trendline. Going against the overall market trend in Miami of lower sales for Q1, Brickell posts a 16.7% uptick in year-over-year numbers (fig. 11). Starting the year on a strong note, this is the best first quarter for the sub-neighborhood in three years (fig. 12.1). This boost also makes it the biggest contributor to the sales increase seen in the collective Greater Downtown grouping above (fig. 2.1).
However, even with good sales numbers, the 12-month trendline goes from flat in the previous quarter (Q4 2019) to negative this quarter due to the exceptionally high sales of Q2 2019 (fig. 12.2), and very low sales in January and February.
Brickell Quarterly Sales Heatmap 2015 - 2020 - Fig. 12.1
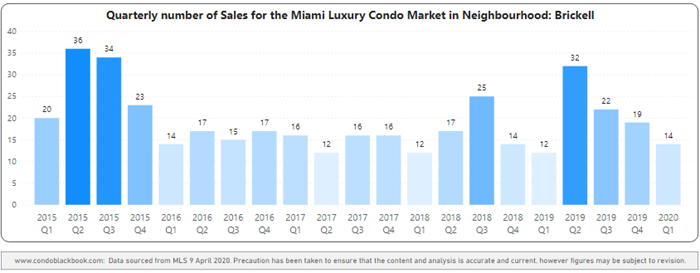
Brickell 12-Month Sales with Trendline - Fig. 12.2
Luxury Condo Price/Sq. Ft. Up to Highest Since 2016
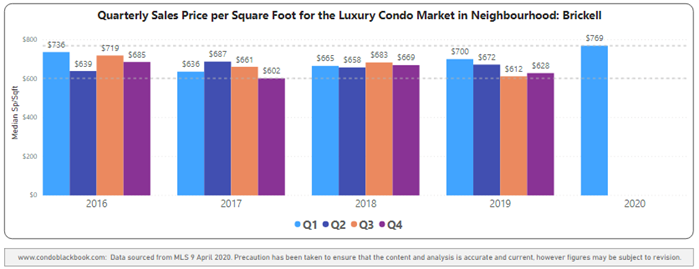
Price/sq. ft. increases 9.8% to $769, median price also jumps 16.7% year-over-year. Moving against the overall market trend of declining prices in Miami, the price per sq. ft. in Brickell jumps from $700 in Q1 2019 and $628 in the previous quarter to $769 in Q1 this year. Following suit, the median sales price also went up from $1,562,500 last year to $1,682,500 this Q1 (fig. 13).
A look at the five-year snapshot of quarterly prices per sq. ft. below (fig. 13) reveals that prices closed at their highest for the entire period under review in Brickell since 2016.
Brickell Quarterly Price per Sq. Ft. 2016-2020 - Fig. 13
Days on Market Up YoY for Brickell’s Luxury Condos
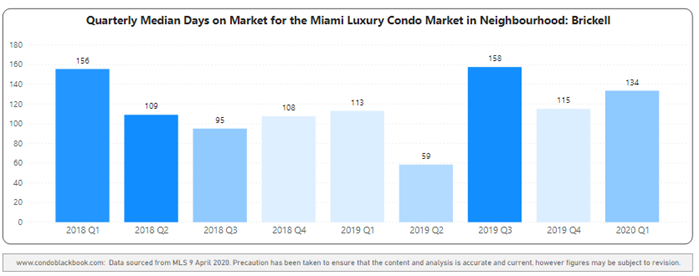
18.6% increase in year-over-year days on market. Going against the overall market trend in Miami, luxury condos in Brickell spent 21 extra days on the market compared to the same quarter last year (fig. 11). On a quarter-to-quarter basis Brickell’s luxury condos also spent 19 more days on market, increasing from 115 in Q4 2019 to 134 in Q1 2020 (fig. 14). This negative trend shows a slowdown in buyer-seller dialogue in the sub-neighborhood, where both parties could not seem to reach a consensus sooner.
Brickell Quarterly Median Days on Market 2018 – 2020 Heatmap - Fig. 14
Higher Quarter-end Inventory Keeps Brickell Buyer-friendly
Inventory down to 68 months. Much like the overall market trend in Miami, Brickell reports a 26.9% decline in its year-over-year inventory. However, a closer look at fig. 15 reveals that inventory spiked in February before settling down at 68 months, which is still 25.9% higher than December’s closing.
This makes Brickell one of only three neighborhoods in our study - including Sunny Isles Beach and Fisher Island - to report a significant increase in quarter-over-quarter numbers. This takes levels further away from reaching the 9-12-month benchmark of a balanced market. This also puts buyers in a good bargaining position with plenty of choices at hand for a longer time in the sub-neighborhood. To search available Brickell condos for sale, click here.
Brickell Months of Inventory from Mar. 2017 to Mar. 2020 - Fig. 15
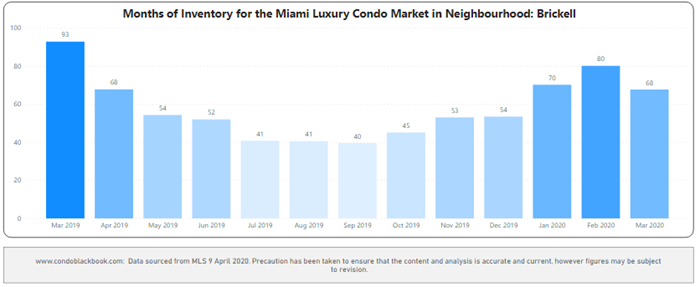
A balanced market has only 9-12 months of inventory. The months of inventory are calculated as – no. of active listings + no. of pending listings divided by the average number of deals in the last 6 months.
Conclusion
On the whole, this Greater Downtown grouping (inclusive of Edgewater and Brickell) shows mixed results compared to the overall market trends in Miami. Greater Downtown, with its boost from higher sales in Brickell, posts an increase in year-over-year numbers, whereas the overall market reports a slight decline. Also, while the price per sq. ft. stays flat just like the overall market trend in Miami, the sales prices for Greater Downtown keep flat against a decline noted in overall trends. In fact, Brickell deviates completely with a spike in its price per sq. ft., taking it to the highest it had been since 2016.
Besides the metrics mentioned above, the rest of Greater Downtown moves in the same direction as the trends noted in the overall Miami luxury condo market report for Q1. The year-over-year days on market plus months of inventory reduce year-over-year, just like the overall market. Also, the 12-month trendline goes negative in Greater Downtown Miami, following the same course as the overall market.
Historically, Greater Downtown has been the grouping with the heaviest amount of inventory of all the neighborhoods part of our study. The trend continues into Q1 2020, with Edgewater posting the highest levels in all of Miami. This keeps the market buyer-friendly, just like it is for the rest of Miami.
Further, in our overall analysis, we’ve mentioned that the full impact of the COVID-19 outbreak has yet to be seen, and may be more clear in the next quarter. Also, this being a presidential election year, the current buyer-friendly cycle is most likely to find an extension, delaying any sort of corrective shift. This simply means that buyers will get to enjoy the upper hand in negotiations and have plenty of choices (especially in a market like Edgewater) going through 2020, and even moving into early next year.
Love what you see? Don’t forget to share our blog and subscribe (see the subscribe link on the top menu) to receive the latest market news in your inbox.
Questions or comments about the stats? Interested in browsing the market? Contact Sep at sniakan (at) hbroswell.com or call 305-725-0566.
Cover photo courtesy of Diana Robinson
Share your thoughts with us

Your Miami Condo Awaits
Recent Posts


 (305) 697-7667
 (786) 321-7233
  contact@condoblackbook.com

