


Record Sales Year, Downtown & Brickell Led 2022 Market Growth
Reporting its biggest year of sales yet, the Greater Downtown Miami area remained the neighborhood of choice for luxury condo buyers throughout 2022. Downtown Miami and Brickell continued to be the most popular neighborhoods in all of Miami, leading sales growth in Q4 2022, as well as on an annual basis - outperforming the traditionally popular beach neighborhoods.
Compared to the overall Miami annual market trends noted in 2022, Greater Downtown Miami reported stronger sales across the board. Prices in the area also ended the year on a high note, with pricing statistics showing that favorable market conditions and the construction of new, more luxurious condominiums could keep prices stable or even push them higher in the next 2-3 years.
Even with sales slowing down over the last two quarter, the Days on Market values declined consistently in Greater Downtown Miami – showing great buyer-seller communication. The Months of Inventory may have spiked over the last quarter of the year, but we, as real estate experts, expect the statistical trend to correct during high season 2023.
A quick summary of Q4 2022 for the Greater Downtown Miami area includes:
- Brickell had the most sales volume (52 sales)
- Downtown Miami had the greatest sales growth YoY (22%)
- Edgewater posted the highest median sales price ($1.5 million)
- Edgewater posted the highest price per square foot ($942)
Read further for our exclusive and in-depth analysis and statistics on how Greater Downtown, Edgewater, Brickell, and Downtown Miami performed in Q4 2022, along with a detailed comparison to the annual trends of 2022 and overall Miami luxury condo trends in terms of sales, prices, days on market, and inventory.
For this report, we've only included areas with zipcodes 33129, 33130, 33131, 33132, 33137 – essentially Brickell Hammock, Brickell, Brickell Key, Downtown Miami, Arts & Entertainment District, Edgewater, Wynwood, Midtown and the Design District. This luxury condo market report only features properties priced $1 million and above, and generally does not include pre-construction condo sales.
Overall Greater Downtown Miami Luxury Condo Markets at a Glance - Q4 2022 YoY Median Sales Price
Overall Greater Downtown Miami Luxury Condo Markets at a Glance - Q4 2022 YoY Median Price/SqFt
Key Q4 and 2022 Housing Market Stats: Greater Downtown Miami, Brickell & Edgewater
2022 Annual Greater Downtown Miami Luxury Condo Market Highlights
- Annual Sales up 24.1% against 2021 - biggest sales year ever
- Winners: Downtown Miami (27%) and Brickell (25%) top popularity charts - lead annual sales growth in Greater Downtown as well as Miami overall
- Annual Price per Square Foot up 11% to $825 in YoY analysis
- Winner: Edgewater leads price growth in Greater Downtown with highest percentage gains in Price per Square Foot (20%) – offering maximum value to sellers
- Winner: Edgewater was the most expensive neighborhood of 2022 with a median price of $878/sq. ft.
- Annual Days on Market down -29% in 2022-over-2021 analysis
- 2022 technically closed as buyer's market in Greater Downtown, but to be read as a balanced market
Q4 2022 - Greater Downtown Miami Luxury Condo Market Highlights
- Sales down -33.1% year-over-year - still highest of any fourth quarter sales noted 2015-2020
- 12-month sales trendline stays negative between Q3 and Q4 2022
- At $839, Price per Square Foot up to highest ever
- Days on Market down -13.4% year-over-year
- Inventory up to 17 months
Q4 2022 - Greater Downtown Miami Sub-neighborhood Highlights
- Winners: Downtown Miami (22%) tops popularity charts, leading quarterly sales growth in Greater Downtown and Miami overall
- 12-month sales trendline negative across the board
- Winner: Edgewater reports highest percentage growth in year-over-year price per sq. ft. (28%) in Greater Downtown
- Winner: Edgewater was the most expensive neighborhood of Q4 2022 with a median price of $942/sq. ft.
- Downtown Miami posts the biggest percentage decline (33%) in Days on Market in Greater Downtown
- Brickell again reports the lowest year-end inventory (15 months) in Greater Downtown and second-lowest in Miami overall
Overall Greater Downtown Miami Luxury Condo Markets at a Glance - Q4 2022 YoY Total Sales
Table of Contents
- Greater Downtown Miami Luxury Condo Sales Trends
- Greater Downtown Miami Luxury Condo Price Trends
- Greater Downtown Miami Luxury Condo Days on Market Trends
- Greater Downtown Miami Luxury Condo Inventory Trends
- Edgewater - Overall Sales
- Edgewater - Sales Price, Price/Square Foot
- Edgewater - Days on Market
- Edgewater - Inventory
- Brickell - Overall Sales
- Brickell - Sales Price, Price/Square Foot
- Brickell - Days on Market
- Brickell - Inventory
- Downtown Miami - Overall Sales
- Downtown Miami - Sales Price, Price/Square Foot
- Downtown Miami - Days on Market
- Downtown Miami - Inventory
- Q4 2022 Greater Downtown Miami Luxury Condo Market Report - Conclusion
|
Q4 2022 vs Q3 2022 Greater Downtown Miami Luxury Condo Market Summary - Fig. 1 |
|||||||
|
Quarters |
Number of Sales |
% change in Sales |
Median Sale Price |
% change in Median Sale Price |
Median Sp/Sqft |
% change in Median Sp/Sqft |
Median of DOM |
|
Q4-2022 |
89 |
-16.8% |
$1,350,000 |
1.5% |
$839 |
1.2% |
58 |
|
Q3-2022 |
107 |
$1,330,000 |
$828 |
56 |
|||
|
Q4 2022 vs Q4 2021 Greater Downtown Miami Luxury Condo Market Summary - Fig. 1.1 |
|||||||
|
Quarters |
Number of Sales |
% change in Sales |
Median Sale Price |
% change in Median Sale Price |
Median Sp/Sqft |
% change in Median Sp/Sqft |
Median of DOM |
|
Q4-2022 |
89 |
-33.1% |
$1,350,000 |
-3.6% |
$839 |
9.5% |
58 |
|
Q4-2021 |
133 |
$1,400,000 |
$766 |
67 |
|||
|
Annual 2022-over-2021 Greater Downtown Miami Luxury Condo Market Summary - Fig. 1a |
|||||||
|
Year |
Number of Sales |
% change in Sales |
Median Sale Price |
% change in Median Sale Price |
Median Sp/Sqft |
% change in Median Sp/Sqft |
Median of DOM |
|
2022 |
644 |
24.1% |
$1,399,500 |
0.7% |
$825 |
11.1% |
63 |
|
2021 |
519 |
$1,390,000 |
$743 |
89 |
|||
— Greater Downtown Miami Luxury Condo Market Trends: Annual Sales Up, 4Q Down
Q4 Sales down 33.1% year-over-year. Highest-ever of a pre-pandemic 4Q.
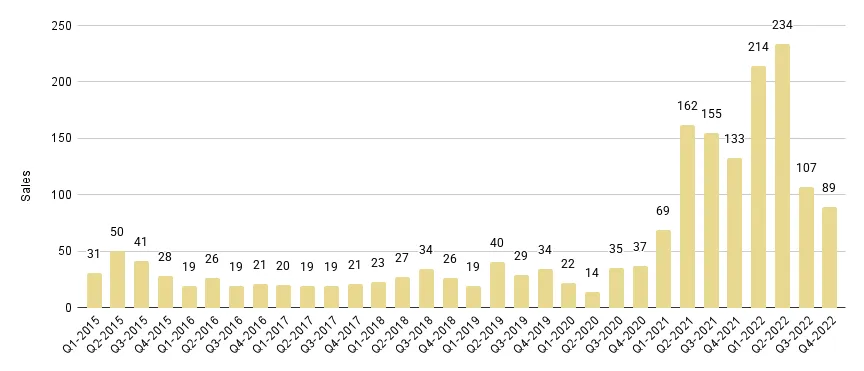
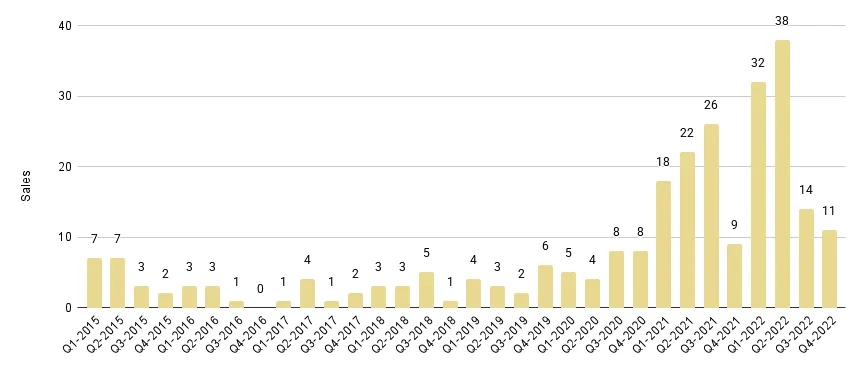
Following and contributing to the sales trend seen in the overall Miami report for Q4 2022, the Greater Downtown Miami area posted a decline in year-over-year sales but with a bright side (Fig. 2.1):
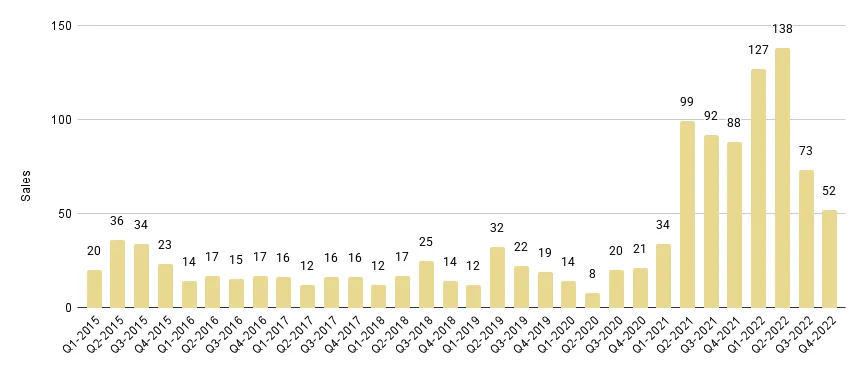
- Q4 2022 sales volumes were higher than any previous fourth quarter noted pre-pandemic (years 2020 and prior)
- Q4 2022 vs Q4 2021. Sales declined -33.1% year-over-year, down from 133 in Q4 2021 to 89 for the same quarter 2022. (Fig. 1.1)
- Brickell was the highest contributor in terms of volume (52 sales), while Downtown Miami was the highest percentage contributor (22% YoY) to the sales growth seen in Greater Downtown.
- Q4 2022 vs Q3 2022. Sales decreased -16.8% quarter-over-quarter, down from 107 in the previous quarter to 89 in Q4 2022. (Fig. 1)
- Even with a seasonal slowdown (as per historical data, sales are known to be cyclical in Miami – peaking around Q2 and slowing down over Q3 & Q4) plus talks of a national housing cooldown, this urban core closed the year on a relatively positive note.
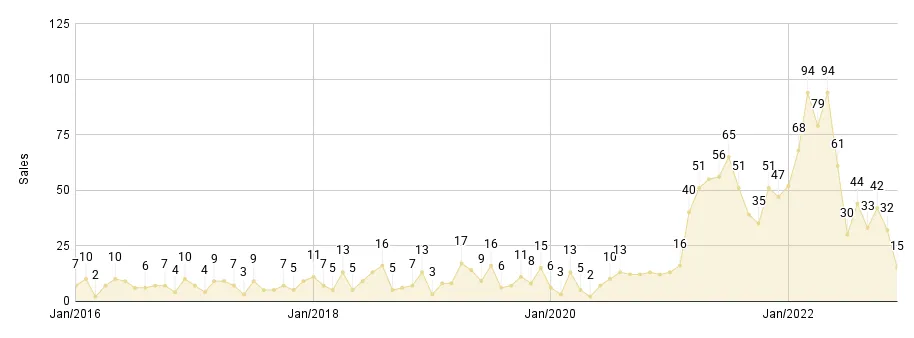
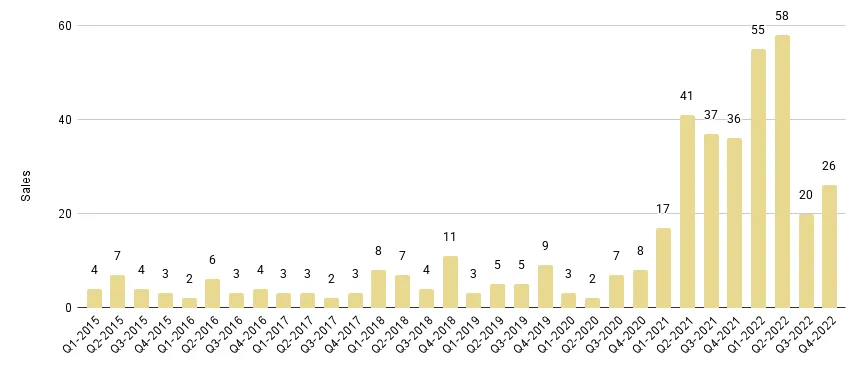
Annual Sales up 24.1% - Biggest sales year ever - Negative trendline
While Miami's more traditionally popular market, the beaches, posted a decline in 2022-over-2021 annual sales, heavily influencing the overall market trend, Miami's urban core enjoyed consistent sales growth:
- 2022 vs 2021. Sales increased 24.1%, up from 519 annual sales in record-setting year like 2021 to 644 in 2022. (Fig. 1a)
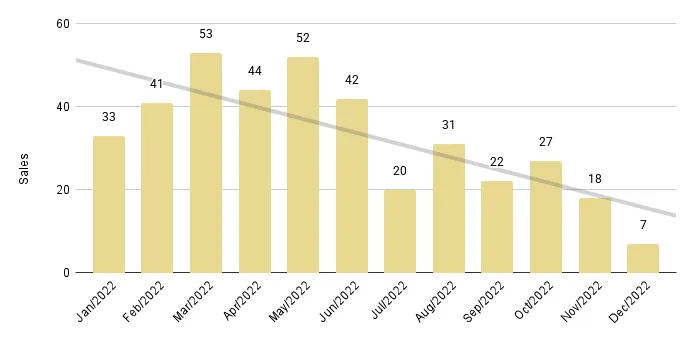
- Posting its biggest sales year yet, Greater Downtown Miami also reported higher annual sales compared to 2020 (108 total sales), 2019 (122 total sales), 2018 (110 total sales), and before. (Fig. 2.1)
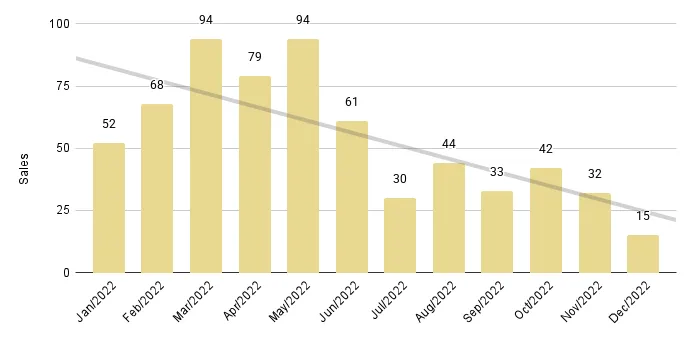
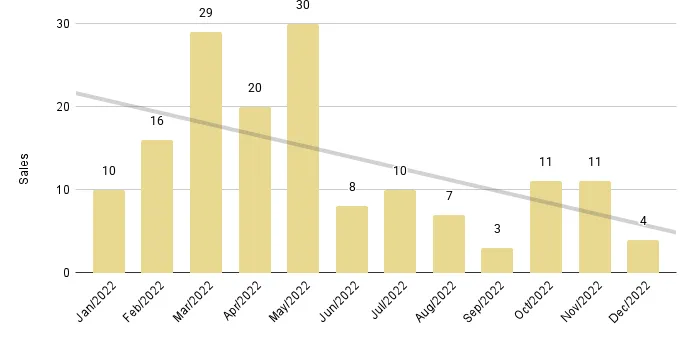
With the market cooling further before heading into high season of 2023 (summer is usually Miami's peak season as per historical data), the 12-month Sales Trendline of Fig. 2.3 expectedly stayed negative between Q3 and Q4 2022.
Greater Downtown Miami Luxury Condo Quarterly Sales 2015 - 2022 - Fig. 2.1
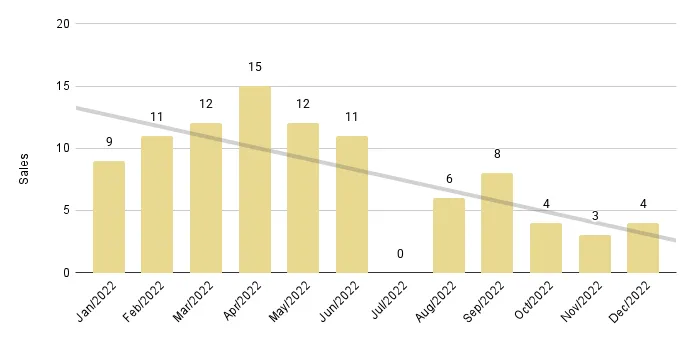
Greater Downtown Miami Luxury Condo Monthly Sales from Jan. 2016 to Dec 2022 - Fig. 2.2
Greater Downtown Miami Luxury Condo 12-Month Sales with Trendline - Fig. 2.3
— Greater Downtown Miami Luxury Condo Price Trends: Mixed
Annual $/Square Foot up to $825, Median Sales Price flat
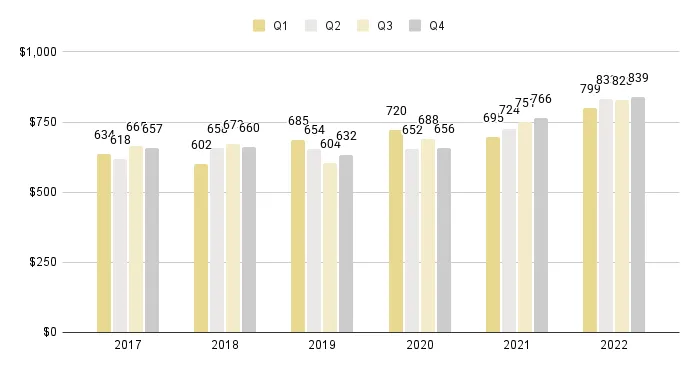
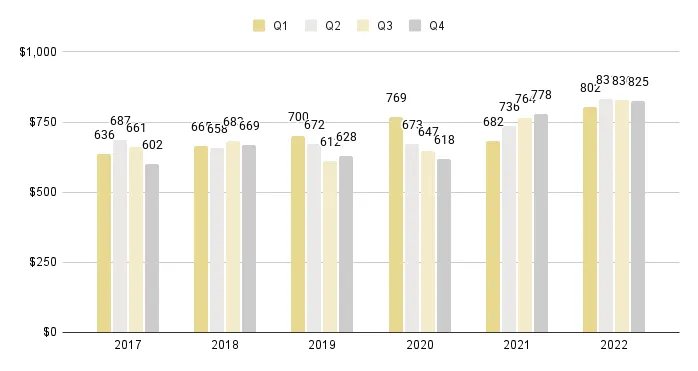
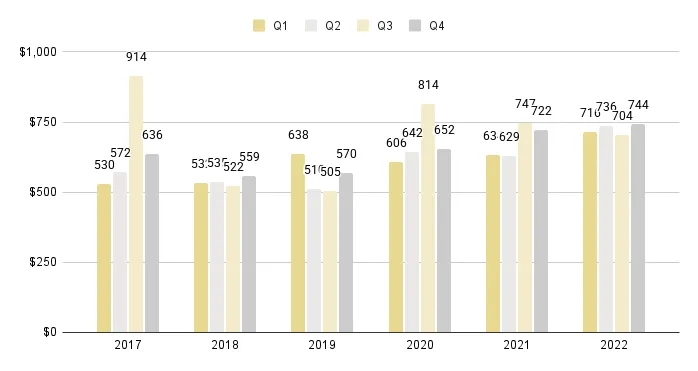
Consistent with the overall market trend of higher 2022-over-2021 price per square foot and flat Median Price, luxury condos in Greater Downtown Miami reported the following annual trends (Fig. 1.a):
- Price per Square Foot increased 11.1%, up from $743 in 2021 to $825 in 2022.
- Median Sales Price stayed mostly flat, reporting a marginal adjustment of 0.7%, up from $1,390,000 in 2021 to $1,399,000 in 2022.
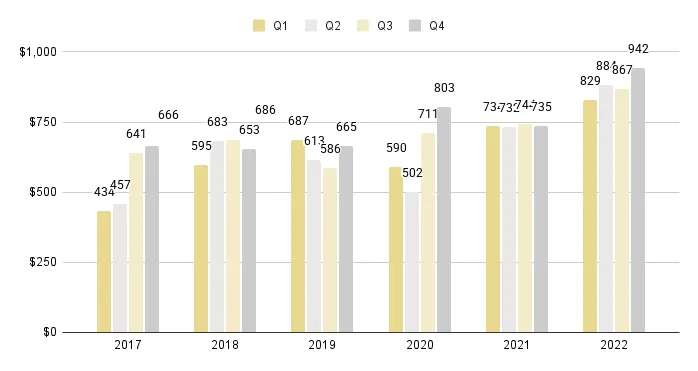
Q4 2022 Price/Square Foot up 9.5% to peak at $839, Median Sales Price down year-over-year
Echoing the overall market trend of higher year-over-year price per square foot and lower Median Price, this mainland grouping reported the following quarterly trends (Fig. 1.1):
- Q4 2022 vs Q4 2021. Price per Square Foot increased by 9.5%, up from $766 in Q4 2021 to $839 in Q4 this year.
- Closing the year with the highest Price per Square Foot ever (Fig. 3), sellers received excellent value for their luxury condos in Greater Downtown Miami.
- Median Sales Price decreased 3.6%, down from $1,400,000 in Q4 2021 to $1,350,000 in the same quarter 2022.
- This difference in Price per Square Foot and Median Sales Price trends could possibly be due to sales of smaller luxury condos exceeding sales of bigger units in the fourth quarter. Such smaller-sized condos tend to pack in more amenities, for which they command a higher price per square foot even as the median price declines.
- Q4 2022 vs Q3 2022. Price per Square Foot mostly flat, reporting an adjustment of 1.2%, slightly up from $828 in the previous quarter to $839 in Q4 2022.
- Median Sales Price too stayed mostly flat, reporting an adjustment of 1.5%, slightly up from $1,330,000 in the previous quarter to $1,350,000 in Q4 2022. (Fig. 1)
Greater Downtown Miami Luxury Condo Quarterly Price per Sq. Ft. 2017-2022 - Fig. 3
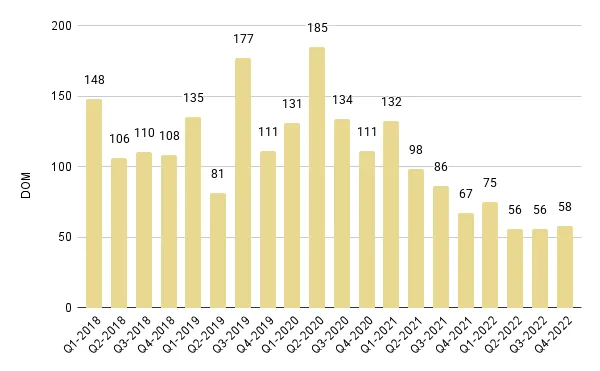
— Greater Downtown Miami: Days on Market Down Annually + YoY
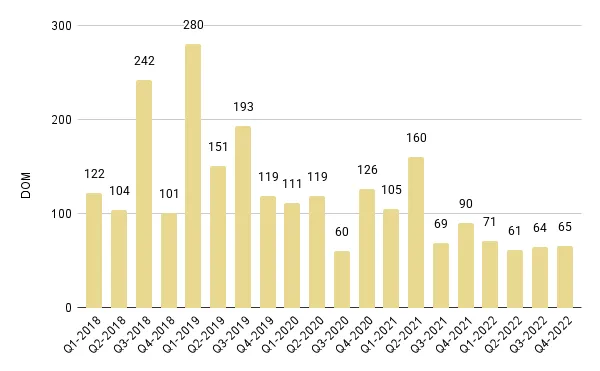
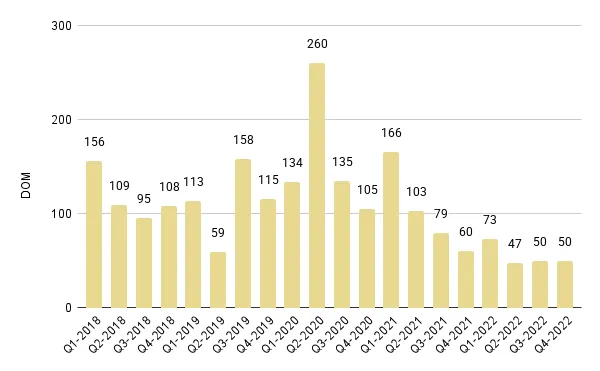
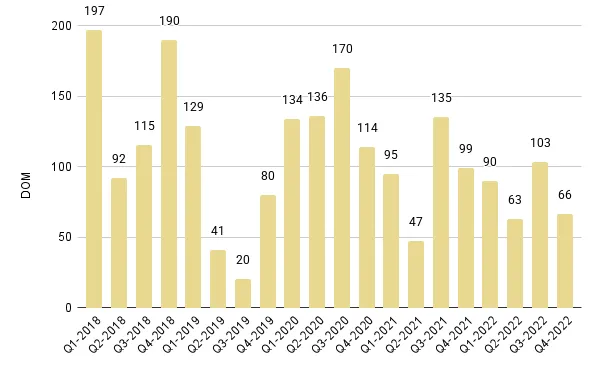
Days on Market down 29.2% on annual basis and 13.4% 4Q22-over-4Q21
Owing to positive market momentum in this urban core, the Days on Market (DOM) reduced as expected, as well as in line with the overall Miami luxury condo market trend:
- 2022 vs 2021. Days on Market declined 29.2%, with luxury condos spending 26 fewer days on the market compared to 2021. (Fig. 1a)
- Q4 2022 vs Q4 2021. Days on Market declined 13.4%, indicating luxury condos spent 9 fewer days on market compared to a year-ago - closing 2022 with one of the lowest DOM in over 5 years (Fig. 4).
Greater Downtown Miami Luxury Condo Quarterly Days on Market 2018 - 2022 – Fig. 4
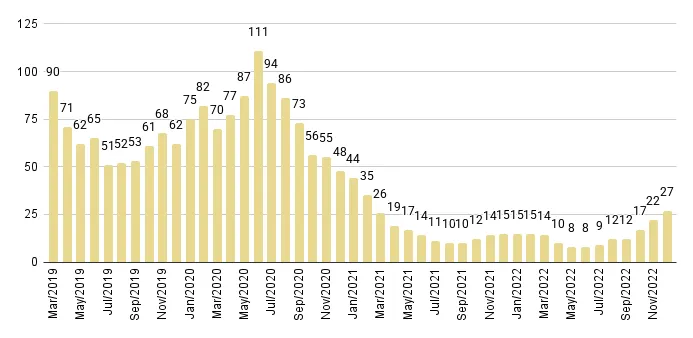
— Greater Downtown Miami: Luxury Condo Inventory Up – Moving to Balanced Market
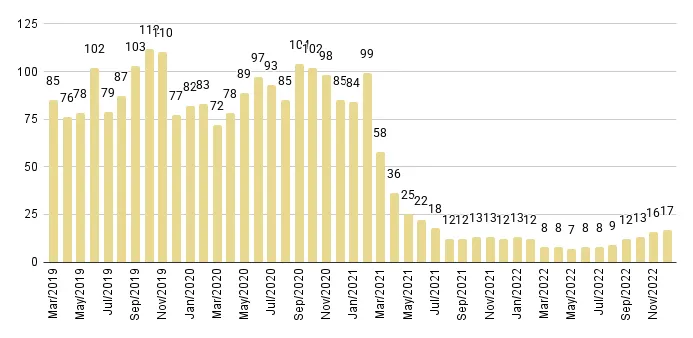
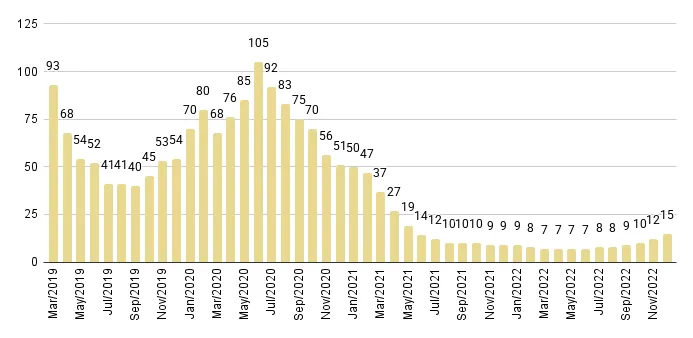
Q4 2022 closes with 17 months of Inventory
With inventory touching new lows throughout 2022, it was quite expected to see a bit of an uptick, as the last two quarters of 2022 slowed down after experiencing about 8 quarters of frenzied sales. Closing the year with 17 months of inventory, the trend closed above the 9-12-month range of an ideal market, suggesting a shift into a buyer's market – in theory.
Considering peak season is just around the corner, as mentioned earlier in this report, we, as real estate experts, are expecting this excessive inventory situation to quickly correct itself, settling into a more balanced mood heading into 2023:
- On an annual basis, inventory was up from 11 months in December last year to 17 months by year-end 2022 – an uptick of 54.5%. (Fig. 5)
- On a quarter-over-quarter basis, inventory increased from 10 months in September 2022 to 17 months in December – again posting an uptick of 70%.
Those interested in buying into Miami's urban core can search the Greater Downtown Miami area for available condos for sale.
Greater Downtown Miami Luxury Condo Months of Inventory from Mar. 2019 to Dec 2022 - Fig. 5
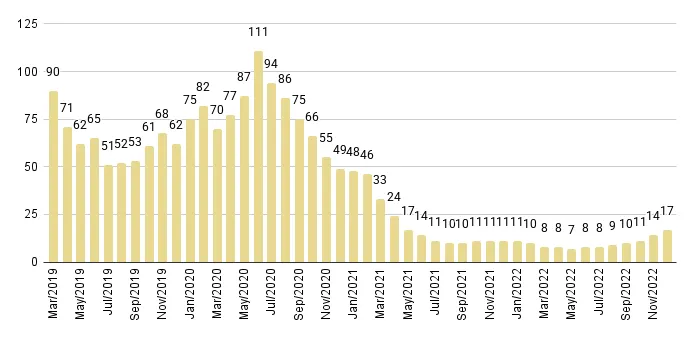
A balanced market has only 9-12 months of inventory. The months of inventory are calculated as – no. of active listings + no. of pending listings divided by the average number of deals in the last 6 months.
— Greater Downtown Miami Neighborhoods: Edgewater Market Trends (33132 and 33137)
|
Q4 2022 vs Q3 2022 Edgewater Luxury Condo Market Summary - Fig. 6 |
|||||||
|
Quarters |
Number of Sales |
% change in Sales |
Median Sale Price |
% change in Median Sale Price |
Median Sp/Sqft |
% change in Median Sp/Sqft |
Median of DOM |
|
Q4-2022 |
26 |
30.0% |
$1,510,000 |
11.4% |
$942 |
8.7% |
65 |
|
Q3-2022 |
20 |
$1,355,000 |
$867 |
64 |
|||
|
Q4 2022 vs Q4 2021 Edgewater Luxury Condo Market Summary – Fig. 6.1 |
|||||||
|
Quarters |
Number of Sales |
% change in Sales |
Median Sale Price |
% change in Median Sale Price |
Median Sp/Sqft |
% change in Median Sp/Sqft |
Median of DOM |
|
Q4-2022 |
26 |
-27.8% |
$1,510,000 |
17.5% |
$942 |
28.2% |
65 |
|
Q4-2021 |
36 |
$1,285,000 |
$735 |
90 |
|||
|
2022-over-2021 Edgewater Luxury Condo Annual Market Summary - Fig. 6a |
|||||||
|
Year |
Number of Sales |
% change in Sales |
Median Sale Price |
% change in Median Sale Price |
Median Sp/Sqft |
% change in Median Sp/Sqft |
Median of DOM |
|
2022 |
159 |
21.4% |
$1,499,000 |
12.7% |
$878 |
19.6% |
67 |
|
2021 |
131 |
$1,330,000 |
$734 |
105 |
|||
— Edgewater Luxury Condo Annual Sales Up 20%, Down in 4Q
Q4 Sales down -27.8% year-over-year; Yet highest in a 4th Quarter (2020 and prior)
In keeping with the overall Miami market trend for Q4 2022, Edgewater posted a decline in quarterly year-over-year sales, but with a very positive outlook on an annual basis:
- Q4 2022 vs Q4 2021. Sales declined -27.8% year-over-year, down from 36 in Q4 2021 to 26 for the same quarter 2022. (Fig. 6.1)
- However, Sales in Q4 2022 were higher than any previous fourth quarter recorded in 2020 or before. (Fig. 7.1)
- Q4 2022 vs Q3 2022. Sales increased 30% quarter-over-quarter, up from 20 in Q3 2022 to 26 in Q4 2022. (Fig. 6)
Annual Sales up 21.4% - Highest annual sales ever - Negative trendline
Even with a seasonal slowdown taking over the second half of the year, Edgewater reported impressive sales growth in 2022. Moving against the overall Miami market trend for sales, Edgewater reported:
- 2022 vs 2021. Sales increased 21.4%, up from 131 annual sales in the record-setting 2021 to an even more impressive total of 159 sales in 2022. (Fig. 6a)
- With the highest annual sales ever, Edgewater outperformed all previous years on record – 2021 (131 annual sales), 2020 (20 annual sales), 2019 (22 annual sales), 2018 (30 annual sales), and before. (Fig. 7.1)
With a slower-paced second half, the 12-month Sales Trendline of Fig. 7.2 expectedly stayed negative between Q3 and Q4 2022.
Edgewater Luxury Condo Quarterly Sales 2015 - 2022 - Fig. 7.1
Edgewater Luxury Condo 12-Month Sales Trendline - Fig. 7.2
— Edgewater Luxury Condo Price Trends: Most Expensive in Greater Downtown, Leading Price Growth
Annual $/Square Foot up 19.6% to $878, Median Sales Price also up
Partly in line with the overall market trend of higher year-over-year annual price per square foot and flat Median Price, luxury condos in Edgewater reported the following increases (Fig. 6a):
- Price per Square Foot increased 19.6%, up from $734 in 2021 to $878 in 2022.
- Median Sales Price also increased 12.7%, up from $1,330,000 in 2021 to $1,499,000 in 2022.
- Leading price growth in the Greater Downtown area, Edgewater reported the highest percentage gain in Price per Square Foot – giving sellers maximum value for their luxury condos.
- Edgewater closed 2022 as the most expensive neighborhood of Greater Downtown, with a median Price Per Square Foot of $878.
Q4 2022 $/Square Foot up 28.2% to peak of $942, Median Sales Price also up year-over-year
Deviating from the overall Miami market trend of higher year-over-year Price per Square Foot and lower Median Price in Q4, Edgewater reported an increase in both (Fig. 6.1):
- Q4 2022 vs Q4 2021. Price per Square Foot increased by 28.2%, up from $735 in Q4 last year to $942 in Q4 this year.
- With the Price per Square Foot peaking to an all-time high, sellers received excellent value for their luxury condos in Edgewater. (Fig. 8)
- Edgewater led Q4 2022 price growth trends in Greater Downtown, reporting the highest percentage growth in year-over-year price per sq. ft.
- Edgewater emerged as the most expensive market for luxury condos in Greater Downtown in Q4 2022 with its price of $942/SF.
- Median Sales Price also increased 17.5%, up from $1,285,000 in Q4 of the previous year to $1,510,000 in Q4 2022.
- Q4 2022 vs Q3 2022. Price per Square Foot increased by 8.7%, up from $867 in Q3 2022 to $942 in Q4 this year. (Fig. 6)
- Median Sales Price too increased 11.4%, up from $1,355,000 in Q3 2022 to $1,510,000 in Q4 2022.
Edgewater Luxury Condo Quarterly Price per Sq. Ft. 2017-2022 - Fig. 8
— Edgewater Days on Market: Down Annually + YoY in 4Q 2022
Days on Market down 36.2% on annual basis and 27.8% 4Q22-over-4Q21
With the market mostly keeping its pace in this bayfront neighborhood, Edgewater reported a decline in annual as well as year-over-year Days on Market, much in line with the overall Miami luxury condo market trend:
- 2022 vs 2021. Days on Market declined 36.2%, with luxury condos spending 38 fewer days on the market compared to 2022. (Fig. 6a)
- Q4 2022 vs Q4 2021. Days on Market declined 27.8%, showing luxury condos spent 25 fewer days on market compared to a year-ago. (Fig. 9)
Edgewater Luxury Condo Quarterly Days on Market 2018-2022 – Fig. 9
— Edgewater Luxury Condo Inventory: Up YoY– Buyer-Seller Equilibrium
Q4 closes with 17 months of Inventory
Consistent with the overall market trend in Miami, luxury condo inventory in Edgewater increased quarter-over-quarter as well as year-over-year by year-end 2022. At 17 months, inventory closed above the 9-12-month mark of a balanced market – although indicating a buyer's market on paper, but actually closing with level playing field for buyers and sellers.
- On an annual basis, inventory was up from 12 months in December 2021 to 17 months by year-end 2022 – an increase of 41.6%. (Fig. 10)
- On a quarter-over-quarter basis, inventory increased from 12 months in September 2022 to 17 months in December – again posting an increase of 41.6%.
As a top seller's brokerage and agent in Edgewater, we can provide a free evaluation of your luxury condo and position it to attract competitive offers. You can call, chat, or e-mail us and an expert, local real estate expert will help you.
Edgewater Luxury Condo Months of Inventory from Mar. 2019 to Dec 2022 - Fig. 10
A balanced market has only 9-12 months of inventory. The months of inventory are calculated as – no. of active listings + no. of pending listings divided by the average number of deals in the last 6 months.
— Greater Downtown Miami Neighborhoods: Brickell Market Trends (33129, 33130 and 33131)
|
Q4 2022 vs Q3 2022 Brickell Luxury Condo Market Summary - Fig. 11 |
|||||||
|
Quarters |
Number of Sales |
% change in Sales |
Median Sale Price |
% change in Median Sale Price |
Median Sp/Sqft |
% change in Median Sp/Sqft |
Median of DOM |
|
Q4-2022 |
52 |
-28.8% |
$1,365,000 |
2.6% |
$825 |
-0.6% |
50 |
|
Q3-2022 |
73 |
$1,330,000 |
$830 |
50 |
|||
|
Q4 2022 vs Q4 2021 Brickell Luxury Condo Market Summary - Fig. 11.1 |
|||||||
|
Quarters |
Number of Sales |
% change in Sales |
Median Sale Price |
% change in Median Sale Price |
Median Sp/Sqft |
% change in Median Sp/Sqft |
Median of DOM |
|
Q4-2022 |
52 |
-40.9% |
$1,365,000 |
-9.8% |
$825 |
6.0% |
50 |
|
Q4-2021 |
88 |
$1,512,500 |
$778 |
60 |
|||
|
Annual 2022-over-2021 Brickell Luxury Condo Market Summary - Fig. 11a |
|||||||
|
Year |
Number of Sales |
% change in Sales |
Median Sale Price |
% change in Median Sale Price |
Median Sp/Sqft |
% change in Median Sp/Sqft |
Median of DOM |
|
2022 |
390 |
24.6% |
$1,377,500 |
-3.3% |
$824 |
10.0% |
56 |
|
2021 |
313 |
$1,425,000 |
$749 |
84 |
|||
— Brickell Luxury Condo Sales Up Annually + Down 4Q 2022 – 2nd-highest Annual Sales Growth in Miami Overall
Q4 Sales down -40.9% year-over-year – Highest in a 4th quarter (2020 & prior)
In line with the overall Miami market trend for Q4 2022, Brickell saw a decline in year-over-year sales, but with an upside:
- Q4 2022 vs Q4 2021. Sales declined -40.9% year-over-year, down from 88 in Q4 a year-ago to 52 in the same quarter 2022. (Fig. 11.1)
- However, Q4 2022 sales were higher compared to any previous fourth quarter recorded pre-pandemic (2020 and before). (Fig. 12.1)
- Q4 2022 vs Q3 2022. Sales decreased -28.8% quarter-over-quarter, down from 73 in Q3 2022 to 52 in Q4 2022. (Fig. 11)
Annual Sales up 24.6% - Highest-ever annual sales - Negative trendline
Even with a seasonal slowdown setting in during the last two quarters, Brickell reported remarkable sales growth in 2022. In contrast to the overall Miami market trend for lower year-over-year annual sales, Brickell reported:
- 2022 vs 2021. Sales increased 24.6%, up from 313 annual sales in the record-setting year of 2021 to an outstanding 390 sales in 2022. (Fig. 11a)
- Trailing right behind Downtown Miami (27%), Brickell reported the second-highest percentage sales growth of all the Miami neighborhoods under our review in 2022.
- Brickell outperformed all previous years on record by posting its highest annual sales ever – 2021 (313 annual sales), 2020 (63 annual sales), 2019 (85 annual sales), 2018 (68 annual sales), and before. (Fig. 12.1)
Brickell Luxury Condo Quarterly Sales 2015 - 2022 - Fig. 12.1
Owing to an expectedly slower-paced second half (as Miami's luxury condo market is cyclical in nature), the 12-month Sales Trendline of Fig. 12.2 stayed negative between Q3 and Q4 2022.
Brickell Luxury Condo 12-Month Sales with Trendline - Fig. 12.2
— Brickell Luxury Condo Price Trends: Mixed Annually + Q4 2022
Annual Price/Square Foot up 10% to $824, Median Sales Price down
Partly in line with the overall market trend of higher year-over-year annual price per square foot and flat Median Price, luxury condos in Brickell reported the following trends (Fig. 11a):
- Price per Square Foot increased 10%, up from $749 in 2021 to $824 in 2022.
- Median Sales Price decreased -3.3%, down from $1,425,000 in 2021 to $1,377,500 in 2022.
The inconsistency seen in Price per Square Foot and Sales Price trends above could possibly be due to sales of smaller (in size) condos with better amenities dominating the quarter. Such smaller units tend to command a higher price per square foot.
Q4 2022 Price per Square Foot up 6% to $825, Median Sales Price down year-over-year
In line with the overall Miami market trend of higher year-over-year Price per Square Foot and lower Median Price in Q4, Brickell reported the same (Fig. 11.1):
- Q4 2022 vs Q4 2021. Price per Square Foot increased by 6%, up from $778 in Q4 2021 to $825 in Q4 this year.
- Looking at the 5-year snapshot of quarterly prices per square foot below (Fig. 13), we found that prices in Brickell closed in the higher ranges for Q4 - giving sellers great value for their luxury condo investments.
- Median Sales Price decreased 9.8%, down from $1,512,500 in Q4 2021 to $1,365,000 in Q4 2022.
- Q4 2022 vs Q3 2022. Price per Square Foot mostly flat, with a slight adjustment of -0.6%, marginally down from $830 in Q3 2022 to $825 in Q4 this year. (Fig. 11)
- Median Sales Price also remained flat, posting an adjustment of 2.6%, slightly up from $1,330,000 in Q3 2022 to $1,365,000 in Q4 2022.
Brickell Luxury Condo Quarterly Price per Sq. Ft. 2017-2022 - Fig. 13
— Brickell Days on Market: Down Annually + YoY – Fastest-selling Market in Greater Downtown Miami
Days on Market down 33.3% on annual basis and 16.7% 4Q22-over-4Q21
Luxury condos in Brickell spent the least amount of time on market compared to the rest of Greater Downtown Miami, meaning they sold the fastest of any neighborhoods under review:
- 2022 vs 2021. Days on Market declined 33.3%, with luxury condos spending 28 fewer days on the market compared to 2022. (Fig. 11a)
- Q4 2022 vs Q4 2021. Days on Market declined 16.7%, showing luxury condos spent 10 fewer days on market compared to Q4 2021. (Fig. 11.1)
- Luxury condos in Brickell took less than 2 months (56 days) to sell in 2022 – emerging as the fastest-selling market of Greater Downtown Miami.
Brickell Luxury Condo Quarterly Median Days on Market 2018 – 2022 - Fig. 14
— Brickell Inventory Up YoY - Lowest in Greater Downtown Miami/2nd-lowest in Miami Overall
Q4 2022 Closed with 15 months of Inventory
In sync with the overall Miami market trend, luxury condo inventory in Brickell increased quarter-over-quarter as well as year-over-year by the end of 2022. At 15 months, inventory closed above the 9-12-month mark of an ideal market, but lower than Miami overall – bringing the luxury condo market into a more balanced position, even though it might appear buyer-friendly in theory.
- On an annual basis, inventory was up from 9 months in December 2021 to 15 months in December 2022 – a 66.7% increase. (Fig. 15)
- On a quarter-over-quarter basis, inventory increased from 9 months in September 2022 to 17 months in December – again reporting an increase of 66.7%.
- Brickell closed 2022 with the lowest year-end inventory in Greater Downtown and the second-lowest in Miami overall, right behind Coconut Grove & Coral Gables (13 months).
Brickell Luxury Condo Months of Inventory from Mar. 2019 to Dec 2022 - Fig. 15
A balanced market has only 9-12 months of inventory. The months of inventory are calculated as – no. of active listings + no. of pending listings divided by the average number of deals in the last 6 months.
— Greater Downtown Miami Neighborhoods: Downtown Miami Market Trends (33128, 33132 and 33136)
|
Q4 2022 vs Q3 2022 Downtown Miami Luxury Condo Market Summary - Fig. 15 |
|||||||
|
Quarters |
Number of Sales |
% change in Sales |
Median Sale Price |
% change in Median Sale Price |
Median Sp/Sqft |
% change in Median Sp/Sqft |
Median of DOM |
|
Q4-2022 |
11 |
-21.4% |
$1,160,000 |
-7.2% |
$744 |
5.7% |
66 |
|
Q3-2022 |
14 |
$1,250,000 |
$704 |
103 |
|||
|
Q4 2022 vs Q4 2021 Downtown Miami Luxury Condo Market Summary - Fig. 15.1 |
|||||||
|
Quarters |
Number of Sales |
% change in Sales |
Median Sale Price |
% change in Median Sale Price |
Median Sp/Sqft |
% change in Median Sp/Sqft |
Median of DOM |
|
Q4-2022 |
11 |
22.2% |
$1,160,000 |
-30.7% |
$744 |
3.1% |
66 |
|
Q4-2021 |
9 |
$1,675,000 |
$722 |
99 |
|||
|
Annual 2022-over-2021 Downtown Miami Luxury Condo Market Summary - Fig. 15a |
|||||||
|
Year |
Number of Sales |
% change in Sales |
Median Sale Price |
% change in Median Sale Price |
Median Sp/Sqft |
% change in Median Sp/Sqft |
Median of DOM |
|
2022 |
95 |
26.7% |
$1,360,000 |
-10.8% |
$724 |
7.5% |
81 |
|
2021 |
75 |
$1,525,000 |
$673 |
93 |
|||
— Downtown Miami Luxury Condo Sales Lead Annual + 4Q-22 Market Growth in Miami Overall
Q4 Sales up 22.2% year-over-year – Highest-ever in a Fourth Quarter
Deviating from the overall Miami market trend of lower year-over-year sales, Downtown Miami reported remarkable progress as the year came to a close for luxury condo sales:
- Q4 2022 vs Q4 2021. Sales increased 22.2% year-over-year, up from 9 in Q4 of the previous year to 11 in Q4 2022. (Fig. 15.1)
- Q4 2022 Sales were higher than any previous fourth quarter to date. (Fig. 16.1)
- Q4 2022 vs Q3 2022. Sales declined 21.4% quarter-over-quarter, down from 14 in Q3 2022 to 11 in Q4 2022. (Fig. 15)
- Downtown Miami emerged as the most popular Miami neighborhood in our quarterly study – leading the market as the only district to report positive sales growth in Q4 2022.
Annual Sales up 26.7% - Highest annual sales ever - Negative trendline
Even though market pace expectedly slowed down over the second half of 2022, Downtown Miami posted impressive sales growth, also leading the overall luxury condo market. Deviating from the overall Miami market trend of lower year-over-year annual sales, Downtown reported the following:
- 2022 vs 2021. Sales increased 26.7%, up from 75 annual sales in a record-setting year like 2021 to an even more incredible total of 95 sales in 2022. (Fig. 15a)
- Reporting its highest annual sales ever, Downtown Miami outperformed all previous years – 2021 (75 annual sales), 2020 (25 annual sales), 2019 (15 annual sales), 2018 (12 annual sales), and earlier. (Fig. 16.1)
- Downtown Miami led annual sales growth in Miami overall with the highest percentage increase in 2022-over-2021 sales.
Downtown Miami Luxury Condo Quarterly Sales 2015 - 2022 - Fig. 16.1
As sales momentum dropped over two consecutive quarters, the 12-month Sales Trendline of Fig. 16.2 expectedly down-shifted into a negative trajectory for the first time since Q1 2022.
Downtown Miami Luxury Condo 12-Month Sales with Trendline - Fig. 16.2
— 14 Downtown Miami Luxury Condo Price Trends: Mixed
Annual Price per Square Foot up 7.5% to $724, Median Sales Price down
Deviating slightly from the overall market trend of higher year-over-year annual price per square foot and flat Median Price, luxury condos in Downtown reported the following trends (Fig. 15a):
- Price per Square Foot increased 7.5%, up from $673 in 2021 to $724 in 2022.
- Most affordable entry point into Miami's luxury condo market for buyers in 2022 on a price per square foot basis.
- Median Sales Price declined -10.8%, down from $1,525,000 in 2021 to $1,360,000 in 2022.
As mentioned above in this report, it may be that sales of smaller, amenity-rich luxury condos (in size) that tend to command a higher price per square foot dominated the year, explaining the inconsistency in Price per Square Foot and Median Sales Price trends.
Q4 2022 Price/Square Foot up 3.1% to $744, Median Sales Price down year-over-year
Consistent with the overall Miami market trend of higher year-over-year Price per Square Foot and lower Median Price in Q4, Downtown also reported the same trends (Fig. 15.1):
- Q4 2022 vs Q4 2021. Price per Square Foot increased by 3.1%, up from $722 in Q4 2021 to $744 for the same quarter 2022.
- Looking at the 5-year snapshot of quarterly prices per square foot below (Fig. 17), we found that prices in Downtown Miami closed in the mid-ranges for Q4 - giving sellers fair value for their luxury condo investments.
- Median Sales Price decreased 30.7%, down from $1,675,000 in Q4 2021 to $1,160,000 in Q4 2022.
- Q4 2022 vs Q3 2022. Price per Square Foot increased by 5.7%, up from $704 in Q3 2022 to $744 in Q4 2022. (Fig. 15)
- Median Sales Price decreased 7.2%, down from $1,250,000 in the previous quarter to $1,160,000 in Q4 2022.
Downtown Miami Luxury Condo Quarterly Price per Sq. Ft. 2017-2022 - Fig. 17
— Downtown Miami Days on Market: Down Annually + YoY in 4Q 2022
Days on Market down 12.9% on annual basis and 33.3% 4Q22-over-4Q21
Echoing the overall market trend of lower Days on Market, luxury condos consistently took fewer days to sell in Downtown Miami:
- 2022 vs 2021. Days on Market declined 12.9%, with luxury condos spending 12 fewer days on the market compared to 2022. (Fig. 15a)
- Q4 2022 vs Q4 2021. Days on Market declined 33.3%, showing luxury condos spent 33 fewer days on market compared to Q4 2021. (Fig. 15.1)
Downtown Miami Luxury Condo Quarterly Median Days on Market 2018 – 2022 - Fig. 18
— Downtown Miami Inventory: Up YoY – Again Highest in Miami Overall
Q4 2022 closes with 27 months of Inventory
Following the overall Miami market trend, luxury condo inventory in Downtown Miami increased quarter-over-quarter as well as year-over-year in Q4 2022. At 27 months, inventory closed above the 9-12-month mark of an ideal market – bringing the luxury condo market in this urban core to favor buyers for the interim, before high season (Spring 2023) scoops away a chunk of it, bringing the market into a more balanced position.
- On an annual basis, inventory was up from 15 months in December 2021 to 27 months in December 2022 – an 80% uptick. (Fig. 19)
- On a quarter-over-quarter basis, inventory increased from 12 months in September 2022 to 17 months in December – a 125% increase.
- Downtown Miami closed 2022 with, yet again, the highest year-end inventory of all Miami neighborhoods in our study.
Downtown Miami Luxury Condo Months of Inventory from Mar. 2019 to Dec 2022 - Fig. 19
A balanced market has only 9-12 months of inventory. The months of inventory are calculated as – no. of active listings + no. of pending listings divided by the average number of deals in the last 6 months.
— Q4 2022 Greater Downtown Miami Market Conclusion
2022 may not have been a record year for the rest of Miami, but the Greater Downtown area enjoyed exceptional buyer demand. Perhaps due to multiple businesses migrating to the financial district of Brickell, with people wanting to live closer to work, or better-priced waterfront options in Edgewater, Greater Downtown emerged as the top market for luxury condos in Miami in 2022.
Deviating from the overall annual sales trend in Miami of lower 2022-over-2021 sales, Greater Downtown Miami posted increases across the board. In Q4 2022, however, momentum slowed in line with the overall Miami market trend - except in Downtown Miami, which led market growth with an increase in year-over-year sales. Downtown and Brickell emerged as the most popular neighborhoods of 2022 (on an annual basis).
Like the overall market, the 12-month sales trendline remained negative across the board.
In terms of prices, Greater Downtown Miami, like the overall Miami trend, reported an increase in 2022-over-2021 as well as 4Q22-over-4Q21 Price per Square Foot – offering sellers great value for their luxury properties. Luxury condos in Edgewater were found to offer the best value to sellers out of all 3 sub-markets in Greater Downtown Miami – posting the highest percentage increase in year-over-year Price per Square Foot for Q4 2022. Edgewater also emerged as the most expensive of all 3 sub-markets.
The Days on Market declined across the board in step with the overall market trend in Miami, on an annual as well as year-over-year basis in Q4 2022. Luxury condos took less than 2 months (58 days) to sell in Greater Downtown in Q4 2022. Brickell emerged as the fastest-selling market.
Expectedly, inventory increased across the board, like the overall market in Miami, as the market took its seasonal breather. Downtown Miami closed with the highest months of inventory (27) in all of Miami, temporarily turning into a buyer-friendly landscape in a market otherwise poised to balance out soon.
Moving into the high season of 2023, we, as real estate experts, expect the following to influence market trends:
As a tax saver's haven and pro-business market, we expect wealth and business migration to continue fueling demand for generously-sized luxury condos in Miami, especially in and around Brickell a.k.a. the Wall Street of the South.
As interest rates start to normalize, we expect more buyers and sellers to come off the sidelines.
As a safe investment haven, we expect our foreign buyer market share to increase in the immediate future.
As high season sets in and with fewer deliveries schedules in the immediate future, we expect inventory to correct back to a balanced position.
As Miami's brand values is recognized by more people and organizations across the globe (read this Knight Frank Report ranking Miami as the second "prime" real estate market in the world), we expect more high net worth individuals to grab a branded vacation condo or second home with great rental income opportunities here.
|
Q4-22 Trends |
Overall Miami |
GDM |
Edgewater |
Brickell |
Downtown Miami |
|
Sales |
Down |
Down |
Down |
Down |
Up |
|
Sales Trendline |
Negative |
Negative |
Negative |
Negative |
Negative |
|
Price/Sq. Ft. |
Up |
Up |
Up |
Up |
Up |
|
Days on Market |
Down |
Down |
Down |
Down |
Down |
|
Inventory |
Up |
Up |
Up |
Up |
Up |
|
2022 Annual Trends |
Overall Miami |
GDM |
Edgewater |
Brickell |
Downtown Miami |
|
Sales |
Down |
Up |
Up |
Up |
Up |
|
Price/Sq. Ft. |
Up |
Up |
Up |
Up |
Up |
|
Days on Market |
Down |
Down |
Down |
Down |
Down |
Want more data and Miami real estate market analyses? Subscribe (see the subscribe link on the top menu) to receive the latest market news in your inbox and share our blog.
Questions or comments about the stats? Interested in browsing the market? Contact Sep at sniakan (at) blackbookproperties.com or call 305-725-0566.