Luxury Miami Condo Market Trends: Q2 2018 & June 2018 Report
Jul 22, 2018 July 22, 2018
Learn the latest market trends for the luxury condo market in Miami, with detailed quarterly and yearly statistics and accurate analysis you can't find anywhere else.
Miami Luxury Condo Report Overall Market Summary
City and Neighborhood Luxury Condo Reports
Miami Beach Luxury Condo Report
South Beach Luxury Condo Report
Bal Harbour Luxury Condo Report
Sunny Isles Beach Luxury Condo Report
Greater Downtown Miami Luxury Condo Report
Edgewater / Midtown / A&E District Luxury Condo Report
Coconut Grove Luxury Condo Report
Coral Gables Luxury Condo Report
Miami Luxury Condo Market Report: Summary back to top
The numbers are in for the second quarter and we see signs of a healthy pick up in the luxury condo market. Sales numbers are looking good and inventory continues to shed some weight. This quarter, we feature a deeper analysis on what’s been keeping up the inflation in our price charts, read on below to find out…
For the purpose of this luxury condo report, we have only considered properties priced $600,000 and above. Also, properties priced $5 million and higher have been referred to as ultra-luxury.
Overall Market Highlights:
- Q2 sales deliver higher boost than 2017 and 2016 levels, except in Mid-Beach and Edgewater grouping
- Q2 days on market report increase in medians
- Q2 posts price increases for newer, more expensive product as condos built 2014 and earlier hover around million-dollar mark on average
- Inventory shrinks in all neighborhoods, except Bal Harbour and Coral Gables
- Market shows steady growth, not out of the woods yet, buyers should buckle up and move quickly to land deals
Q2 sales outshine 2016 and 2017’s peak numbers. Although the second quarter is usually the strongest of the year, this year’s numbers have posted an exceptional boost. We see the overall trend with almost every neighborhood in our study outdoing 2016 and 2017’s peak performances. This is a true, sustained increase in sales with numbers growing steadily since Q3 2017. We strongly believe that even when Q3 posts its seasonal dip this year, which it historically does, the drop won’t be significant and the year will close on a strong note.
Quarterly days on market nudge up. Perhaps the only negative in an otherwise positive study is the increase we see in the overall days on market this quarter. This is likely a sign that sellers who were previously unrealistic about prices have finally come to terms and let their properties go for today's market prices. It is likely a part of the process of clearing out older inventory..
Newer constructions inflate prices, as prices on older constructions remained flat or declined. We had been noticing an upsurge in our charts that did not match up to the ground reality of prices in the luxury condo segment. So, we decided to split up the values according to the age of construction to figure out what fueled this volatility. Once the fresh built product (2015-2018) was removed from the rest, we found that prices had mostly remained sideways or gone down for pre-2014 condos. The average prices of pre-2014 constructions have hovered mostly around the million-dollar mark with only a few deviations.
Inventory hits new low since 2017. A stark reduction in the overall months of inventory from the beginning of the year is perhaps the highlight of our study. Even as new condos wait to be delivered, it is great to see that the market is ready to absorb this current stock. This positive trend began in March, and we hope to see a continuation in upcoming months in spite of the usual seasonal corrections expected over the remaining quarters.
Overall, the market continues treading a positive course this second quarter. We’re hoping that trends will keep in the remaining quarters to bring the luxury condo market back to balance by 2019. Until then, buyers can enjoy the luxuries a favorable market brings with it.
Where Does the Market Go From Here? back to top
With newfound market momentum ready to loosen this buyers’ grip on the market, the following factors could (and some have even started to) take effect to help continue to nudge the market towards a balance:
- Increased demand of buyers from high tax states. We continue seeing higher demand from residents of high tax states post implementation of the SALT tax laws. The numbers speak for the trend, as a fresh wave of residents heads towards Miami. Check out which taxes you can save by becoming a resident of Miami.
- Fresh inventory to bring back buyer motivation. Even as newly built condos add to inventory, they also deliver a product that stands a class apart. With mind-boggling amenities, in-demand features and high-profile brand names backing these debutantes, post 2015 constructions are (and will be) grabbing buyer attention with distinction. And as buyers are able to see the delivered product, it will be easier for them to pull the trigger as opposed to buying pre-construction.
- Lower prices on condos built pre-2014 spurs buyer interest. As mentioned in previous reports, prices have mostly been steady or declined over the past year for luxury condos in Miami. Price adjustments in this segment will strike just the right cord with some of the more reluctant buyers.
- Real estate is fertile ground as stock market goes sideways. The stock market has mostly remained sideways in 2018 but moved up since 2016. This could be just the right time for some investors to pull out and move to greener pastures or simply lock in their gains and move into real estate purchases.
- Higher interest rates could create a sense of urgency. As more and more people get wind of an imminent increase in interest rates (and already an increase since the beginning of the year), there could be a sense of urgency that takes over first-time buyers, pushing them to make a purchase sooner before rates go up further.
Below is an insight into Miami’s overall and neighborhood-level luxury condo trends for Q2 and June 2018:
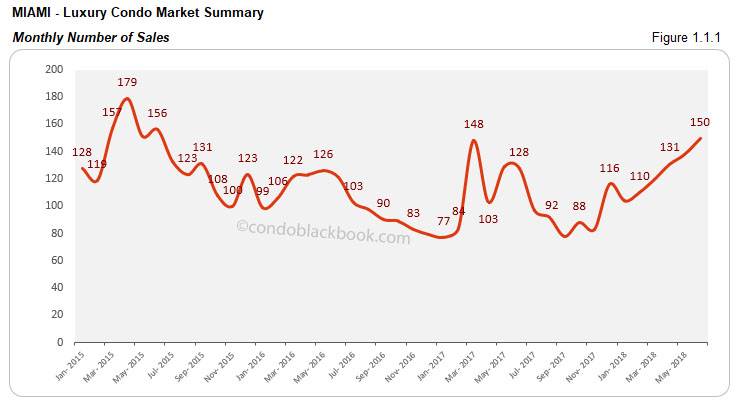
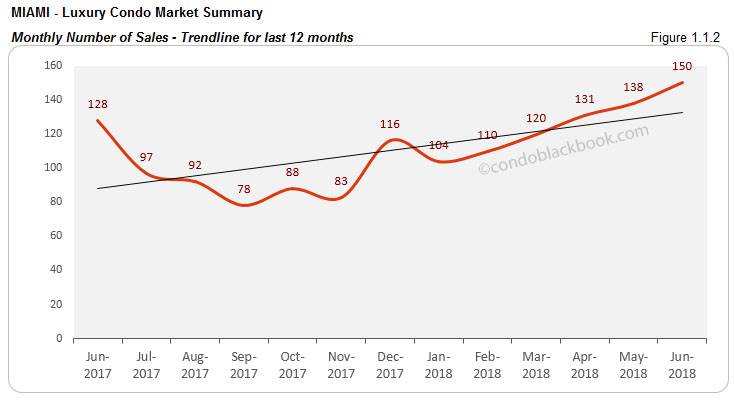
Monthly Number of Sales - Miami Luxury Condo Market Overall back to top
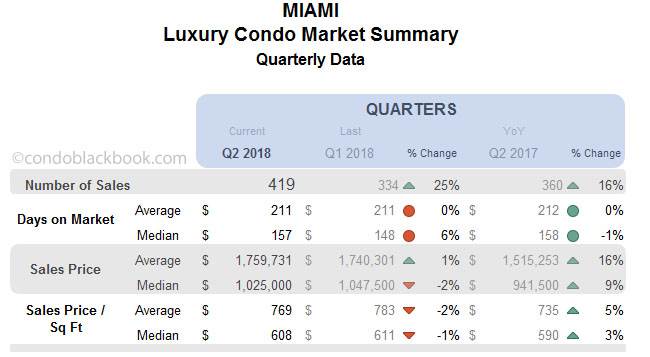
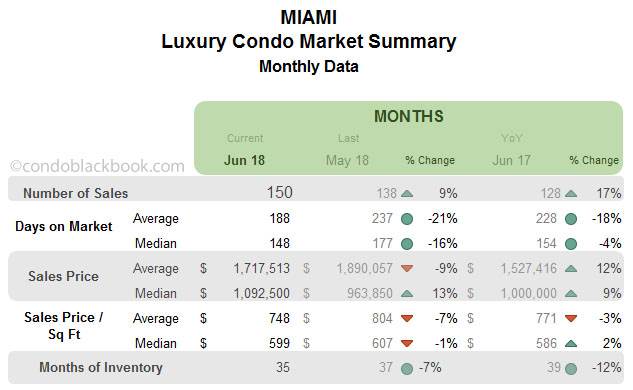
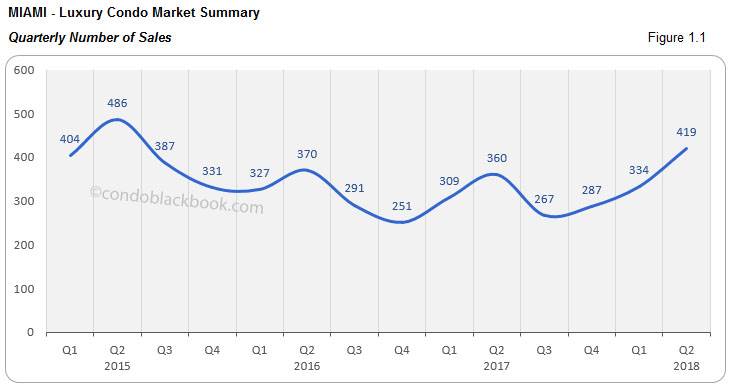
Steady escalation in sales boosts Q2 results with positive trend line. We see the second quarter deliver on its usual boost, which this year is even higher than the best of 2017 and 2016 (see fig. 1.1). Q2 closed 25% above Q1 and 16% higher compared to same quarter last year. Even June’s sales picture posted a 9% improvement over May and 17% improvement over same month last year (fig. 1.1.1). Fig. 1.1.2’s soaring trend line captures this progression beautifully. With the last 6 months reporting steady growth in sales, we hope to see this momentum carry forward.
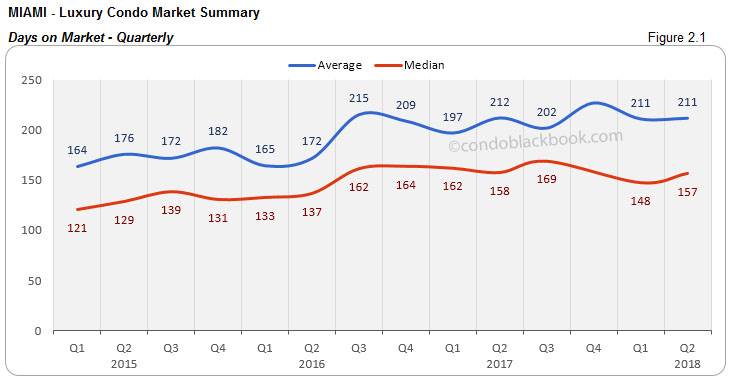
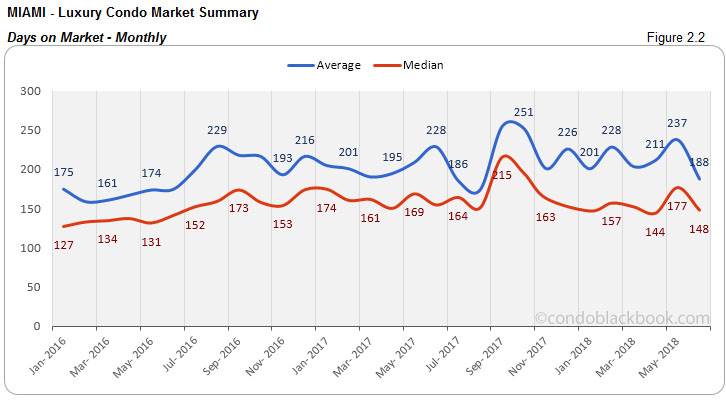
Days on Market - Miami Luxury Condo Market Overall back to top
“Days on market” are the total number of days from when a property is active to the day it goes under contract.
June’s days on market decline, but quarter posts increase. We saw luxury condos spending 16% less time on the market in June compared to May. They also matched 2017’s trend in Q2 with a median 157 days spent on market (fig. 2.1). However, Q2 posted a collective increase of 6% over Q1.
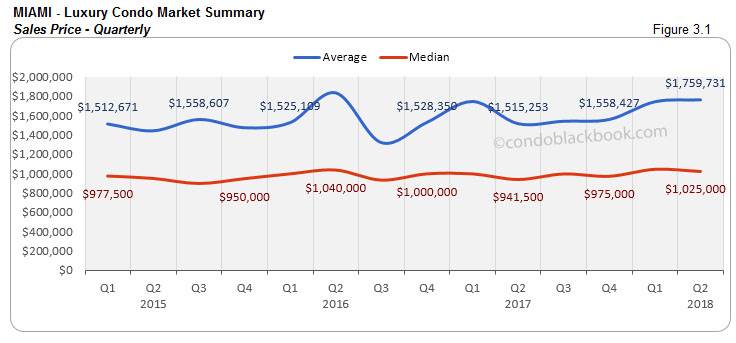
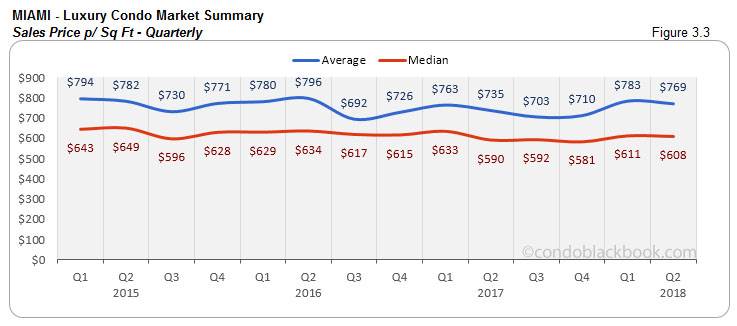
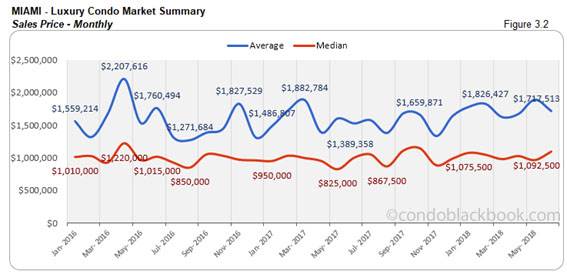
Sales Price Trends - Miami Luxury Condo Market Overall back to top
In our overall luxury condo market summary above, we see that Q2 posts a 1-2% decline over Q1’s sales price and price per sq. ft. However, there’s a 9% increase in prices and 3% increase in price per sq. ft. compared to same time last year. Now, we’ve known for sure that prices have either hovered or gone down for luxury condos in the market, which prompted us to dig deeper. This brought us to segregate buildings according to age and see what’s really going on.
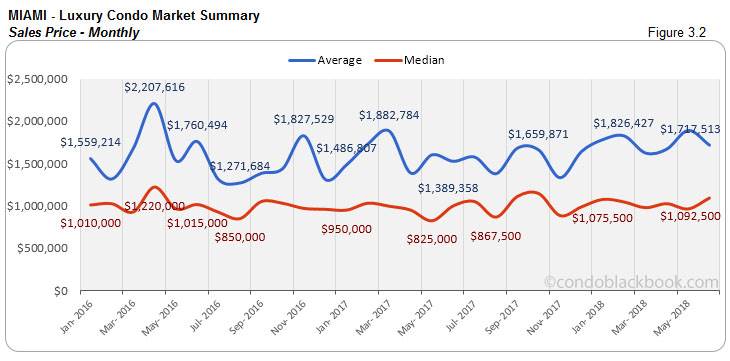
Overall prices inch higher. In fig. 3.2, we see an increase of 13% in the median sales price against May and 9% increase over June 2018.
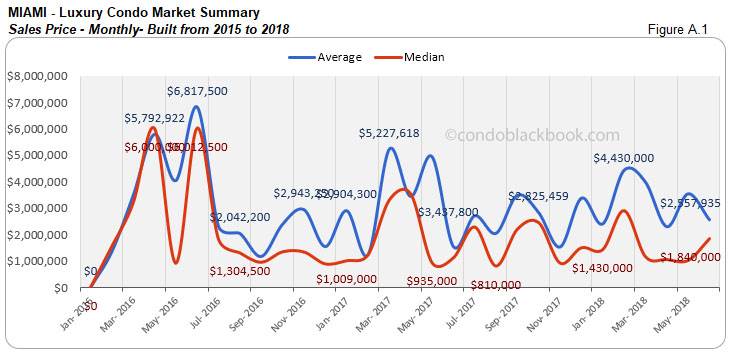
Prices surge for luxury condos built 2015 to 2018. In fig. A.1, we see a significant increase the sales price for newer condos built between 2015 and 2018. The median sales price is higher than May 2018 and June 2017. This goes on to solidify our observation (mentioned in previous reports) that the newer condo product is selling for higher due to its ultra-luxury appeal and inherent improvements. The steep highs and lows of this segment have also been deeply impacting previous month-to-month price charts by adding volatility.
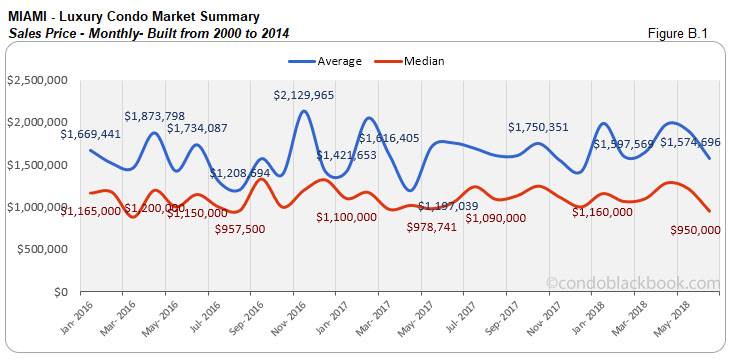
Prices plunge for luxury condos built 2000 to 2014. In fig. B.1, we see a dip in median sale prices. There is a decline compared to May 2018 and June 2017. Also, there is very little volatility in this segment, with prices hovering mostly around the million-dollar mark.
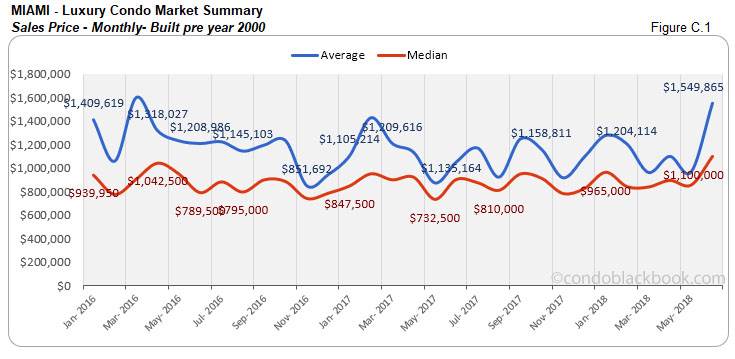
Prices up for luxury condos built 1999 and earlier. In fig. C.1, we see an increase in the median sale prices. There is an upward move from May 2018 and June 2017. Though this segment too hovered around the million-dollar mark for most part of the year, June comes in with an increase.
Sales Price Trends Considering Building Year Built - Miami Luxury Condo Market Overall back to top
ALL BUILDINGS
---------------------------------------------------------------
NEW CONSTRUCTION BUILDINGS (2015 to 2018)
---------------------------------------------------------------
BUILDINGS from 2000 to 2014
---------------------------------------------------------------
BUILDINGS from 1999 and older
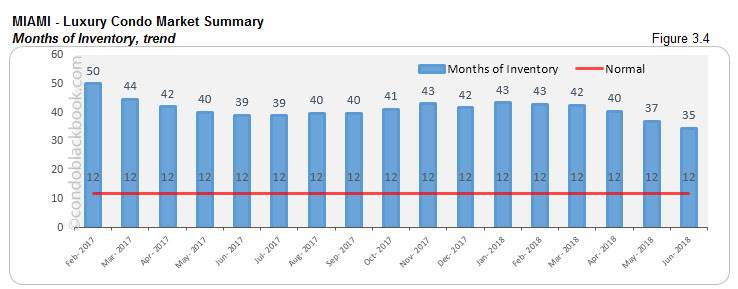
Inventory Trends - Miami Luxury Condo Market Overall back to top
A balanced market will only have 9-12 months of inventory. The months of inventory are calculated as – no. of active listings + no. of pending listings divided by the average number of deals in the last 6 months.
Inventory hits new low in over a year. For the second month in a row, we see inventory touch new lows in over a year (see fig. 3.4 below). At 35, the months of inventory is now down 7% compared to last month and 12% against same time last year. But, considering 35 is still way higher than the 9-12 month ideal, and lower pricing on condos built before 2015, buyers have ample opportunity to find great deals and steer negotiations in their favor.
City and Neighborhood Market Reports back to top
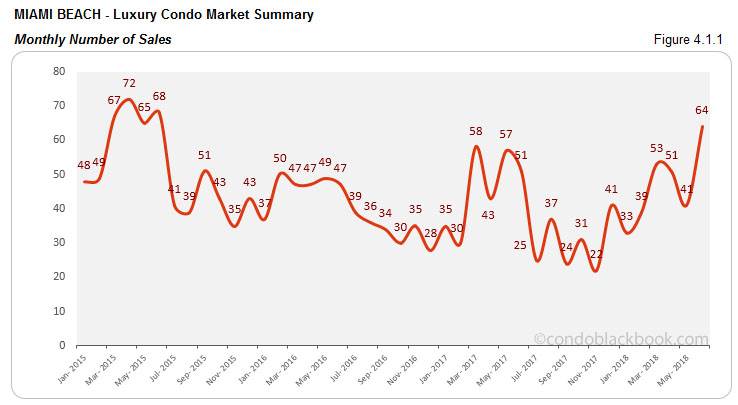
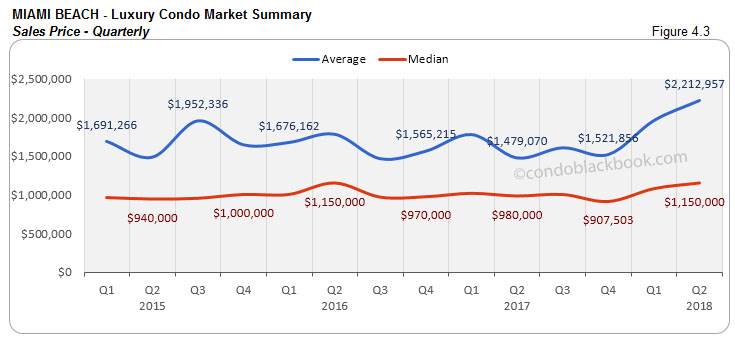
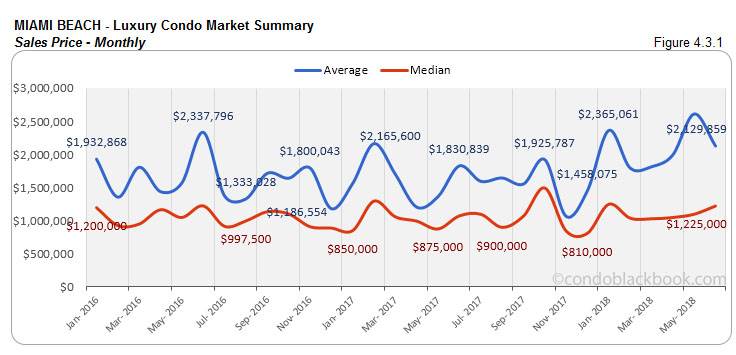
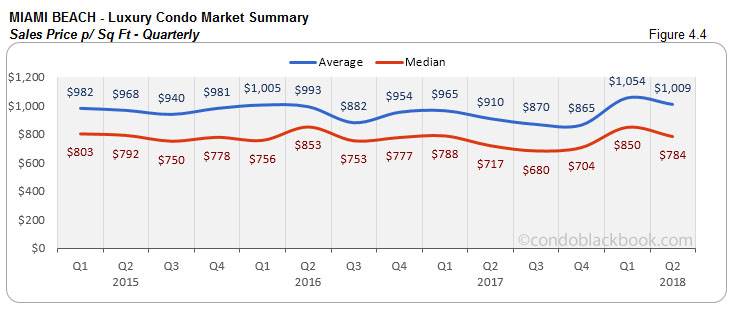
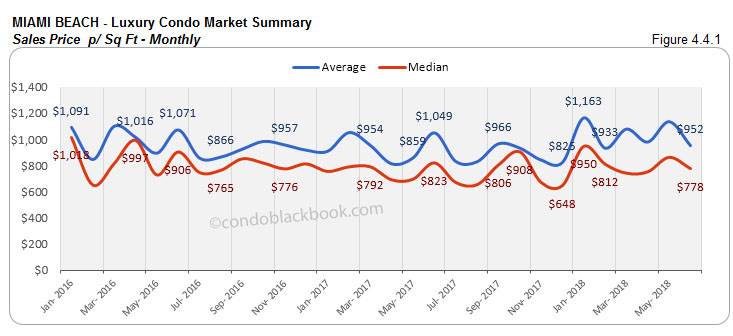
Miami Beach Luxury Condo Market Summary back to top
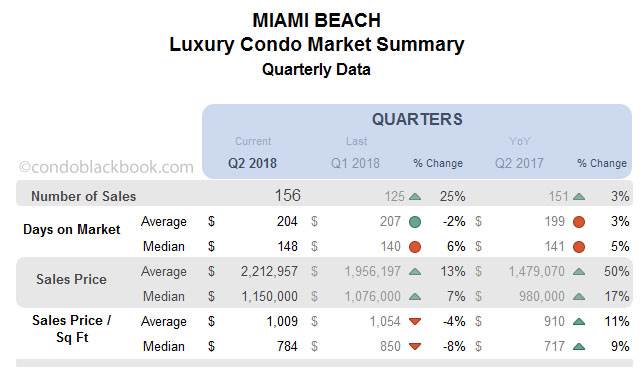
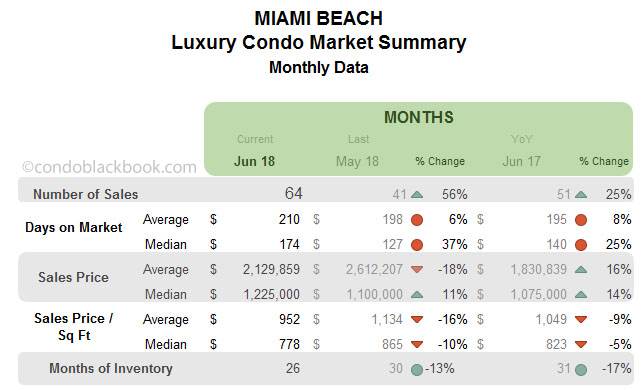
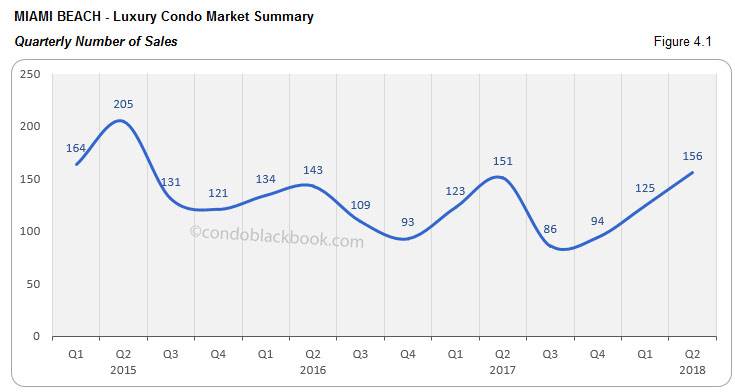
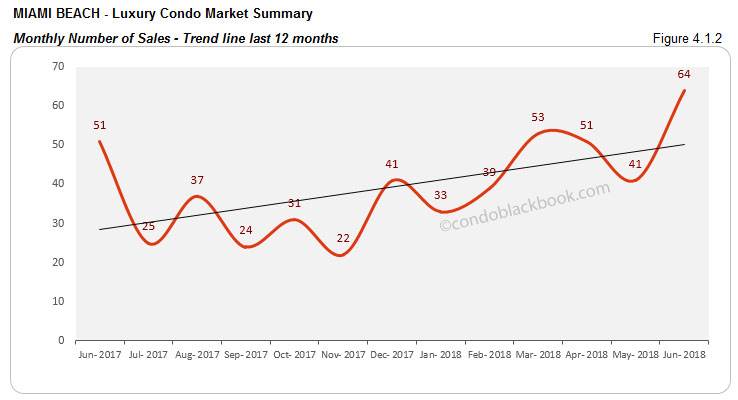
Q2 and June sales post uptick with positive trend line. Both the monthly and quarterly numbers paint a positive sales picture for luxury condos in Miami Beach. There is a 25% increase in sales to report over Q1 and a 3% increase over Q2 last year (fig. 4.1). This second quarter also outdoes Q2 2016. We further see June post an impressive 56% increase over May and 25% improvement over same month last year (fig. 4.1.1). Together, these strong statistics make for a positive trend line in fig. 4.1.2 below, indicating great momentum.
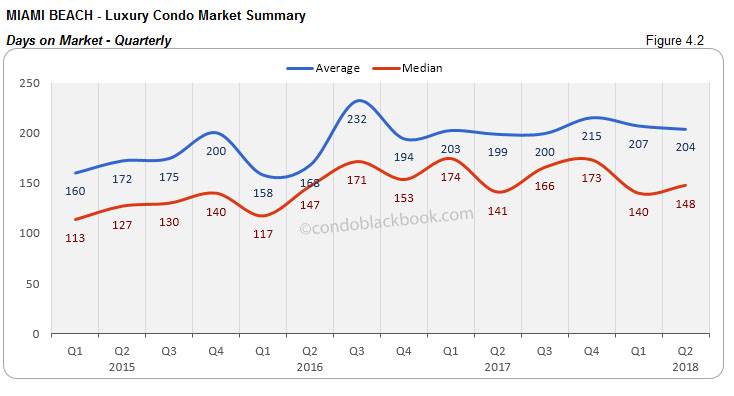
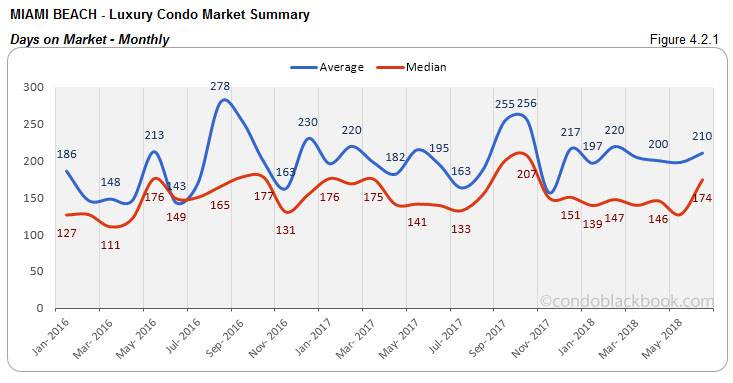
Days on market up 6% QoQ and 37% MoM. Luxury condos took 8 days longer to get off the market in Q2 compared to Q1, and 47 days longer month-to-month. This indicates that buyers and sellers are taking longer to come to a consensus in Miami Beach. (see fig. 4.2 and 4.2.1 below)
Quarterly and monthly prices up YoY. Q2 closed with a 17% increase in its median sales price compared to same quarter last year. The median price in June too was 14% higher year-over-year. Ultra-luxury sales over the second quarter plus higher prices on newly built condos (2015-2018) have been fueling this price rise. (see fig. 4.3, 4.3.1, 4.4 and 4.4.1 below)
Inventory dives 13%. Maintaining its positive trend from the past three months, we see the months of inventory decline 13% month-to-month and 17% year-over-year. At 26 months, inventory is now at its lowest in over a year. Inching closer towards the ideal of 9-12 months, buyers should hurry and browse through deals on Miami Beach condos for sale here before their window of opportunity closes.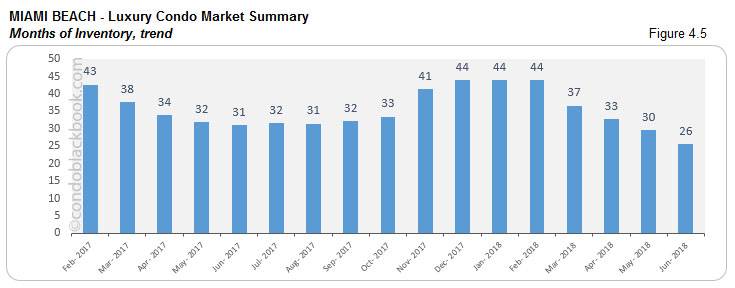
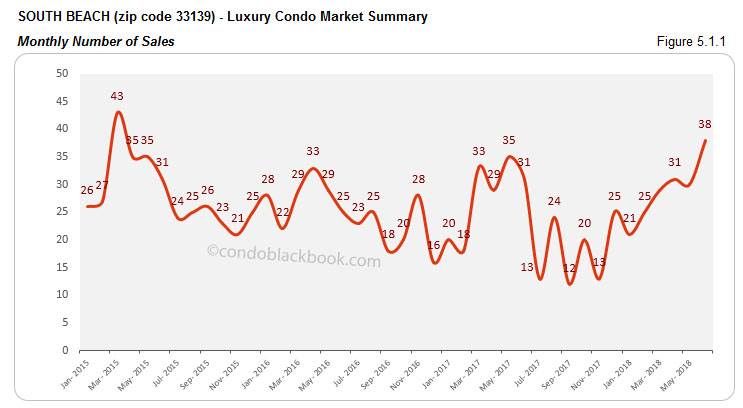
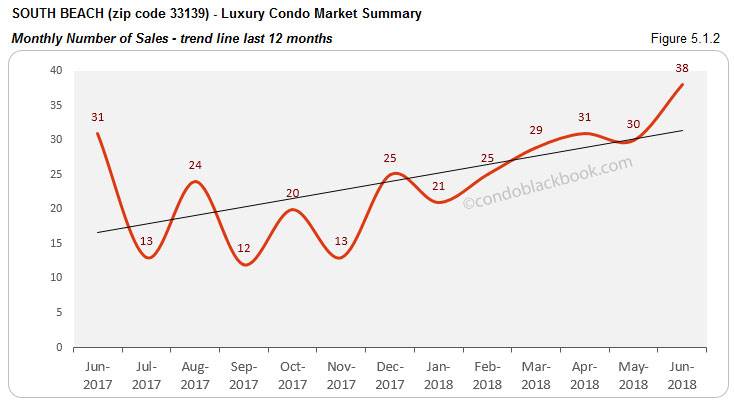
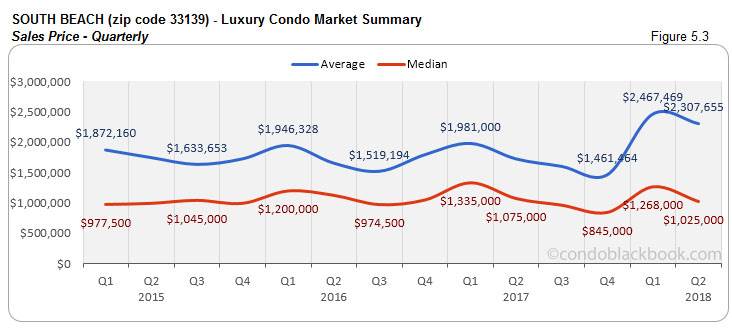
South Beach Luxury Condo Market Summary (33139 zip) back to top
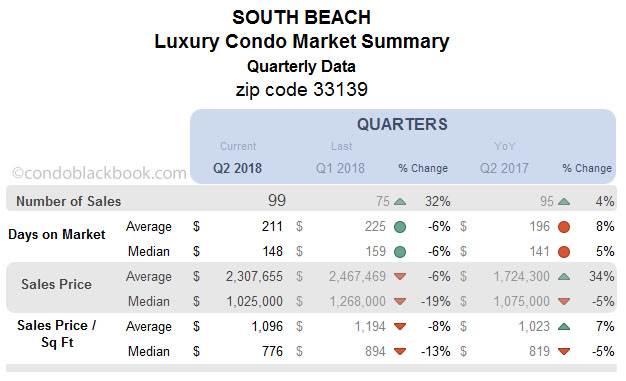
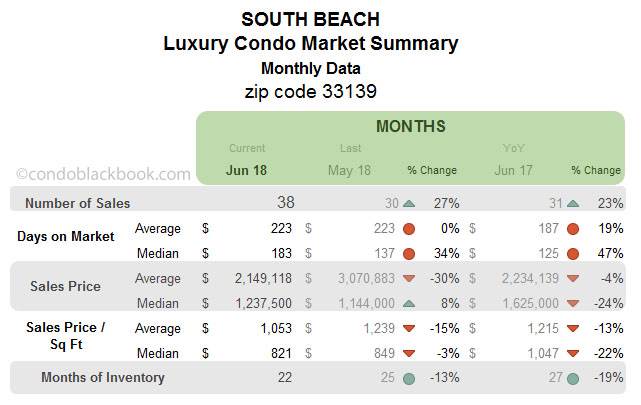
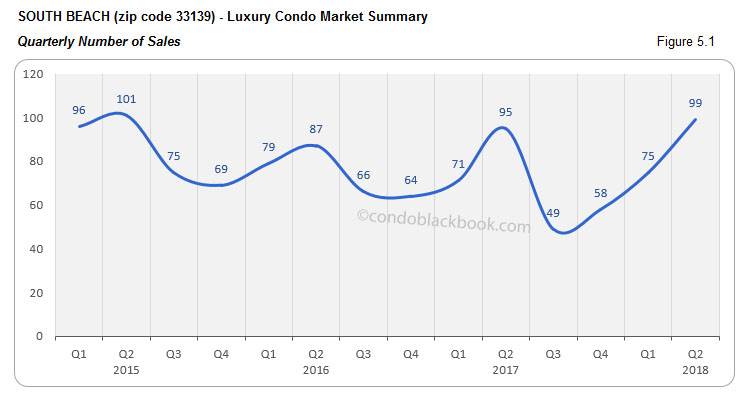
Q2 and June sales soar for positive trend line. The positivity in numbers continues in South Beach with Q2 and June coming in with impressive sales. We see a 27% increase in month-to-month numbers and a 23% increase year-over-year in June (fig. 5.1.1). This, in part, fuels this second quarter’s 32% quarter-over-quarter and 4% year-over-year growth (fig. 5.1). The positive market dynamic maintained over the past 6 months is clearly captured in fig. 5.1.2’s upward tracing trend line.
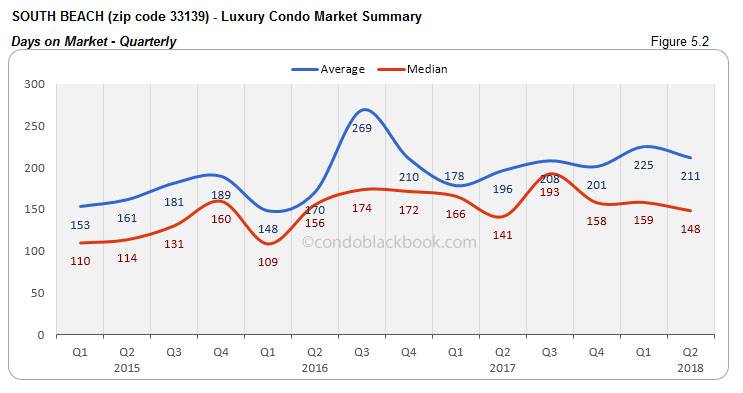
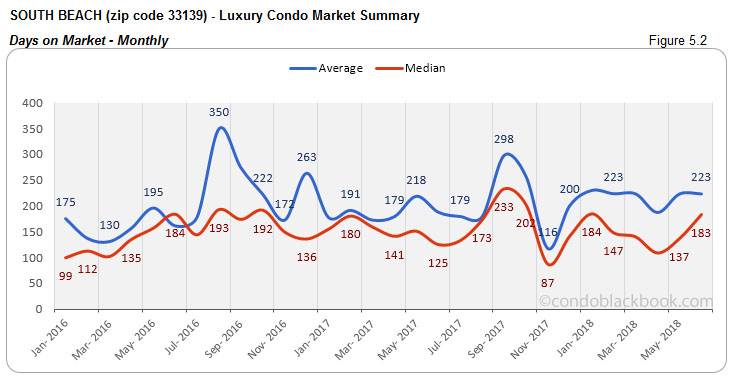
Days on market decline 6% QoQ but increase 34% MoM. Luxury condos in Q2 took 11 days less than Q1 to get off the market capturing better dialogue between buyers and sellers. However, June showed an increase of 46 days (on median) against May, showing that sellers and buyers in South Beach found it tougher to find a middle ground, or possibly that reluctant sellers who had their units sitting on the market are finally coming to reality and selling for market value. (see fig. 5.2 and 5.2.1 below)
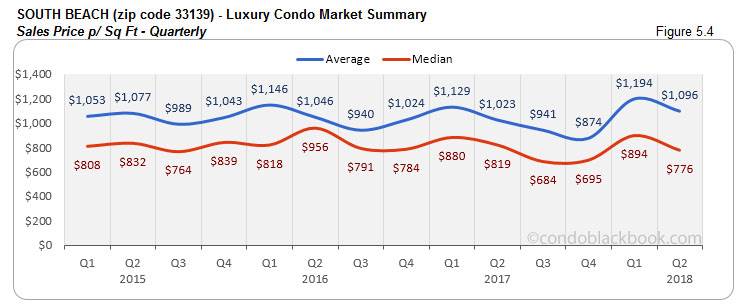
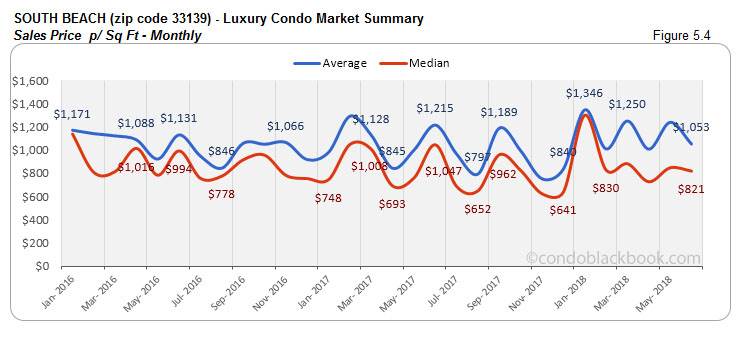
Quarterly and monthly prices decline YoY. Q2 posts a 5% decline in the year-over-year prices for South Beach (fig. 5.3 and 5.4). There is also a 24% decrease in the year-over-year median prices this June. The median price per sq. ft. for Q2 closed at $776. (see fig. 5.3.1 and 5.4.1 below)
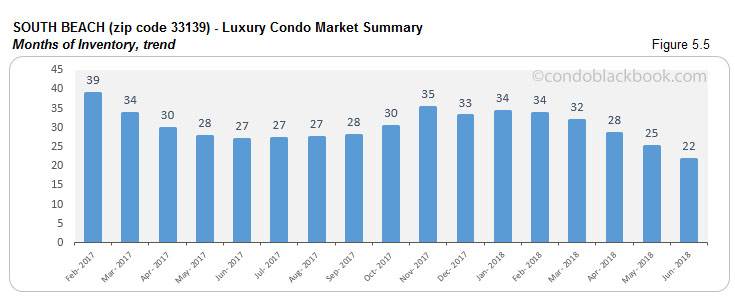
Inventory down 12%. Continuing on its steady decline, months of inventory dropped 13% month-to-month and 19% year-over-year in this destination neighborhood. At 22 months, inventory is closer to reaching the ideal 9-12-month mark of a balanced market. With the trend touching a new low in over a year, buyers are advised to hurry and grab the opportunity by searching South Beach condos for sale here, or taking a tour here.
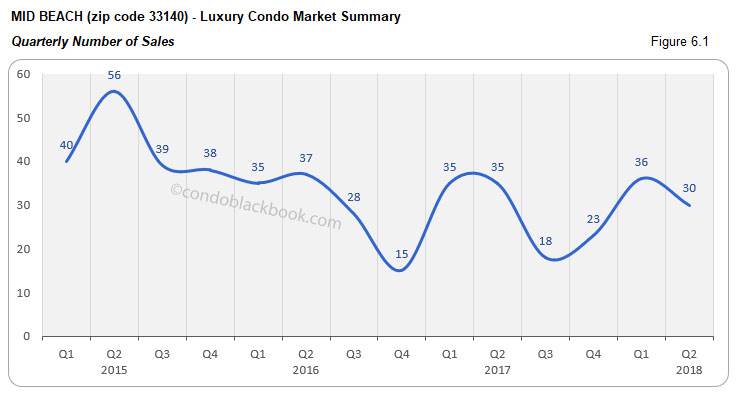
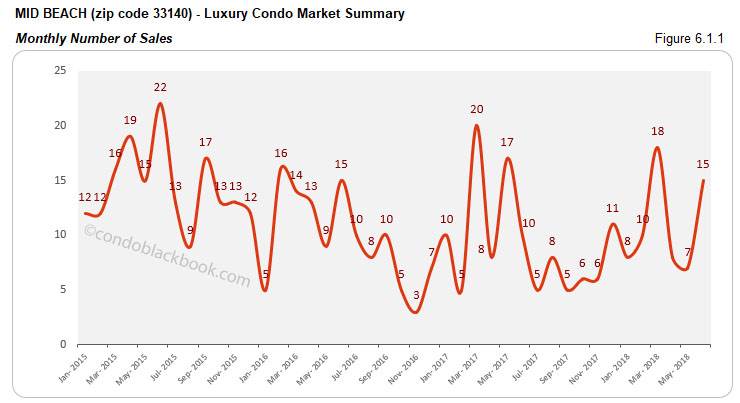
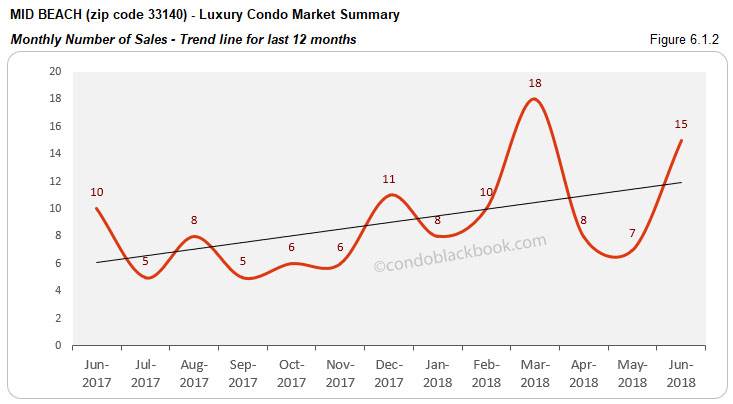
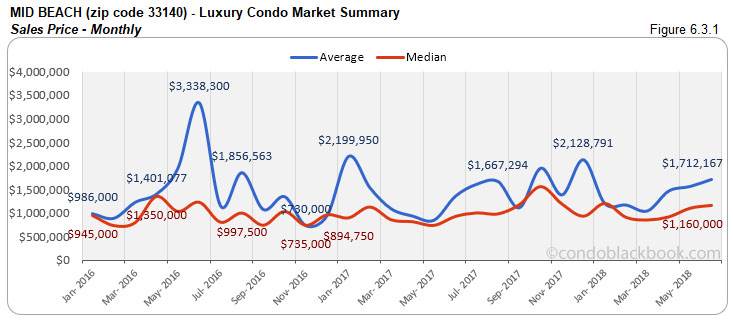
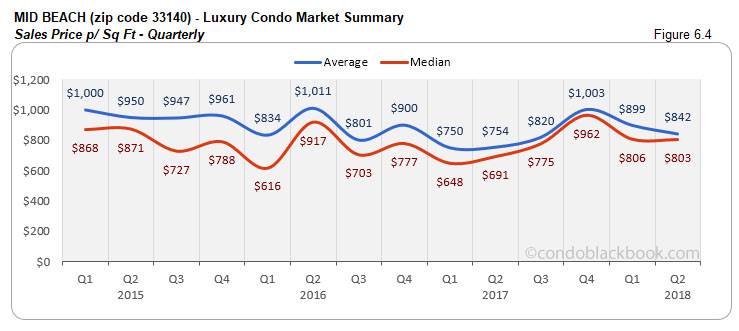
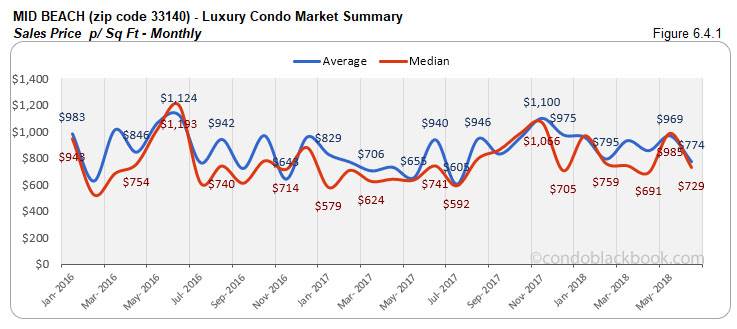
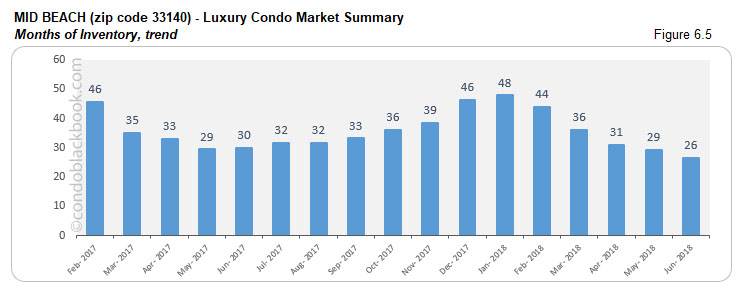
Mid-Beach Luxury Condo Market Summary (33140 zip) back to top
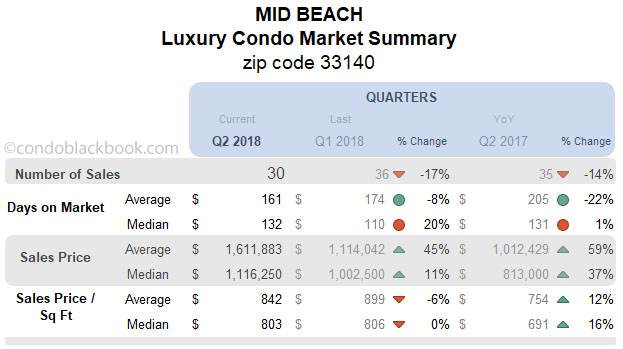
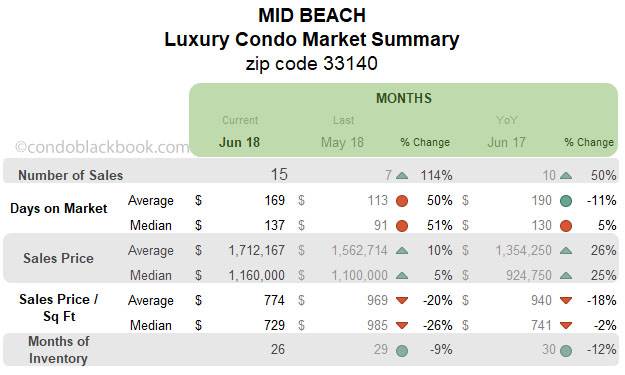
Quarterly sales miss the mark, but monthly numbers rise with positive trend line. Stepping away from the overall trend, we see Q2 post a 17% decline over Q1 and 14% decrease against same quarter last year in Mid-Beach (fig. 6.1). However, June did come in with a 114% month-to-month boost and 50% year-over-year increase (fig. 6.1.1). This helps keep the momentum and post a positive trend line in fig. 6.1.2.
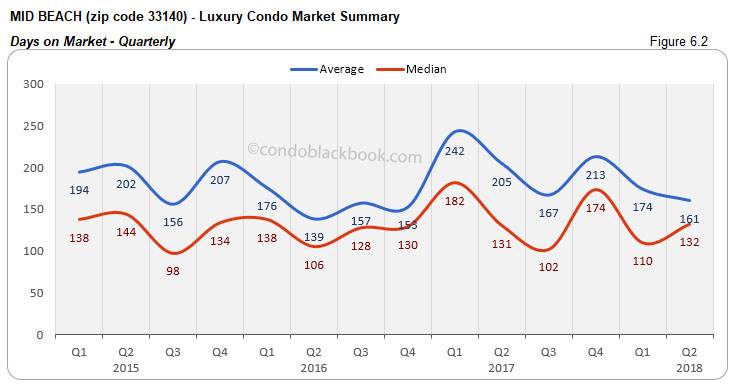
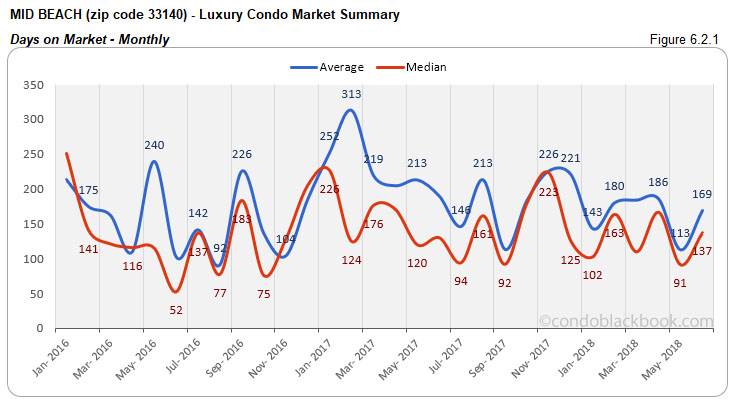
Days on market climb 20% QoQ and 51% MoM. Luxury condos spent 22 more days on the market in Q2 compared to Q1, and 38 days more month-to-month (on median). This shows that buyers and sellers took longer to find a middle ground in Mid-Beach. (see fig. 6.2 and 6.2.1 below)
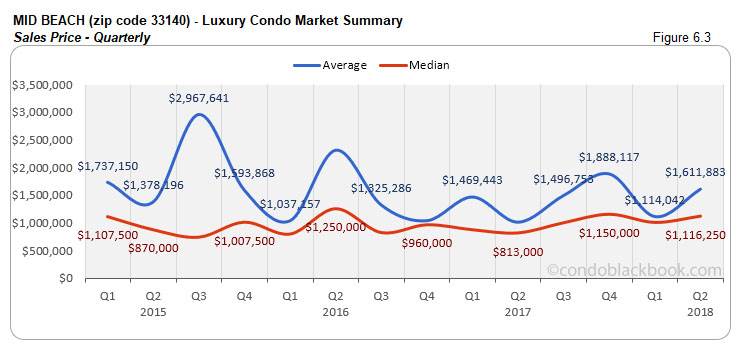
Quarterly and monthly prices post uptick YoY. Q2 posts a 37% increase in the year-over-year median sales price in Mid-Beach. June too posts a 25% year-over-year increase. The median price per sq. ft. for Q2 closed at $803. (see fig. 6.3, 6.3.1, 6.4 and 6.4.1 below)
Inventory down 9%. Steadily decreasing over the past few months, June continues with a 9% month-on-month and 12% year-over-year decrease. At 26 months, inventory here is inching towards the ideal 9-12-month mark of a balanced market. Buyers should be swifter to scoop up deals by searching Mid-Beach condos for sale here, or start out with a tour here.
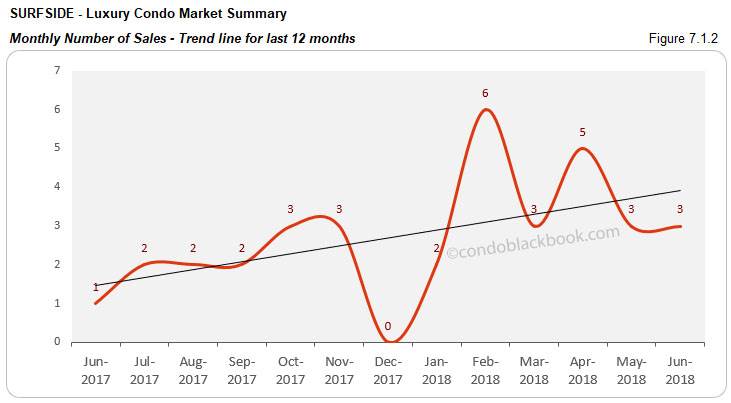
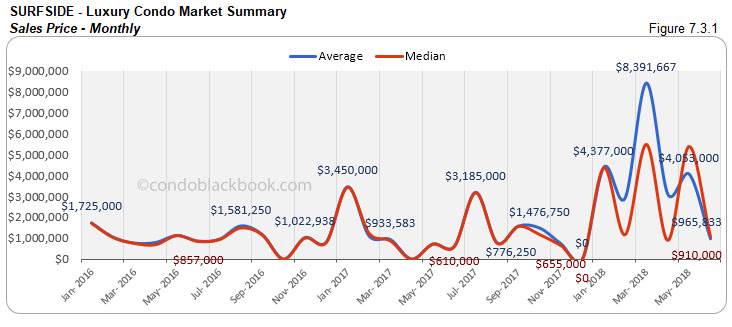
Surfside Luxury Condo Market Summary back to top
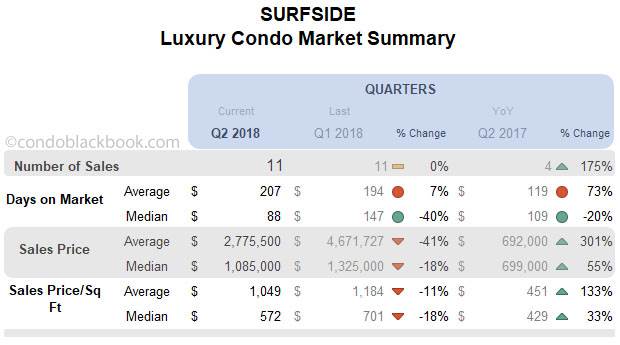
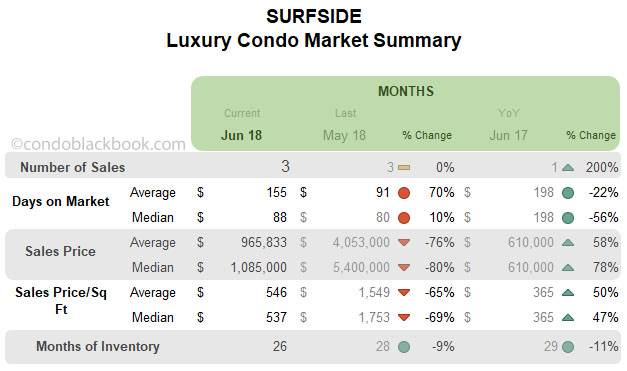
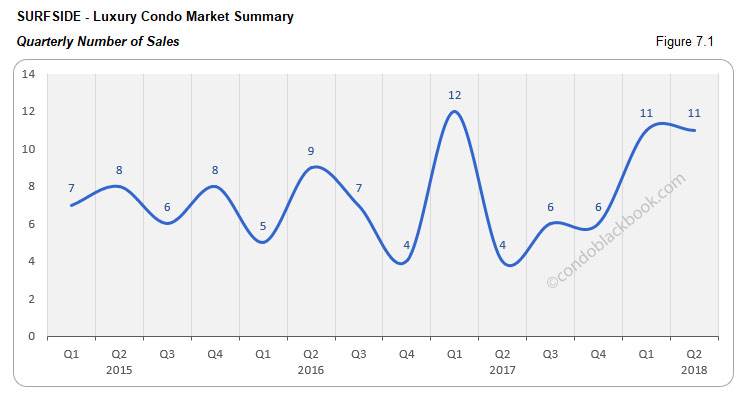
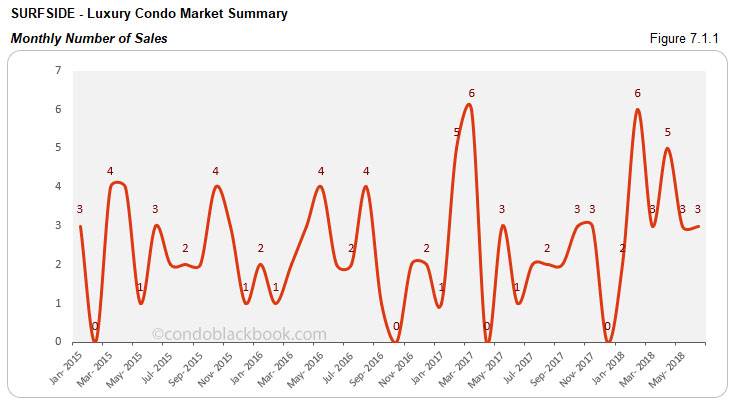
Quarterly and monthly sales keep with positive trend line. We see a consistent number of sales in Surfside. Q2 matched Q1’s sales, while posting a 175% increase against same quarter last year (fig. 7.1). June also matched May’s performance, along with posting a 200% increase over same month last year (fig. 7.1.1). Fig. 7.1.2 captures this boost with a positive trend line. Since Surfside is a rather modest market for luxury condos, even a small shift in numbers leads to high volatility, as can be seen in the year-over-year figures here.
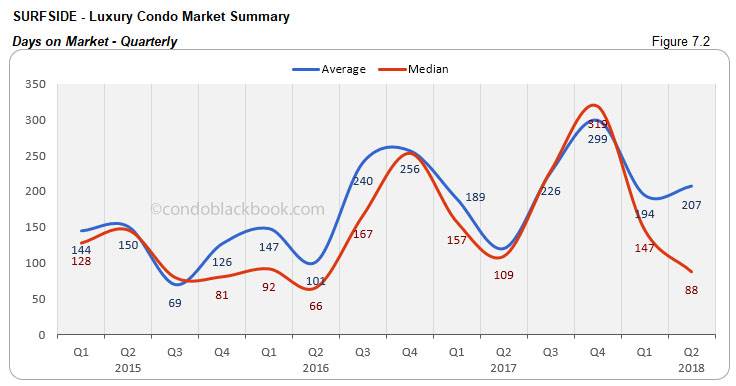
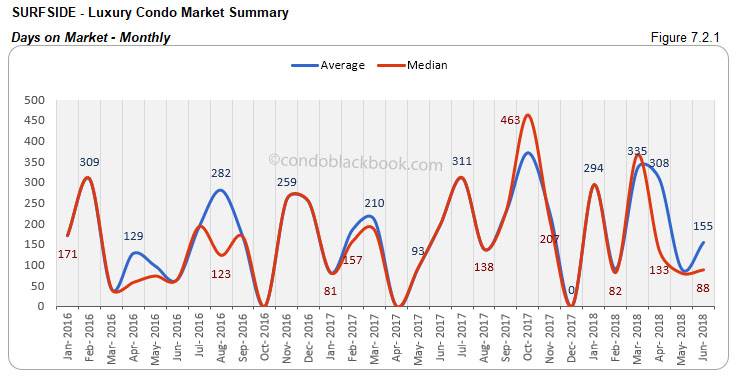
Days on market decline 40% QoQ but increase 10% MoM. Luxury condos in Q2 took 59 days less (on median) than Q1 to get off the market showing better consensus between buyers and sellers. However, June posts an increase of 8 days (on median) against May, indicating that it took longer for sellers and buyers to get on the same page this summer. (see fig. 7.2 and 7.2.1 below)
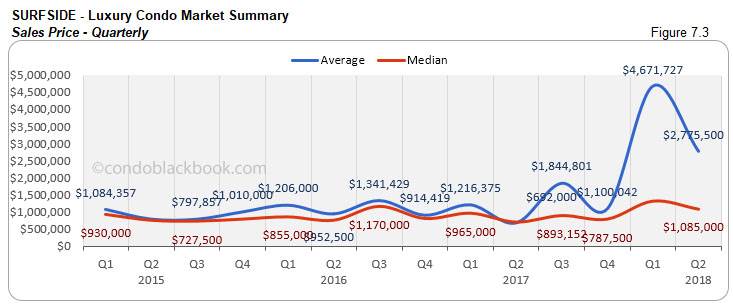
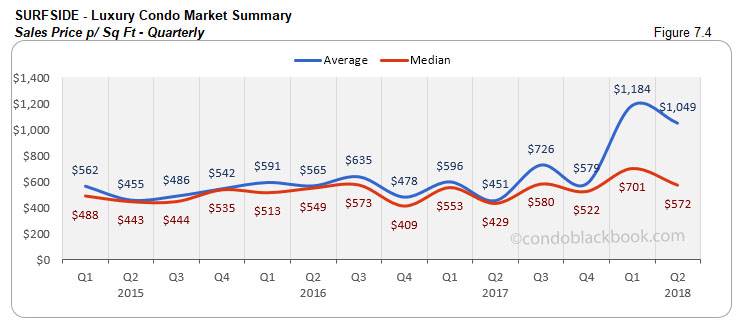
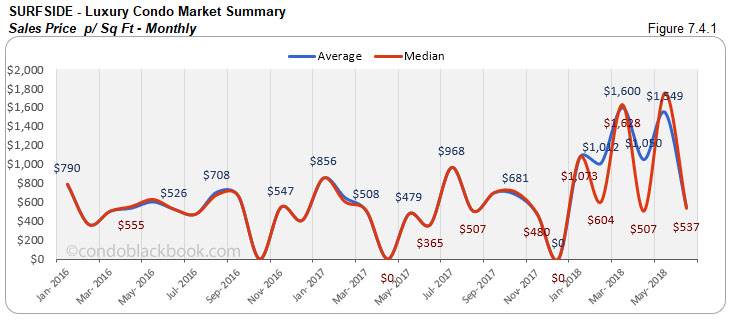
Quarterly and monthly prices post upswing YoY. Q2 posts a 55% increase in the year-over-year median sales price in Surfside. June too reports a 78% year-over-year increase. The median price per sq. ft. for Q2 closed at $572. (see fig. 7.3. 7.3.1, 7.4 and 7.4.1 below)
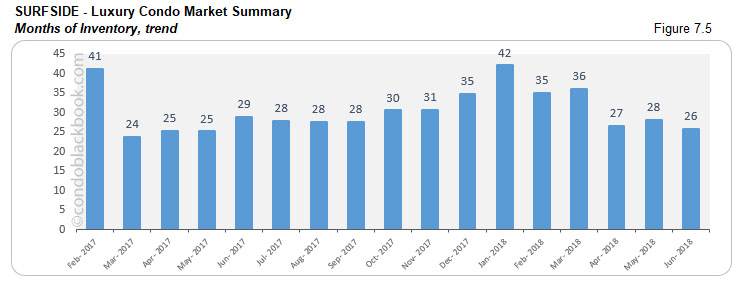
Inventory drops 9%. We see a consistent number of sales bring down the months of inventory by 9% month-to-month and 11% year-over-year. At 26 months, inventory is getting closer to achieving the 9-12 months of a balanced market. This gives buyers a shrinking window to control negotiations and drive them in their favor as they look for a Surfside condo for sale here, or see what lifestyle makes up Surfside here.
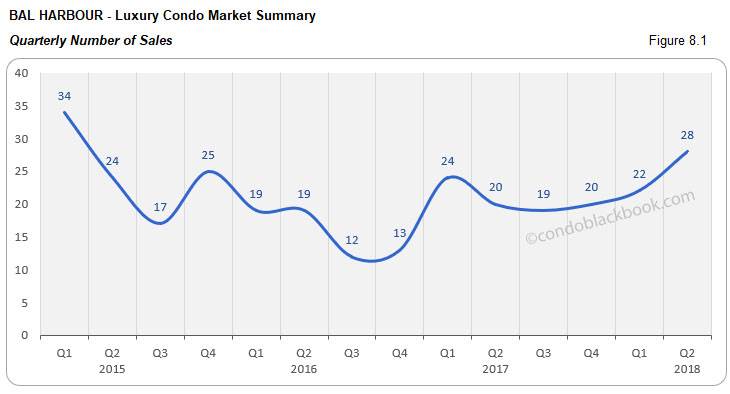
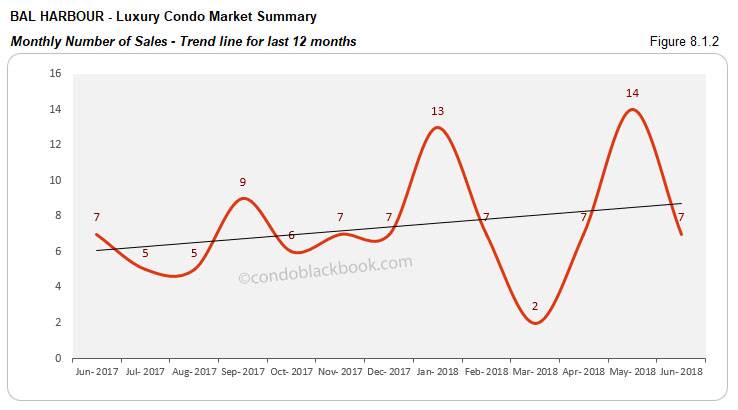
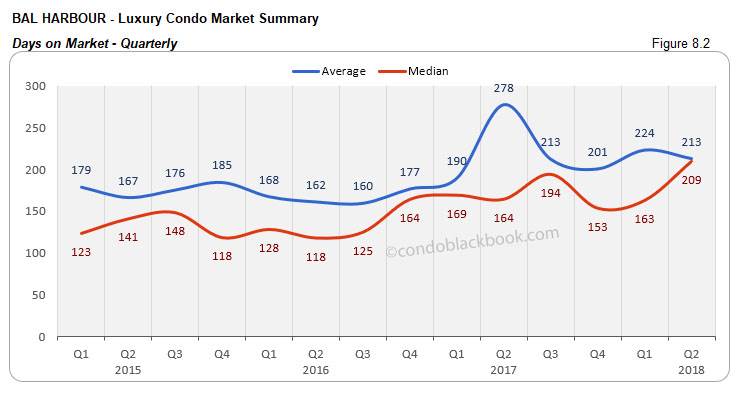
Bal Harbour Luxury Condo Market Summary back to top
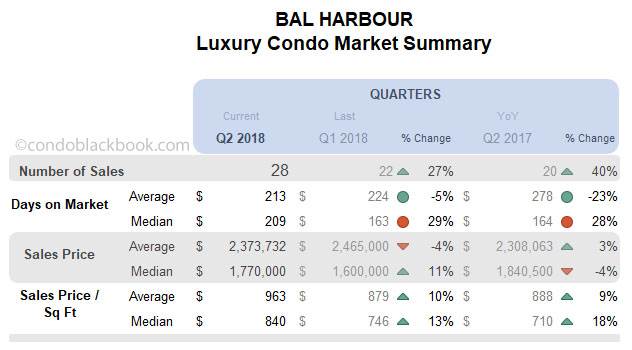
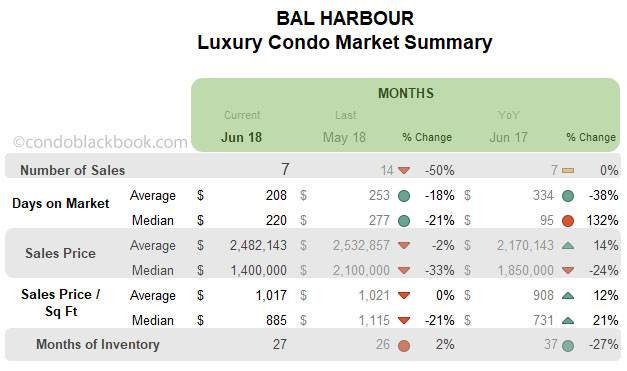
Month-to-month sales decline, but higher quarterly sales keep trend line positive. We see June posting a 50% decline compared to May, while maintaining its year-over-year performance. Still, Q2 closes 27% higher against Q1 and 40% higher compared to same quarter last year (fig. 8.1). This also tops 2016’s peak in Q2. The boost is clearly traceable in the upward shooting trend line of fig. 8.1.2.
Days on market up 29% QoQ but shrink 21% MoM. Luxury condos in Q2 took 46 days more (on median) than Q1 to get off the market. However, June posted a decline of 57 days (on median) against May, showing better consensus between buyers and sellers.
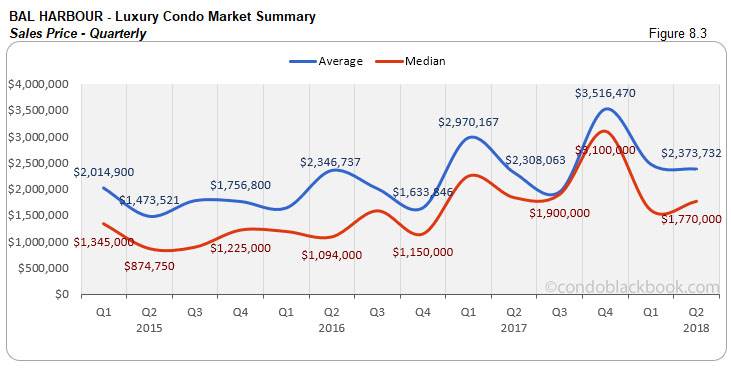
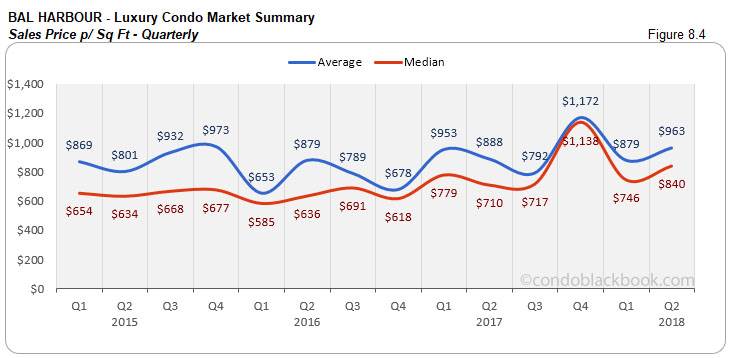
Quarterly and monthly prices decline YoY. There is a 4% decrease to report in the median sales price for Q2 against same quarter last year. We also see a 24% decline in year-over-year median prices compared to June last year. This reiterates our observation from previous studies that prices have actually been flat or on a decline, with only ultra-luxury or newly built condo sales keeping up inflation. Q2 closed with a $840 per sq. ft. median price in Bal Harbour. (see fig. 8.3 and 8.4 below)
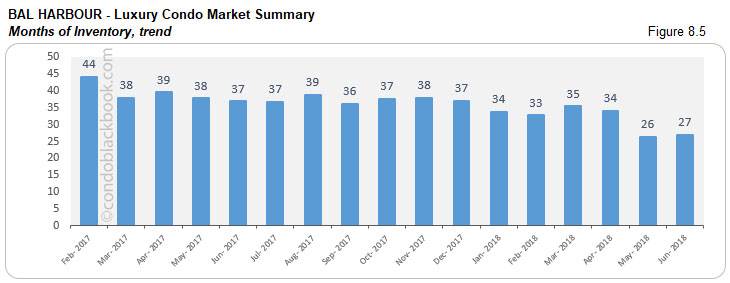
Inventory climbs back up 2%. After last month’s sharp decline, we see an increase of 2% in the months of inventory this June. Nonetheless, the stylish neighborhood posts a 27% decline year-over-year. At 27 months, inventory is still way off from the 9-12-month ideal of a balanced market. Buyers should take a cue and search for Bal Harbour condos for sale here, or check out the upscale neighborhood here.
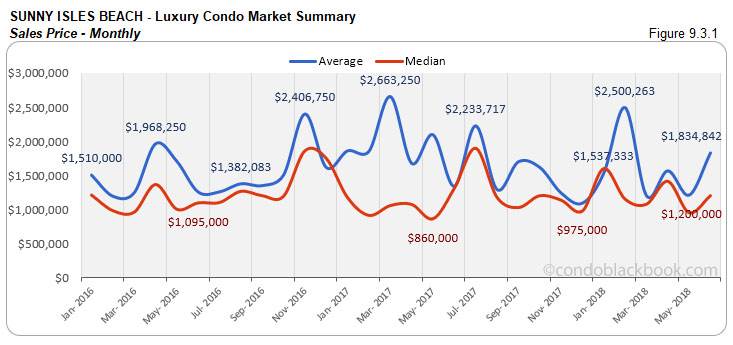
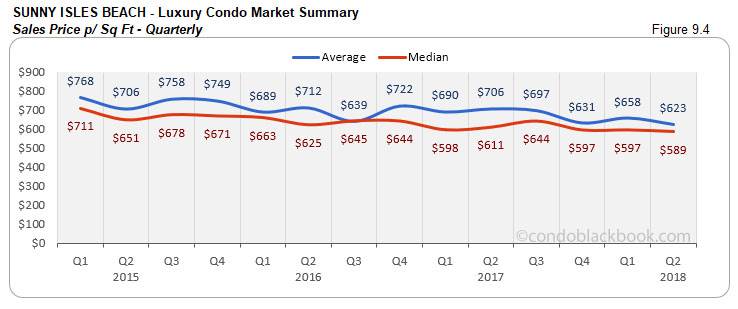
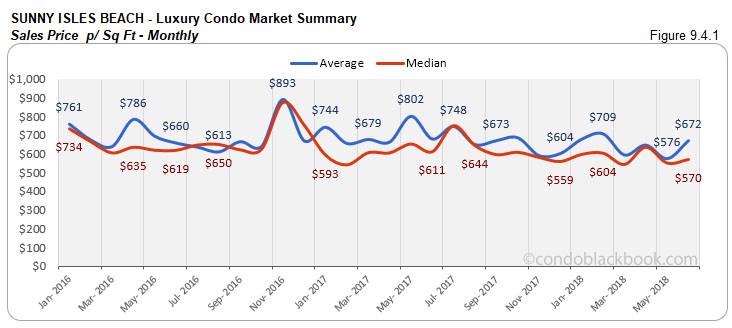
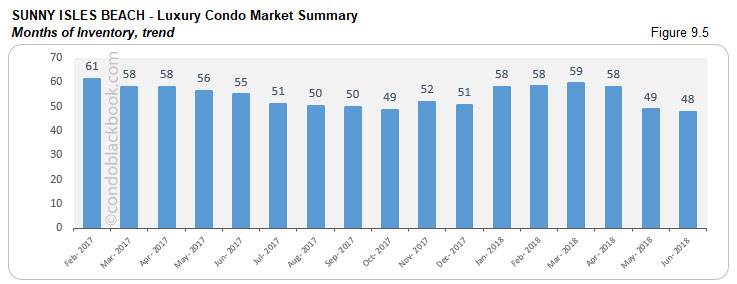
Sunny Isles Beach Luxury Condo Market Summary back to top
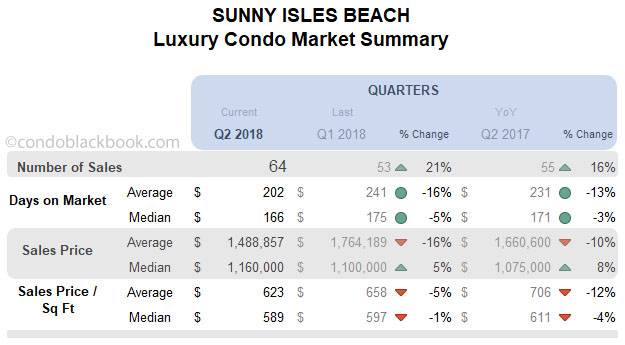
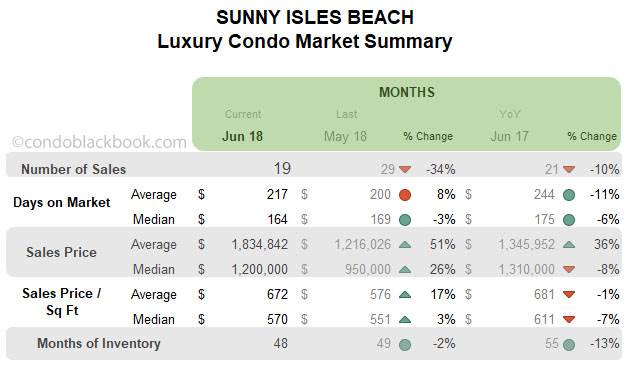
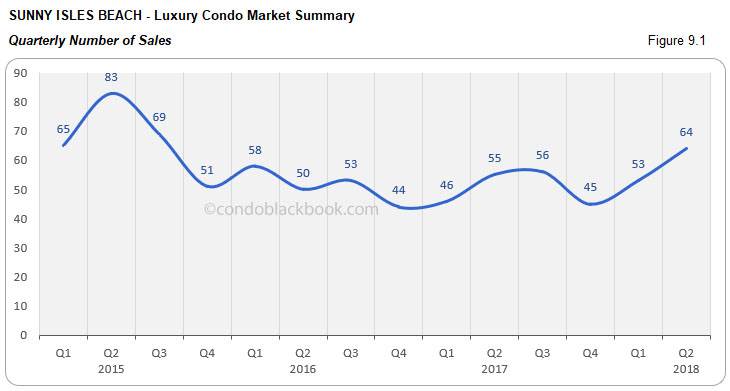
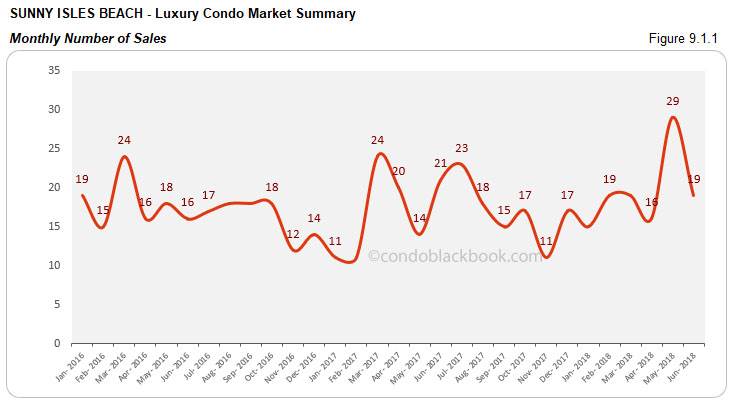
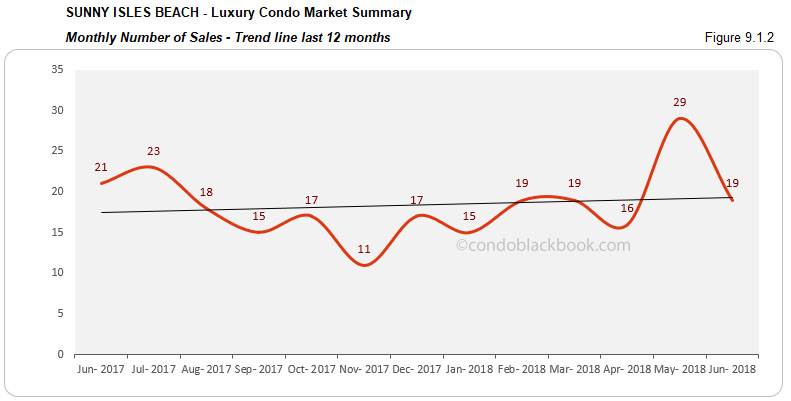
Quarterly sales and trend line push up, even as monthly numbers slip. Q2 delivers 21% higher sales than Q1, 16% more sales year-over-year and tops 2016’s second quarter peak (fig. 9.1). This, even as June posted a 34% decline against May and 10% decrease year-over-year (fig. 9.1.1). With momentum being carried through this second quarter, we find an upward climbing trend line in fig. 9.1.2.
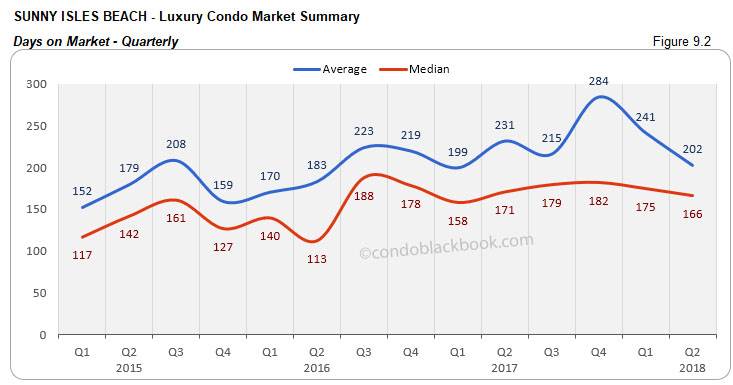
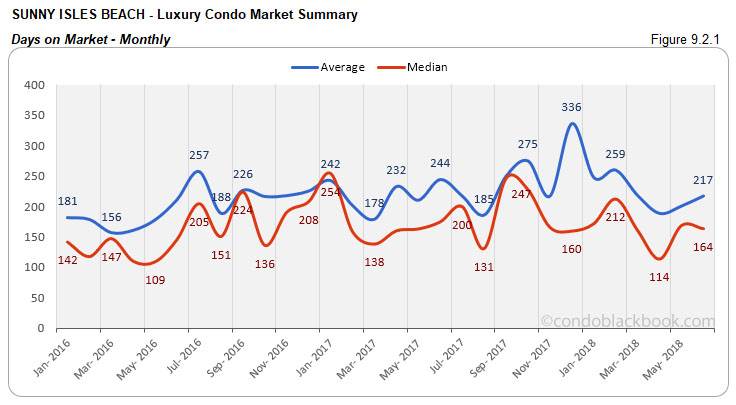
Days on market down 5% QoQ and 3% MoM. Luxury condos took 9 days lower than Q1 to go off the market and 5 days lower month-to-month. This shows that buyers and sellers were able to reach a consensus sooner this quarter in Sunny Isles Beach. (see fig. 9.2 and 9.2.1 below)
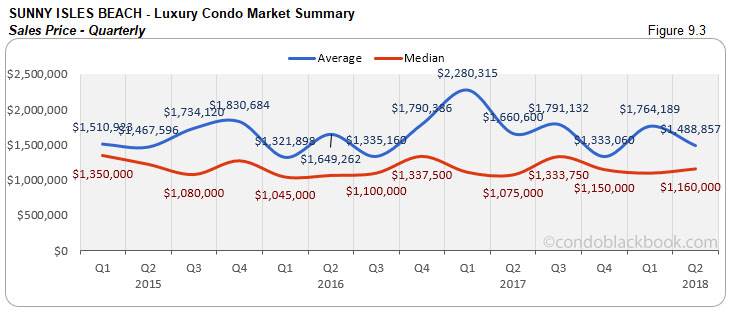
Q2 prices up, as June prices deflate YoY. Q2 reports an 8% increase in the year-over-year median sales price. On the other hand, June posts an 8% decrease in the year-over-year median price. This closes the median price per sq. ft. at $589 for the second quarter. (see fig. 9.3, 9.3.1, 9.4 and 9.4.1 below)
Inventory posts 2% reduction. There is a 2% month-on-month and 13% year-over-year reduction to report in Sunny Isles Beach. At 48 months, inventory is still ways off the 9-12-month mark of a balanced market. This again presents buyers with an ample window of opportunity to strike advantageous deals as they search Sunny Isles Beach condos for sale here or begin by exploring the lifestyle options here.
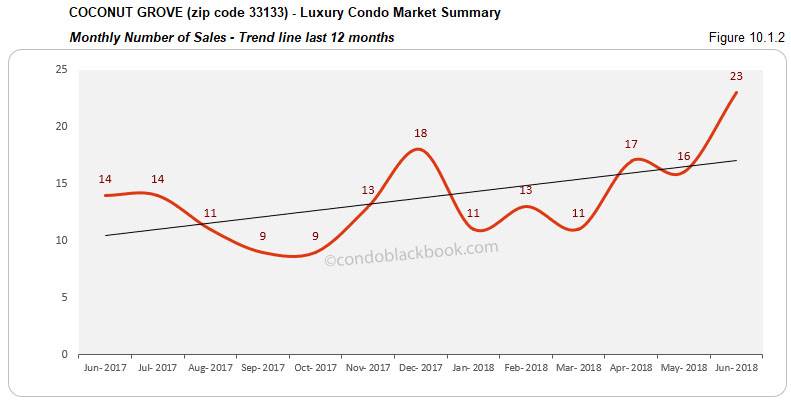
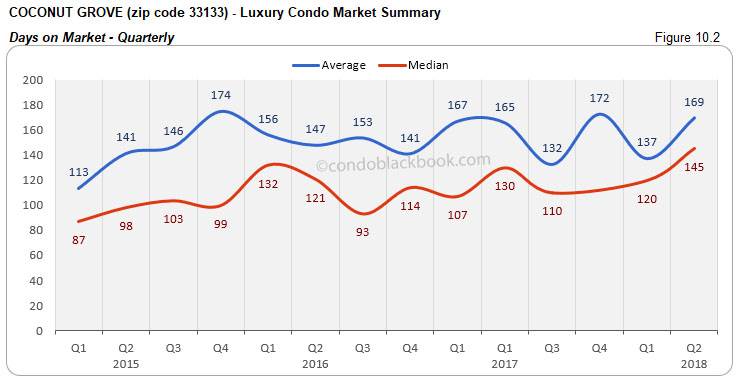
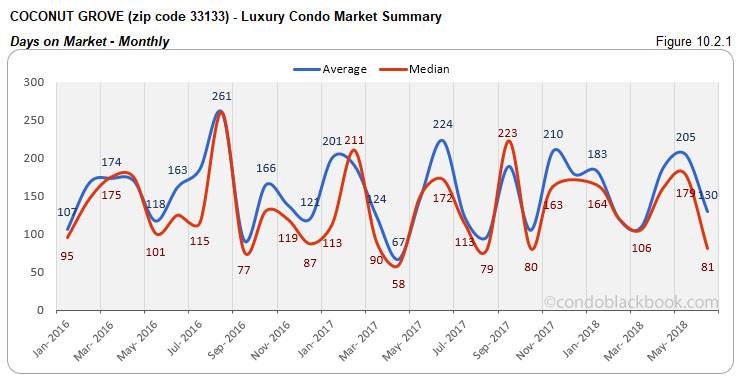
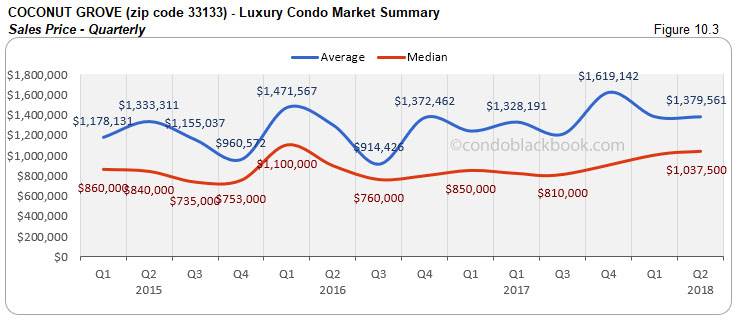
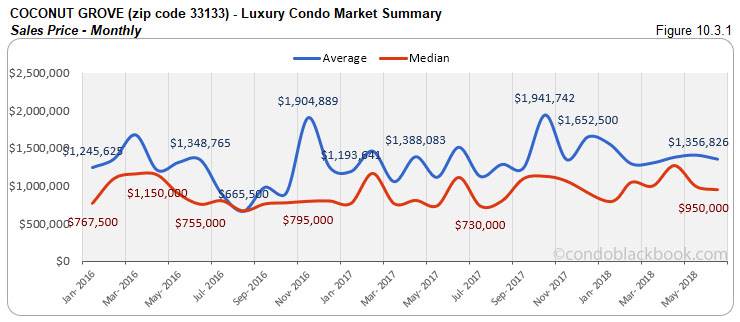
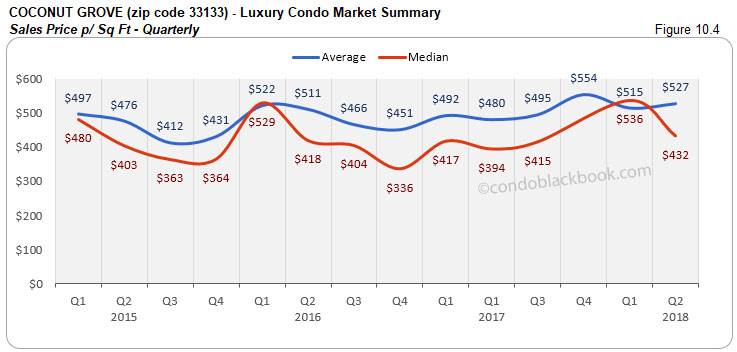
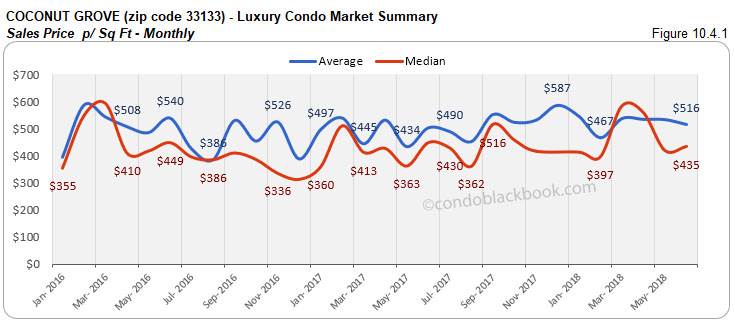
Coconut Grove Luxury Condo Market Summary (33133 zip) back to top
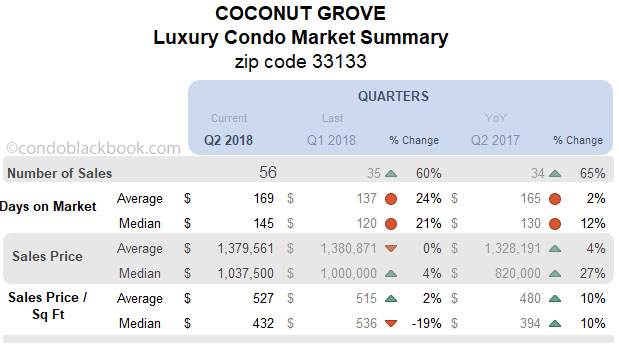
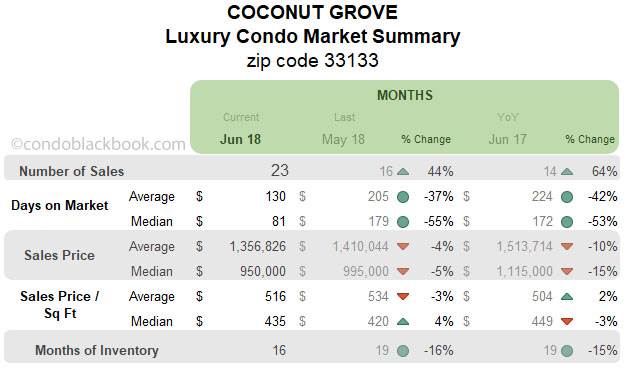
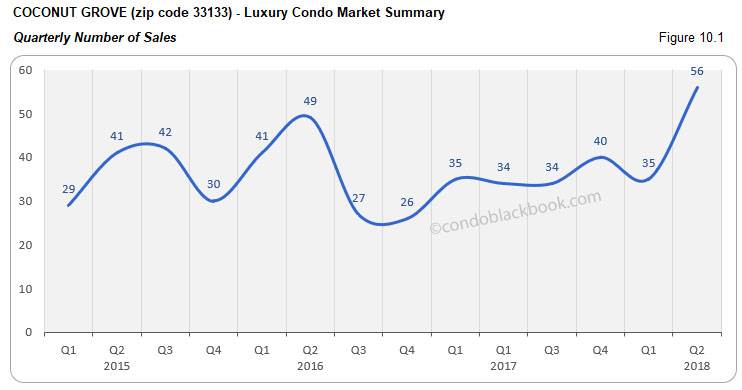
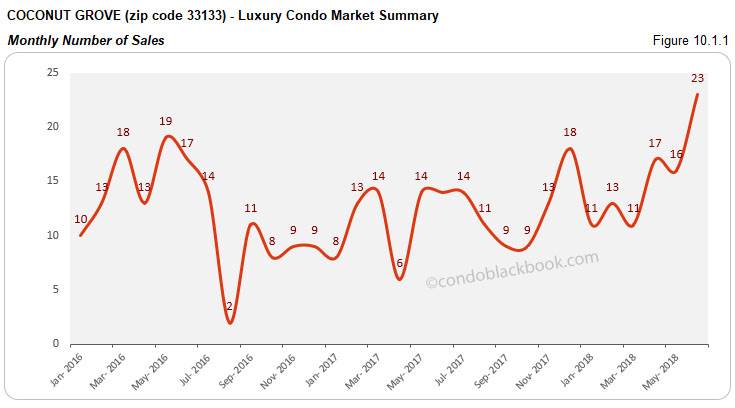
Quarterly and monthly sales soar for positive trend line. The market dynamic in Coconut Grove has been the most interesting to follow these past few months. This quarter, we see the neighborhood report 60% higher sales than Q1 and 65% more sales compared to same quarter last year. Even June came in with a 44% increase over May and 64% year-over-year increase in numbers (fig. 10.1.1). This makes it the only district to beat all of its past 3 year’s sales records by posting higher numbers than the best of 2017, 2016 and 2015 (fig. 10.1). The soaring trend line of fig. 10.1.2 perfectly illustrates this intensifying momentum.
Days on market up 21% QoQ but reduce 55% MoM. Luxury condos in Q2 took 25 days longer (on median) than Q1 to move off the market. However, June posts a reduction of 98 days (on median) against May, showing better consensus between buyers and sellers. (see fig. 10.2 and 10.2.1 below)
Quarterly prices inch up, even as June prices decline YoY. We see a 15% decline in the month-on-month median sales price this June. However, Q2 closed with a 27% year-over-year increase in its median sales price. This saw the median price per sq. ft. for Q2 closing at $432. (see fig. 10.3, 10.3.1, 10.4 and 10.4.1 below)
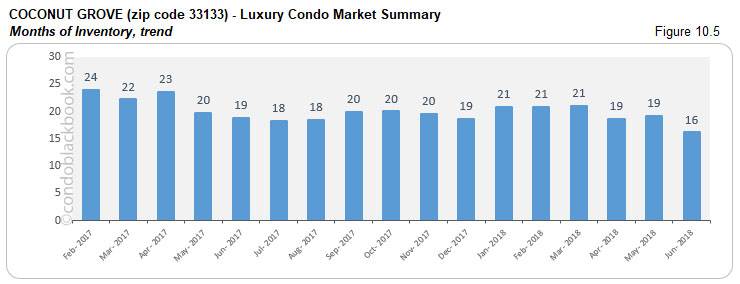
Inventory drops 16%. Fig. 10.5 shows a 16% drop in month-to-month inventory and a 15% year-over-year decline. At 16 months, this district is the closest to reaching the ideal 9-12-month mark of a balanced market. Buyers should make their move now to grab deals by searching Coconut Grove condos for sale here, or check out what lifestyle makes this vibrant neighborhood so dynamic here.
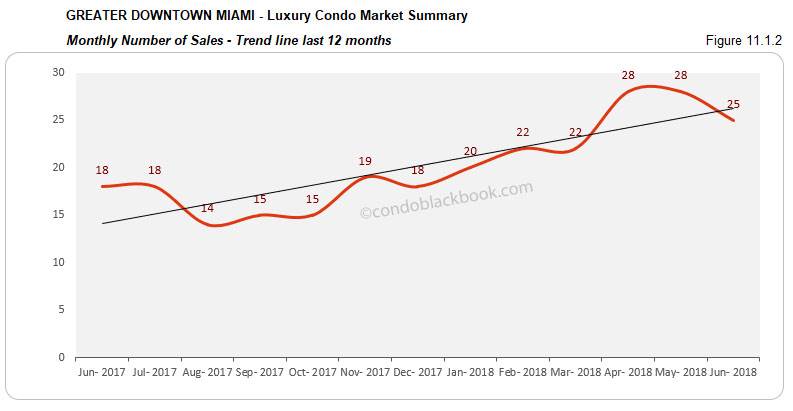
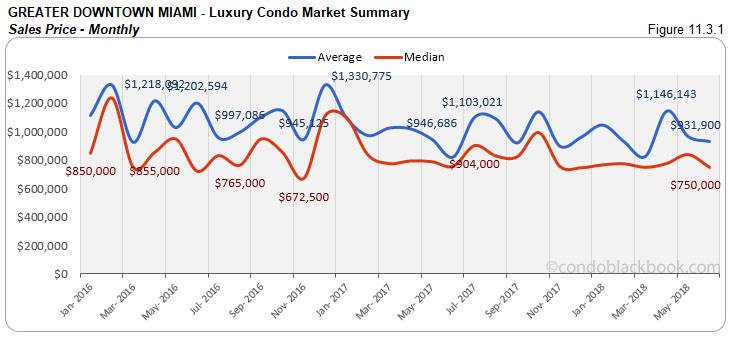
Greater Downtown Miami Luxury Condo Market Summary (33129, 33130, 33131, 33136, 33137 zips) back to top
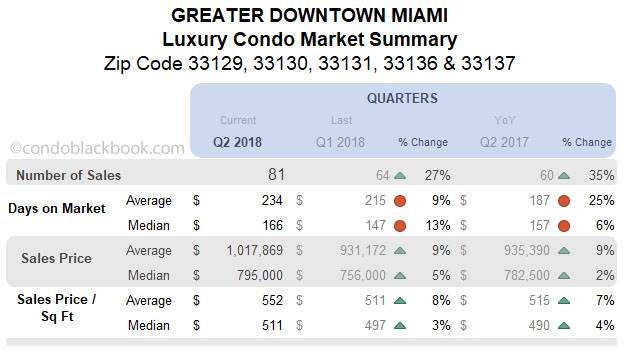
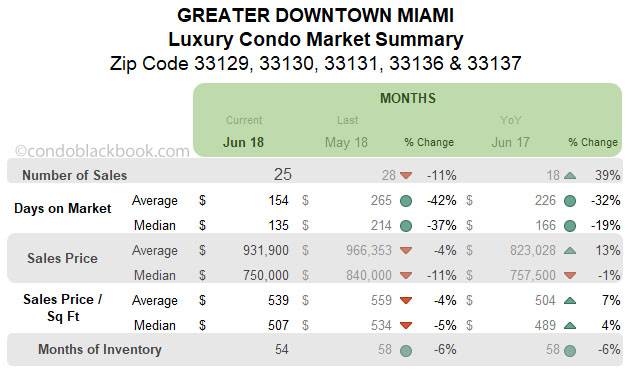
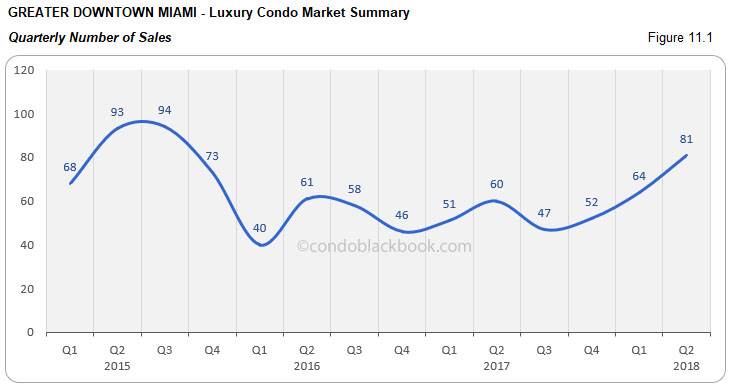
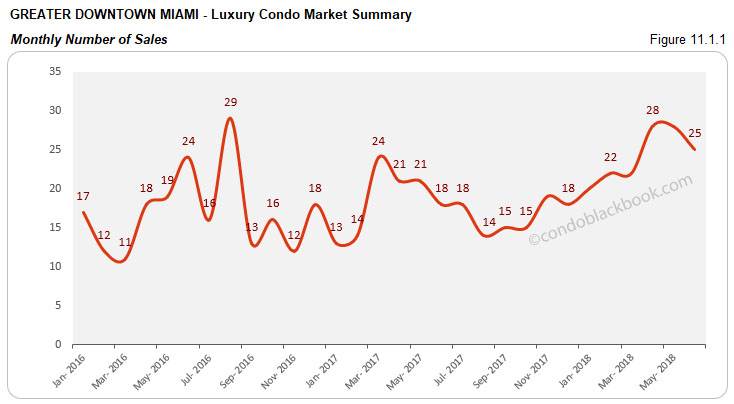
Quarterly sales and trend line soar as monthly sales hold up YoY. Q2 closes with 27% higher sales against Q1 and 35% more sales than same quarter last year (fig. 11.1). This is higher than 2016 and 2017’s Q2 peak. June’s sales dip 11% against May but are still 39% higher year-over-year (fig. 11.1.1). This gives us a positive trend line for the Greater Downtown Miami area in fig. 11.1.2 below.
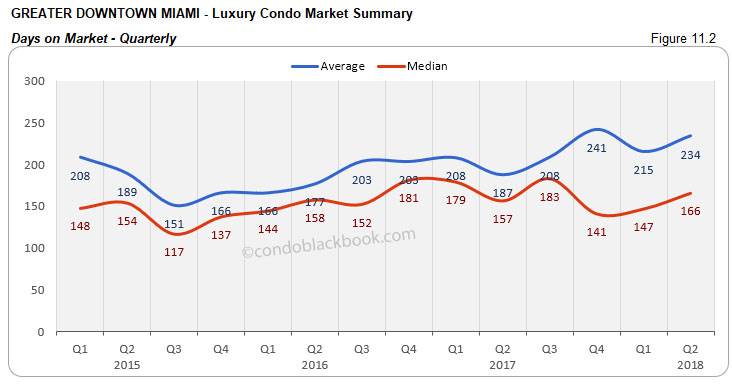
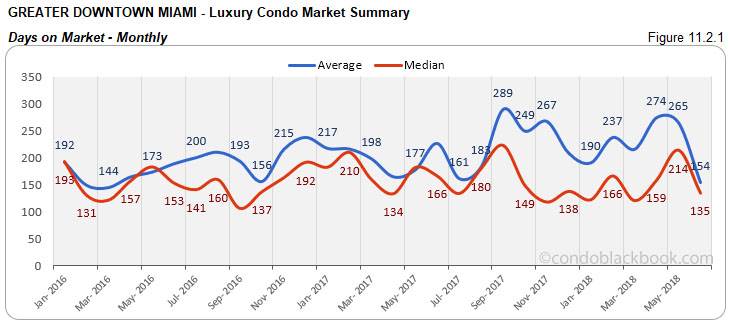
Days on market increase 13% QoQ but drop 37% MoM. Luxury condos in Q2 took 19 more days (on median) to get off the market compared to Q1. However, June came in with a reduction of 79 days (on median) against May, showing better dialogue between buyers and sellers. (see fig. 11.2 and 11.2.1 below)
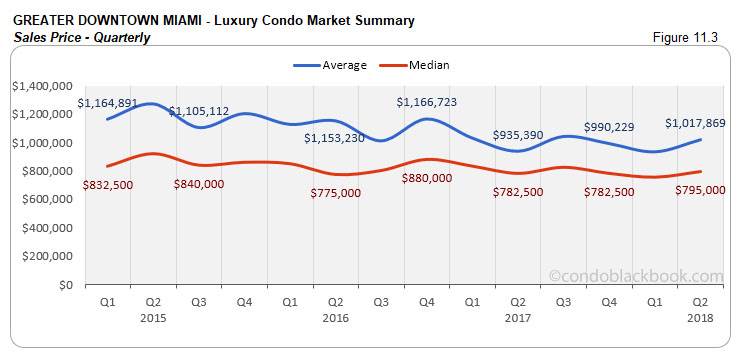
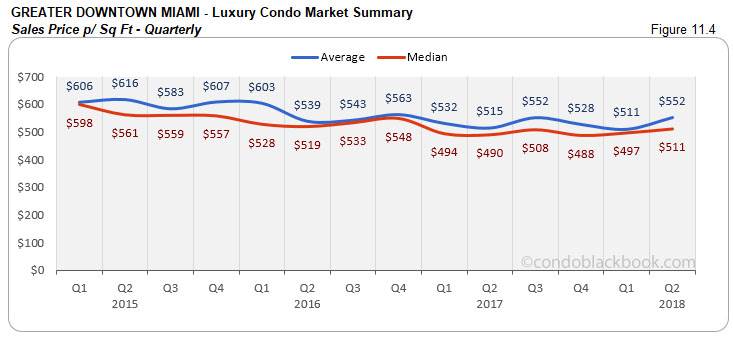
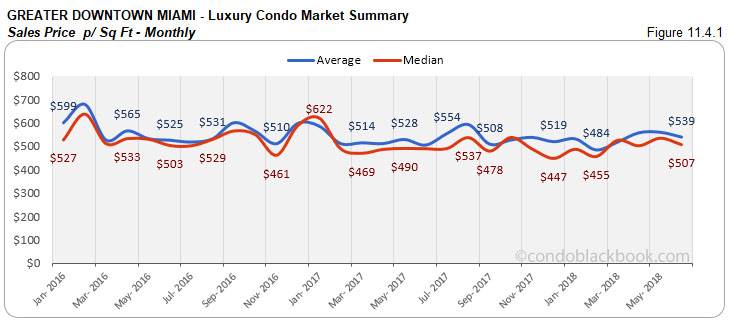
Quarterly and monthly prices hover YoY. We see Q2 and June’s median sales prices report only a +/- 2% change year-over-year. This sees the median price per sq. ft. close at $511 for the second quarter. (see fig. 11.3, 11.3.1, 11.4 and 11.4.1 below)
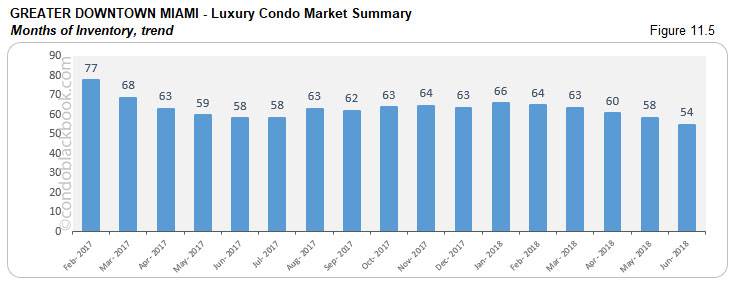
Inventory reduces 6%. GDM’s inventory continues its gradual descent in June, posting a 6% decline both month-on-month and year-over-year. At 54 months, inventory is still far away from reaching the 9-12-month mark of a balanced market. This gives buyers a big window of opportunity to search the Greater Downtown Miami area here for some amazing deals.
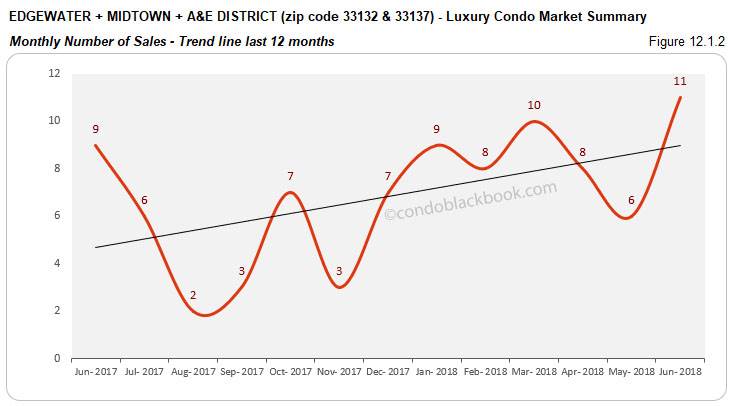
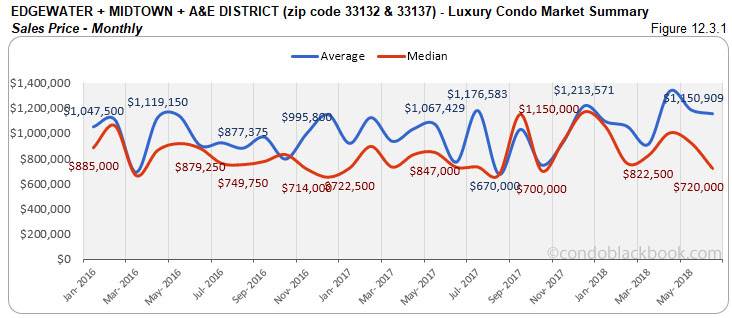
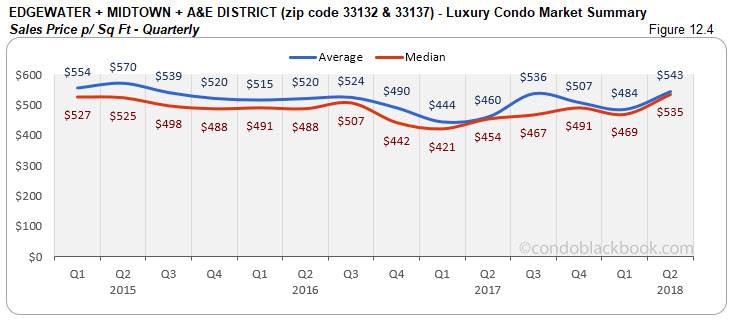
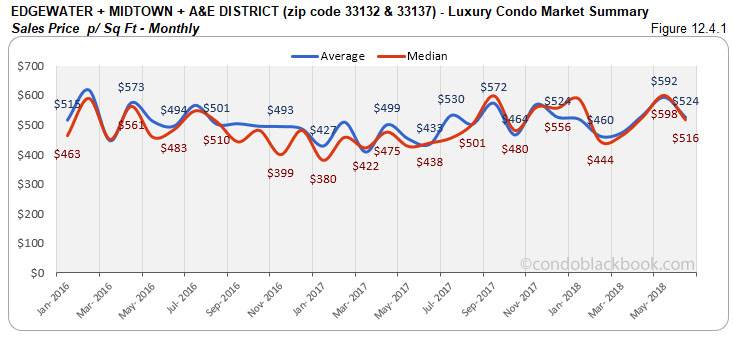
Edgewater + Midtown + A&E District Luxury Condo Market Summary (33132 + 33137 zip) back to top
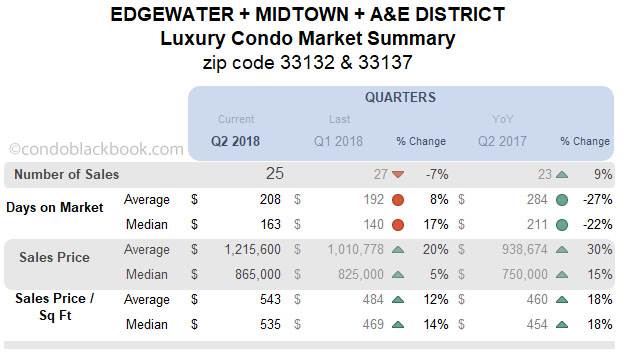
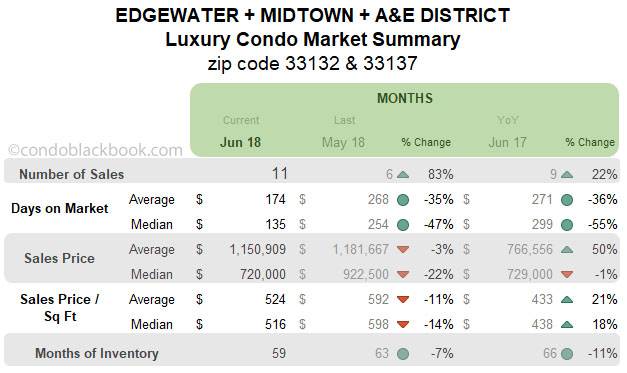
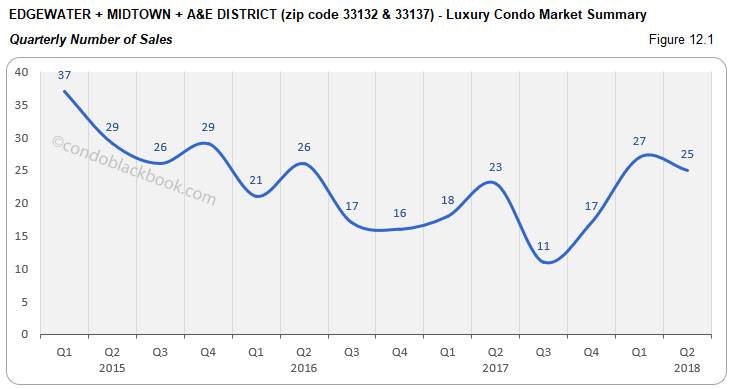
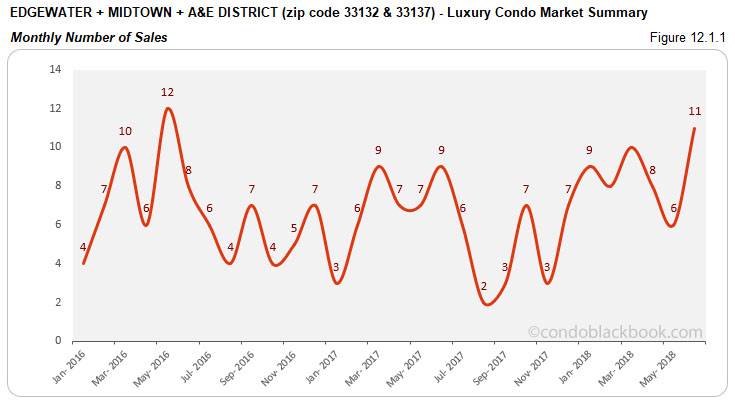
Quarterly sales slack, but monthly numbers and trend line stay positive. Sales in Q2 fall 7% short of Q1’s numbers, but still post a 9% increase year-over-year (fig. 12.1). On the other hand, June delivers an 83% improvement over May and 22% increase year-over-year (fig. 12.1.1). This makes the trend line in fig. 12.1.2 keep its ascension.
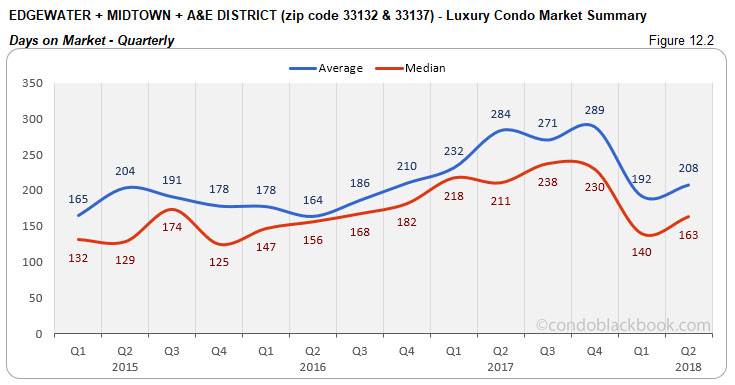
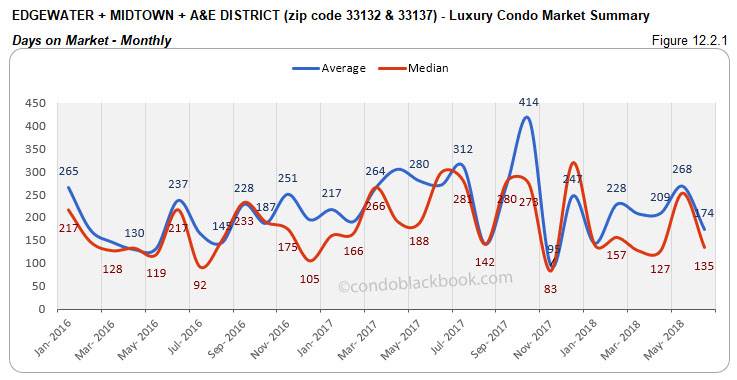
Days on market up 17% QoQ but drop 47% MoM. Luxury condos in Q2 took 23 days longer (on median) to get off the market compared to Q1. However, June saw a reduction of 119 days (on median) against May, indicating buyers’ and sellers’ desire to reach a consensus sooner. (see fig. 12.2 and 12.2.1 below)
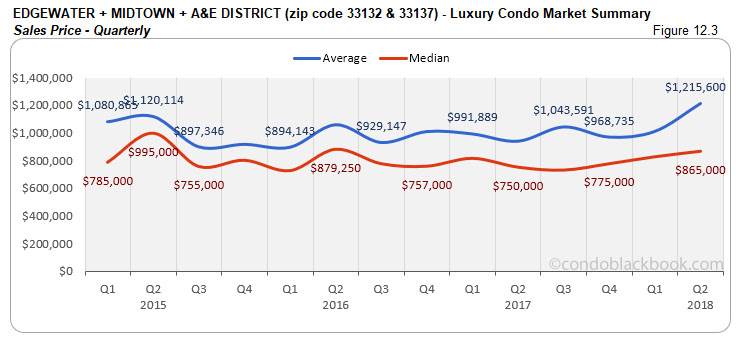
Quarterly prices move higher YoY. We see the median sales price go up 15% year-over-year this second quarter. Even the price per sq. ft. for Q2 closes 18% higher than last year at $535 for the grouping. (See fig. 12.3, 12.3.1, 12.4 and 12.4.1 below)
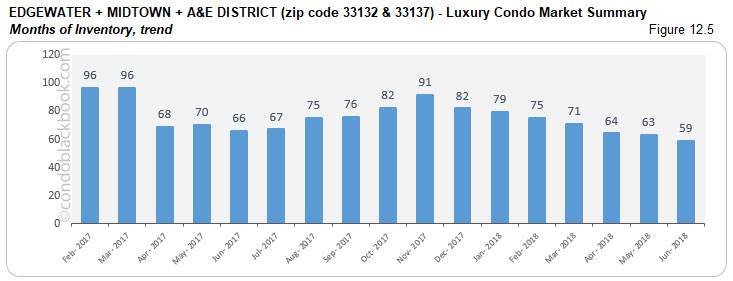
Inventory declines 7%. Adding another month to its 6-month-long downward trek, inventory in this grouping reduced 7% month-on-month and 11% year-over-year. At 63 months, this is one of the slowest moving markets in our study, and furthest from reaching the 9-12-month ideal of a balanced scenario. Buyers definitely have the upper hand in negotiations and should browse through Edgewater condos for sale here or begin by exploring the individual lifestyle and condo options in Edgewater, Midtown and Arts & Entertainment District.
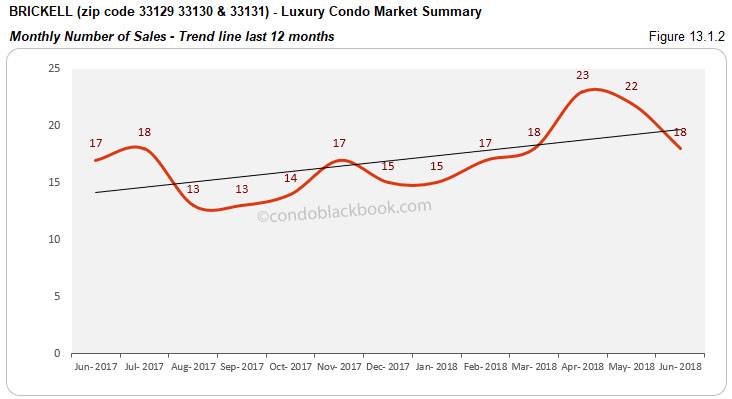
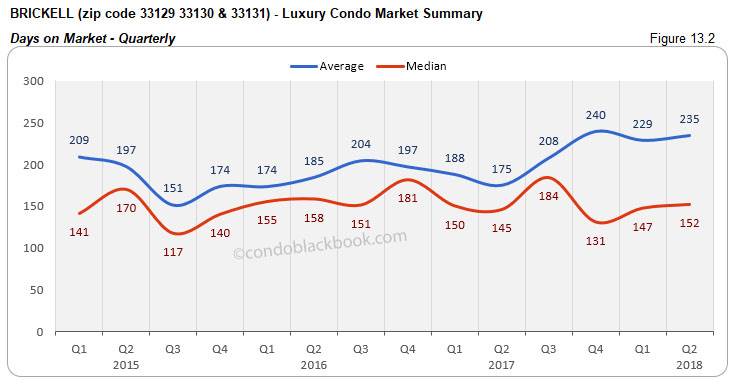
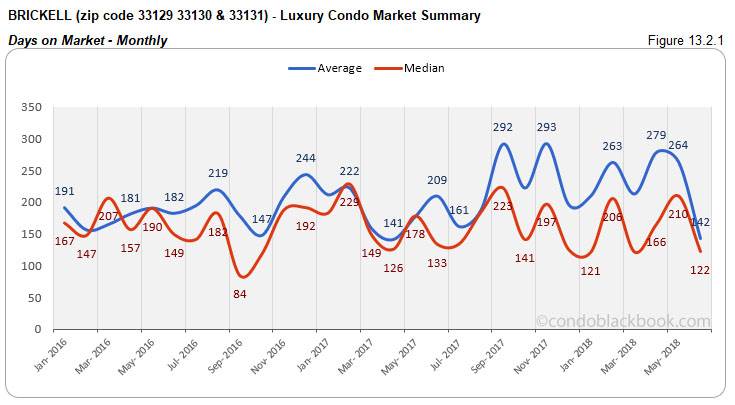
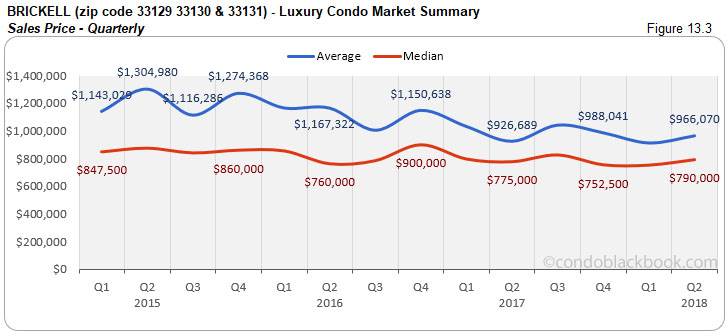
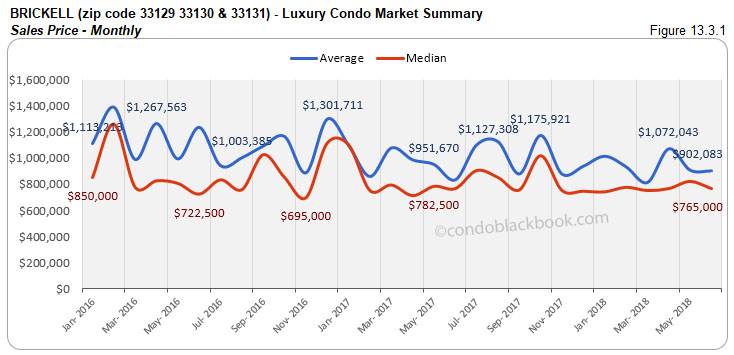
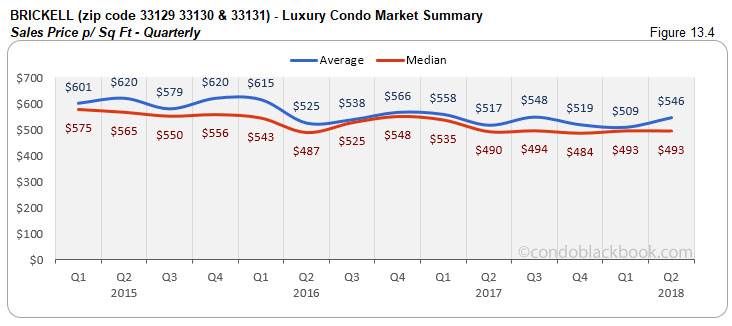
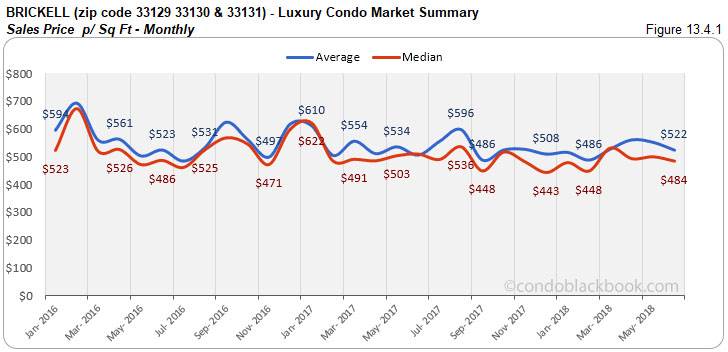
Brickell Luxury Condo Market Summary (33129, 33130, 33131 zip) back to top
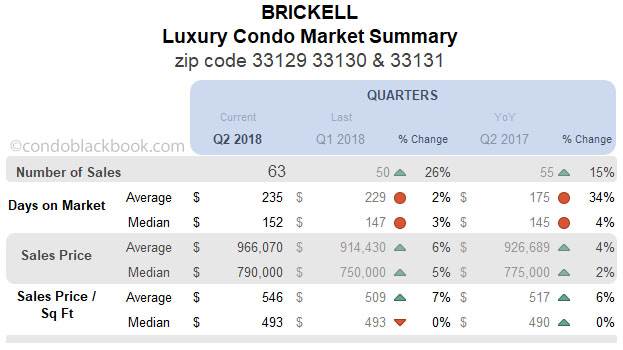
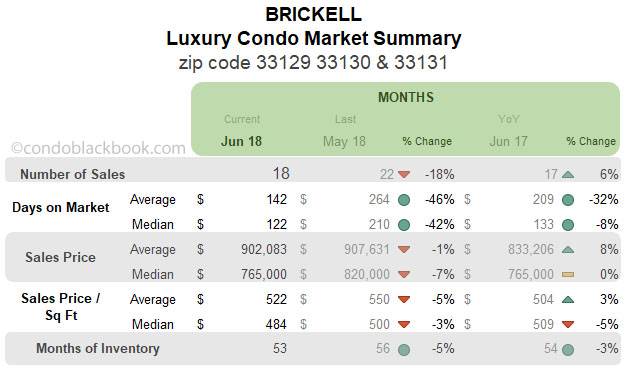
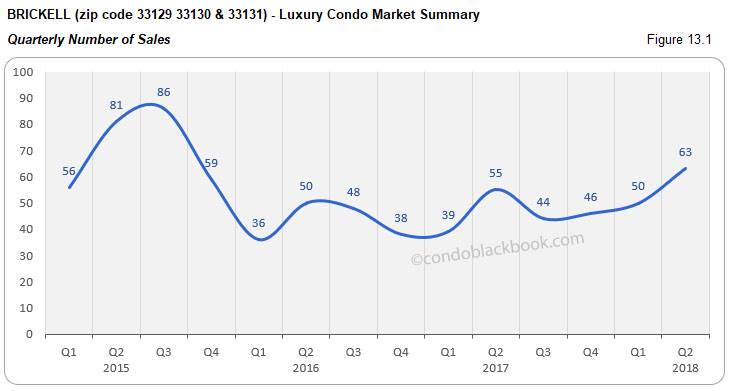
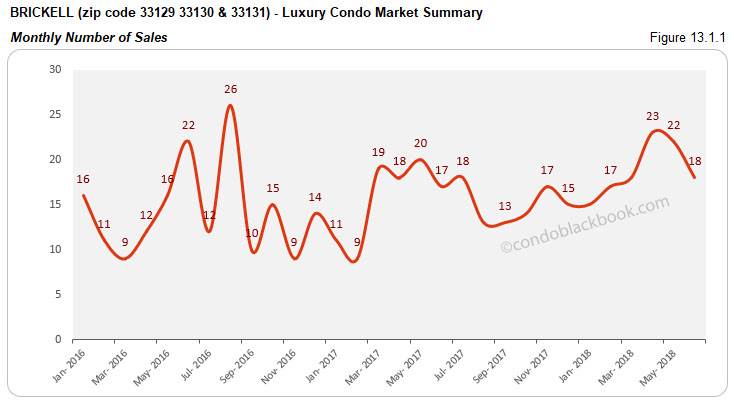
Q2 sales and trend line soar, monthly numbers slip slightly. Q2 reports 26% higher sales compared to Q1, 15% more sales than Q2 2017 and higher numbers over 2016’s peak as well (fig. 13.1). June posts an 18% month-on-month decline, but a 6% increase in year-over-year trends (fig. 13.1.1). This helps keep a positive trend line in fig. 13.1.2.
Days on market up 3% QoQ but drop 42% MoM. Luxury condos in Q2 took 5 days longer (on median) than Q1 to move off the market. However, June came in with a steep decline of 88 days (on median) against May, showing better dialogue between buyers and sellers. (see fig. 13.2 and 13.2.1 below)
Miniscule variation in YoY prices. Brickell reports an upward shift of 2% year-over-year on its median prices in Q2. June had no change to report in its year-over-year median prices. This saw the median price per sq. ft. close at $493 for this business district. (See fig. 13.3, 13.3.1, 13.4 and 13.4.1)
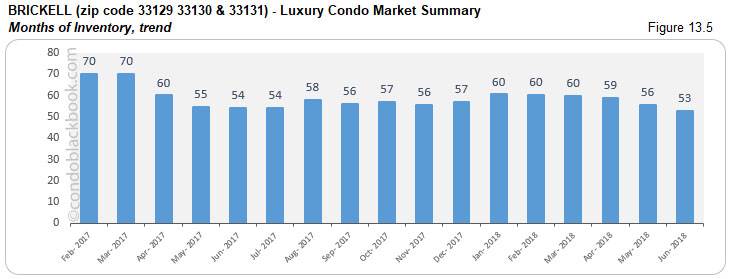
Inventory reduces 5%. There is a 5% decline in month-to-month and 3% reduction in year-over-year inventory to report. At 53 months, the inventory is still way off the ideal 9-12-month mark of a balanced market. This gives buyers ample opportunity and choices to drive deals in their favor, as they search Brickell condos for sale here or take a tour through Brickell here.
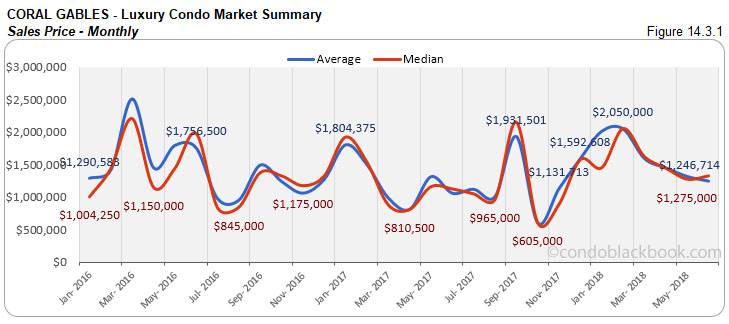
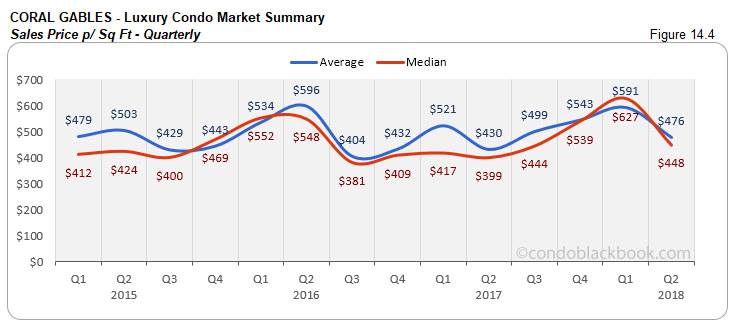
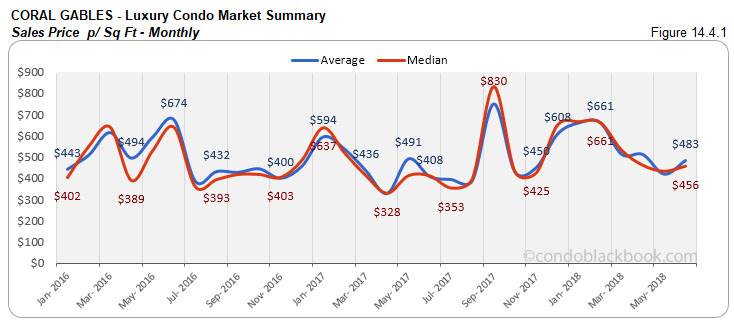
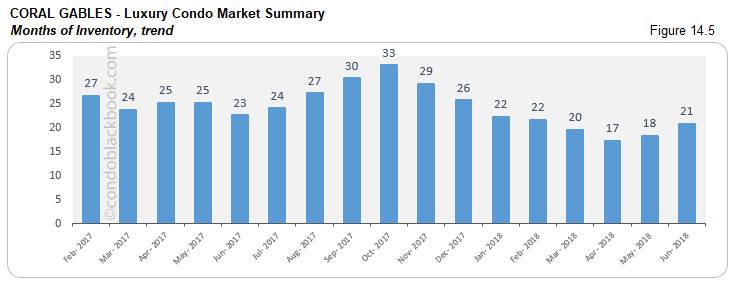
Coral Gables Luxury Condo Market Summary back to top
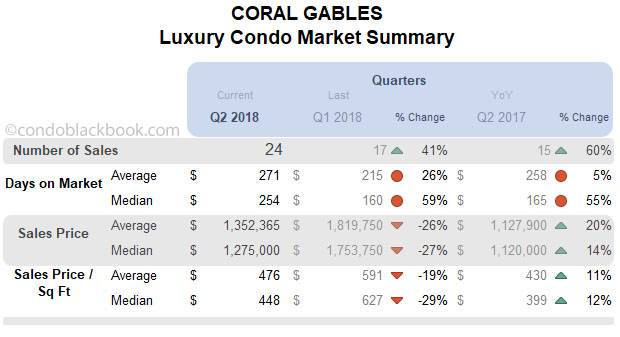
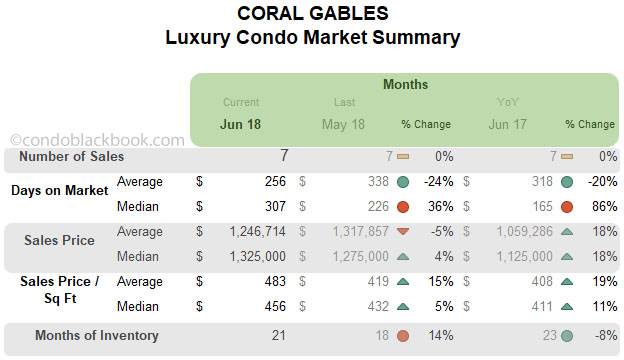
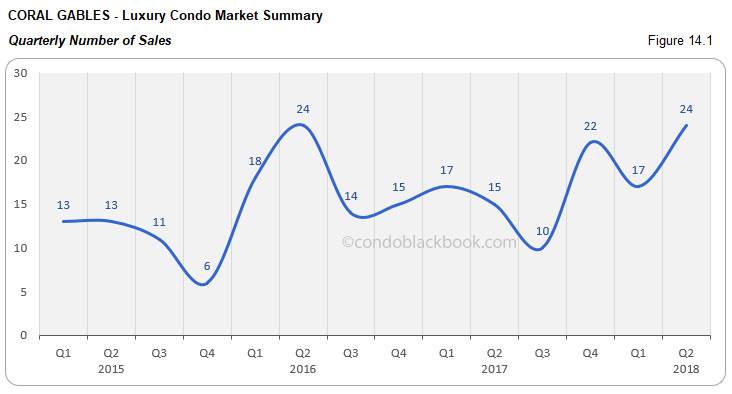
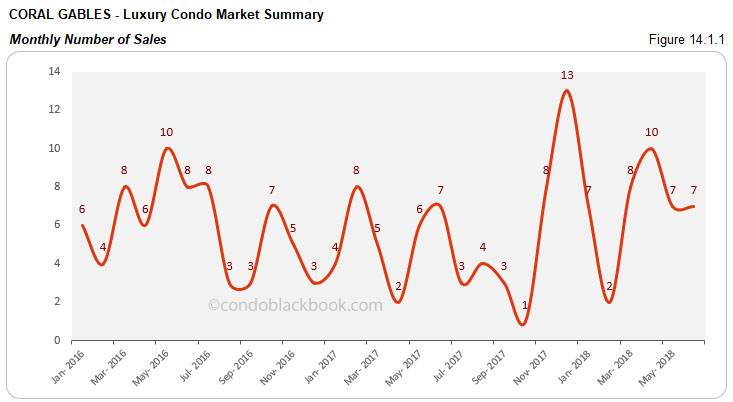
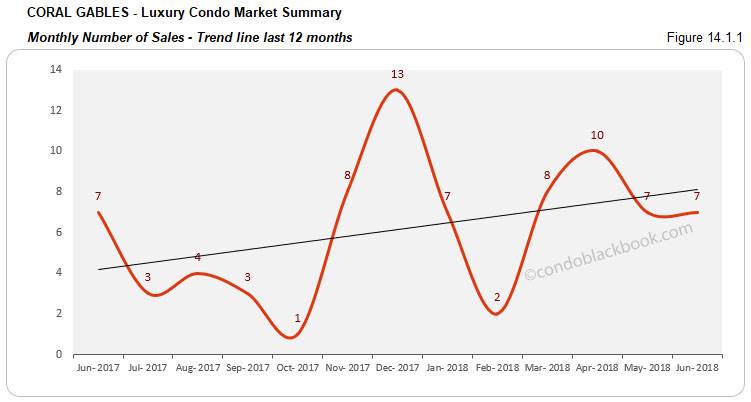
Positive quarterly and monthly sales keep up trend line. Q2 delivers a 41% sales boost against Q1 and 60% boost year-over-year. This is also higher than 2016 and 2015’s peak levels (fig. 14.1). June 2018’s sales match May and June 2017’s levels (fig. 14.1.1). This helps keep the trend line in fig. 14.1.2 on a positive course.
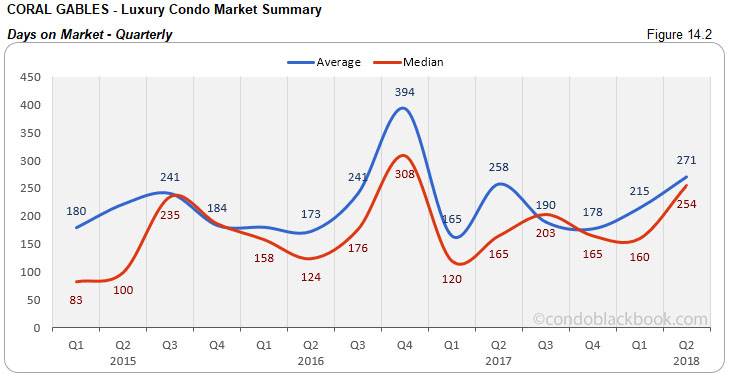
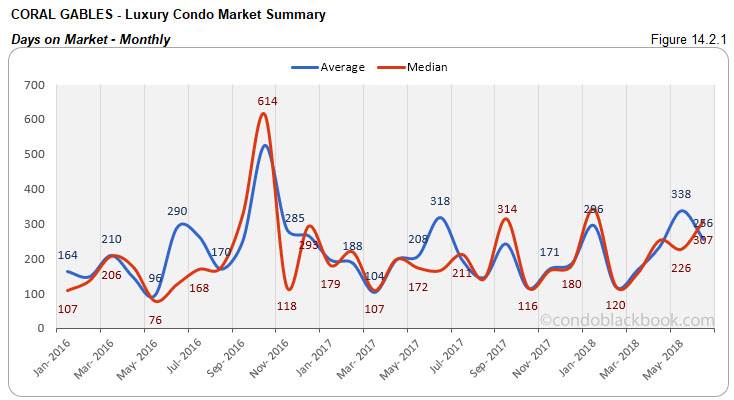
Days on market up 59% QoQ and 36% MoM. Luxury condos took 56 more days to move off the market in Q2 compared to Q1, and 81 days longer month-to-month. This goes to show that buyers and sellers took much longer to come to a consensus in Coral Gables. (see fig. 14.2 and 14.2.1 below)
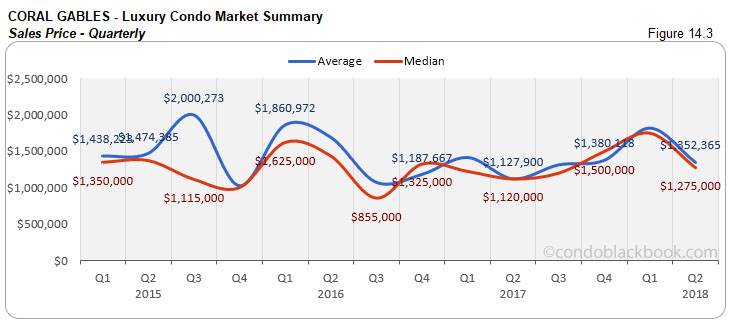
Quarterly and monthly prices post uptick YoY. Q2 reports a 14% increase in the year-over-year median prices. June too posts an 18% increment in the year-over-year median prices. The second quarter closed at a $448 per sq. ft. median price in Coral Gables. (See fig. 14.3, 14.3.1, 14.4 and 14.4.1)
Inventory retracts 14%. We see a 14% increase in the month-to-month inventory after May’s sharp decline. However, this is still 8% lower than June 2017 levels. At 21 months, Coral Gables is one of the closest to achieving the ideal 9-12-month mark. With trends shifting towards a balance, buyers should be quick to grab deals by searching Coral Gables condos for sale here, or should start by checking out the lifestyle options in Coral Gables here.
Conclusion back to top
We are not out of the woods yet in terms of high inventory, but steady growth could soon bring back balance. Buyers should take cue and work on finalizing deals at current levels. We’ve seen the market largely in favor of buyers for over two years now. However, judging on the current momentum gained over the last 6 months, we see signs of good momentum in the luxury condo market. With a seasonal correction expected over the next two quarters, we still expect the market to close 2018 on a strong note. Even inventory levels have been shrinking consistently, hitting new lows this second quarter.
Love what you see? Don’t forget to share our blog and subscribe (see the subscribe link on the top menu) to receive the latest market news in your inbox.
Have any questions? Or see something wrong with the stats? Please contact Sep at sniakan (at) hbroswell.com or call 305-725-0566.
Share your thoughts with us

Your Miami Condo Awaits
Recent Posts


 (305) 697-7667
 (786) 321-7233
  contact@condoblackbook.com

