Miami Luxury Condo Report Overall Market Summary
City and Neighborhood Luxury Condo Reports
Miami Beach Luxury Condo Report
South Beach Luxury Condo Report
Bal Harbour Luxury Condo Report
Sunny Isles Beach Luxury Condo Report
Coconut Grove Luxury Condo Report
Greater Downtown Miami Luxury Condo Report
Edgewater / Midtown / A&E District Luxury Condo Report
Coral Gables Luxury Condo Report
Miami Luxury Condo Market Report: Summary
Looking to buy or sell a luxury condo in Miami? Get all your facts and figures right with our detailed monthly report and analysis below for a strong pulse of the Miami luxury condo market.
For the purpose of this report, we’ve only considered condos priced above $600,000. You can browse through or read in-depth to help plan your next move.
Overall Market Highlights:
- Quarterly and monthly sales volume take an impressive leap this March.
- Properties still sitting on the market longer than usual with March’s median ‘days on market’ hitting 172 days
- Three $8 million+ sales (on top of February’s three) inflate sales price and price/sq. ft. averages. Second month in a row of strong ultra-luxury sales. Could it mean that the uber rich are back with a vengeance?
- With 44 months of inventory on hand, buyers can rejoice that they have big selection and strong negotiating power; on the other hand, sellers need to be flexible and/or patient.
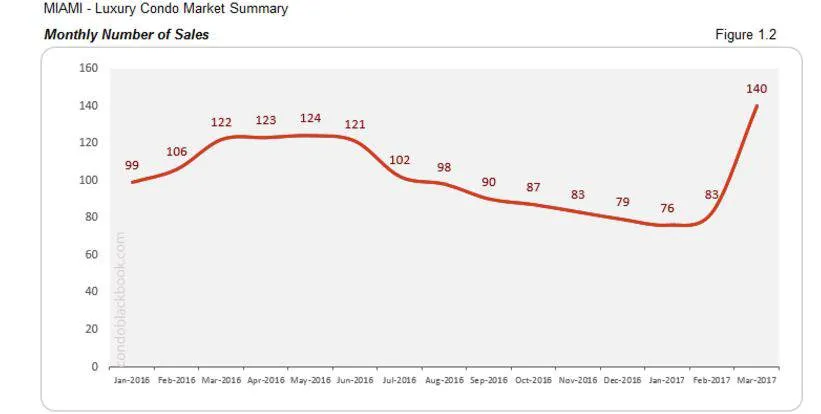
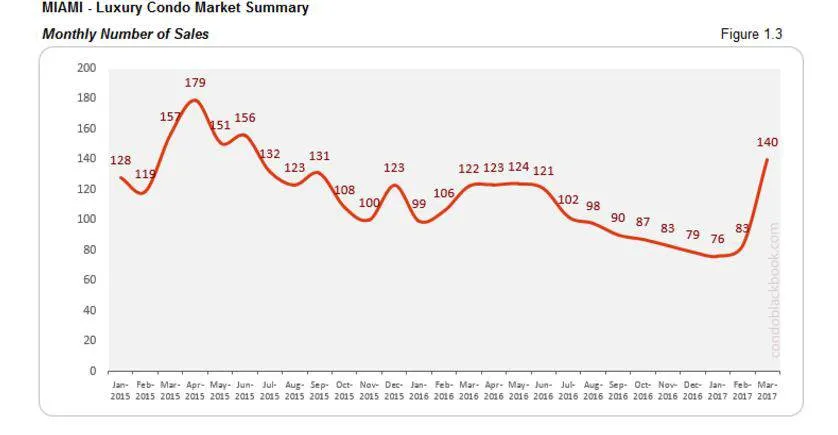
Big uptick in luxury condo sales volume. The month of March is showing a shift in trends for our luxury condo market. Overall sales have made a sharp upturn (fig. 1.2), picking up where February left off. March historically makes a strong showing in sales volume, but the uptick this March was especially sharp. The question is whether this is a sign of increased demand or simply a blip due to especially slow past couple of quarters.
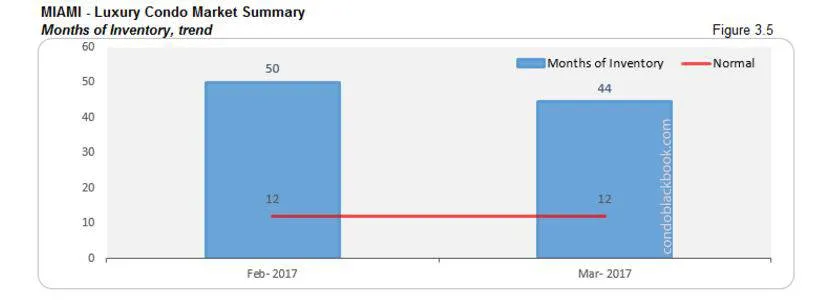
Months of inventory dipped, but still historically high. This sudden boost did bring down the overall months of inventory (fig. 3.5); however, it couldn’t influence the days on market that still continue to rise (fig. 2.1).
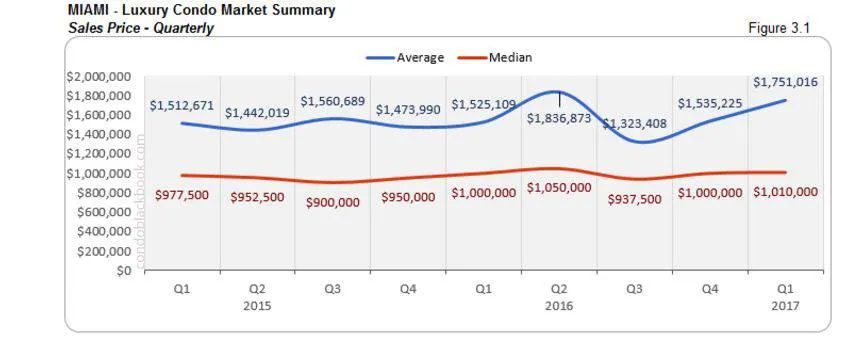
Ultra-luxury sales keep flowing. March (just like February) posted three ultra-luxury sales above $8 million in Sunny Isles Beach, Bal Harbour and Miami Beach. Being in a buyer’s market, you’d expect sales prices to fall, but those sales inflated overall price trends (fig. 3.1).
Overall, I’d say March did post some great trends, but what remains to be seen is if this momentum will be carried into the year. Nonetheless, there’s still plenty of inventory, and buyers should make the most of this opportunity by grabbing some great luxury condo deals.
How Did We Land Into Pent Up Inventory And A Buyer-Driven Market, and Where Do We Go From Here?
Inventory - Don’t Blame Pre-construction
A lot of people love blaming new constructions for injecting more inventory into the luxury condo market, however, that’s just the tip of the iceberg. It’s not ‘how much’ inventory is being added to the market, but the slower pace at which it’s moving out at as compared to recent years. The real reason why the scales have tipped in favor of buyers is due to this steady build-up of inventory over time. Read on to find out why.
Strong U.S. Dollar = Shy Key International Buyers
The strengthening U.S. Dollar slowing international buyer demand is one of the main culprits for this inventory build-up. Now, a strong dollar is definitely good news for us, but not out our key international buyers who’ve been driving our real estate growth. The dollar has gone up by a significant 20-40%+ against Euro and Latin American currencies such as the Brazilian Real and the Colombian Peso. A strong dollar led to weakened buying power, which further led to weakened demand for Miami (and U.S.) real estate.
Feeling Zika’s Sting
Although the Zika virus scare may have come and gone, but it surely left its mark. People, local businesses and the market, all were left with less tourism and thus less real estate sales last summer that had lasting market effects that are just wearing off.
Recovering from Contentious Presidential Elections
The elections usually impact real estate, no matter who the candidates are. Considering this time’s election was exceptionally controversial, it seems most people decided to wait it out before making big-ticket real estate decisions. Post-election months have shown an uptick in sales numbers as well as average sales prices, visible in both the quarterly and monthly market summary charts below.
Strong Stock Market
Since election day the stock market has seen a very nice upswing. That may have given the wealthy evermore reason to finally move forward with buying their dream second home (condo) in Miami.
What remains to be seen is if March’s sudden surge will continue through 2017 and finally get Miami’s luxury condo market out of the rut.
Look below for an insight into Miami’s overall and neighborhood-level luxury condo trends and numbers for March 2017:
Monthly Number of Sales - Miami Luxury Condo Market Overall
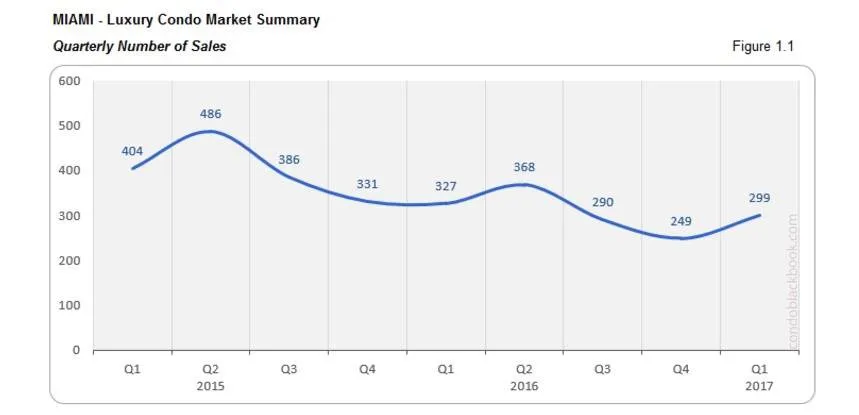
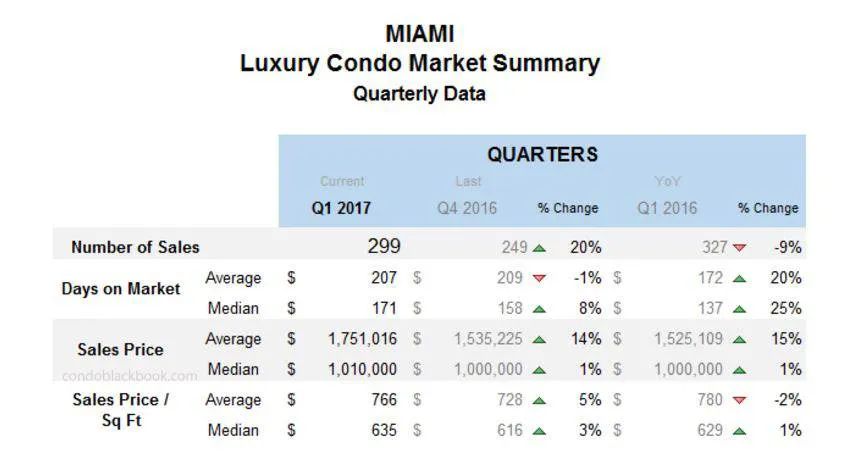
- After several quarters of declining sales the Miami luxury condo market may be finally ready for a rebound, as this quarter closes with 20% more sales than the previous.
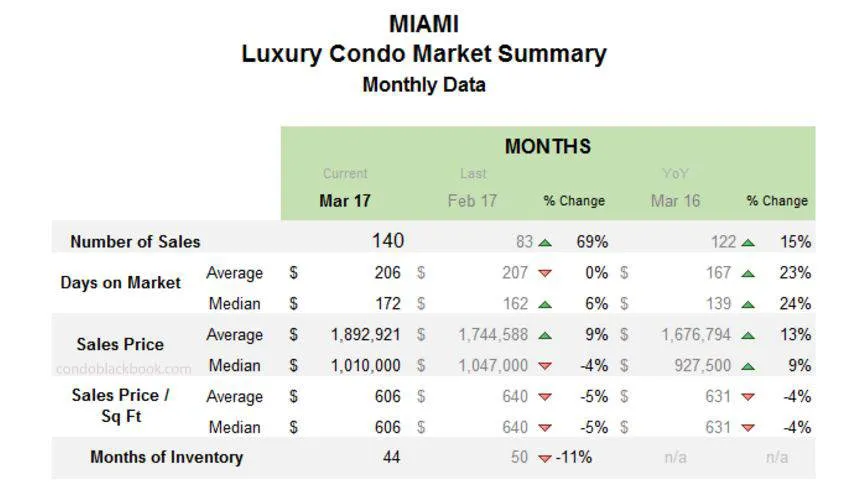
- This increase gets more apparent in the monthly chart of fig. 1.2 that traces the decline over the past year, then picks up with February and makes an impressive jump in March. That’s a 15% increase in sales year-over-year.
- Though it’s not unusual to see a spike in numbers for March and April, this year’s jump in March is significantly higher than usual (See figure 1.2 and 1.3 for comparisons).
Days on Market - Miami Luxury Condo Market Overall
“Days on market” are the total number of days from when a property is active to the day it closes.
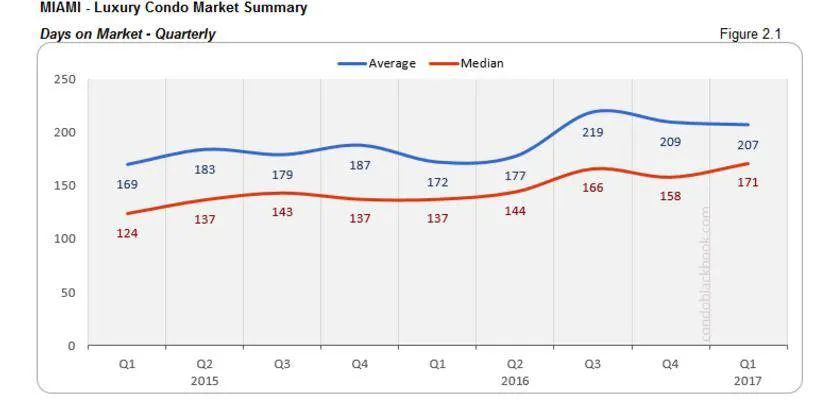
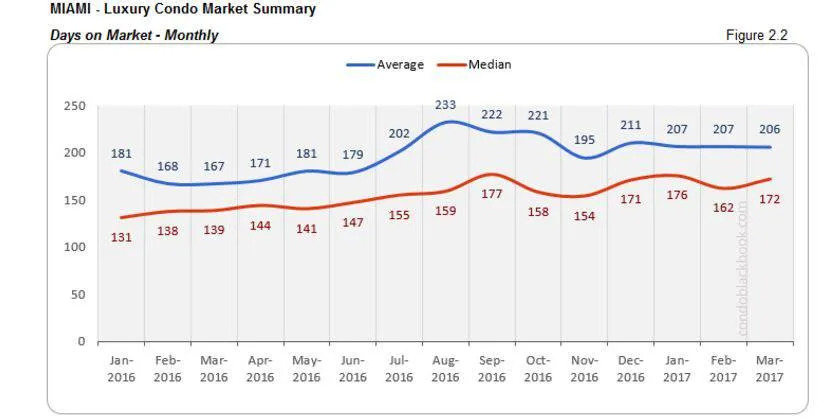
- Overall, the “days on market” continues its upward trek from the last 2 years.
- This means listings continue to take longer to get off the market.
- Only the last quarter of 2016 showed some respite with a slight dip, however, we have the current quarter’s median “days on market” climbing up to 171.
- Monthly data in fig. 2.2 follows suit representing quite a wait for sellers.
Sales Price Trends - Miami Luxury Condo Market Overall
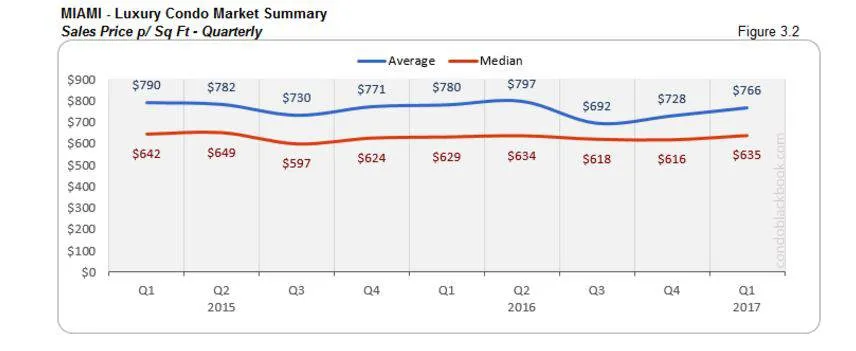
- We still have the quarterly median sales price (fig. 3.1) hovering around the million dollar mark along with the average sales price playing along consistently for the past 2 years.
- However, as March mimics February’s unusual success of three more $8 million-plus sales on the beach, it’s no wonder the average sales price and price/sq. ft. in fig. 3.1 and 3.2 show significant increases.
- On average we only get to see one sale a month in this range. However, this back-to-back success could mean that either the ultra-wealthy are optimistic about the new administration, and/or that business is returning to normal with the elections out of the way.
Inventory Trends - Miami Luxury Condo Market Overall
A balanced market will only have 9-12 months of inventory.
- Miami’s luxury condo market is still sitting on 44 months’ of inventory. There are currently 3.9k active properties on the market, plus another 172 pending. Average of of 83 deals a month (last 6 months’ average).
- 11% decrease from last month in months of inventory, as can be seen in fig 3.5.
- Compared to the 9-12 month normal, we are still in a very strong buyer’s market, giving them utmost control in negotiations. My only advice for sellers right now would be to create a strong unique value proposition for your property, be flexible with your prices, or have a lot of patience until market regains its balance.
City and Neighborhood Market Reports
Miami Beach Luxury Condo Market Summary
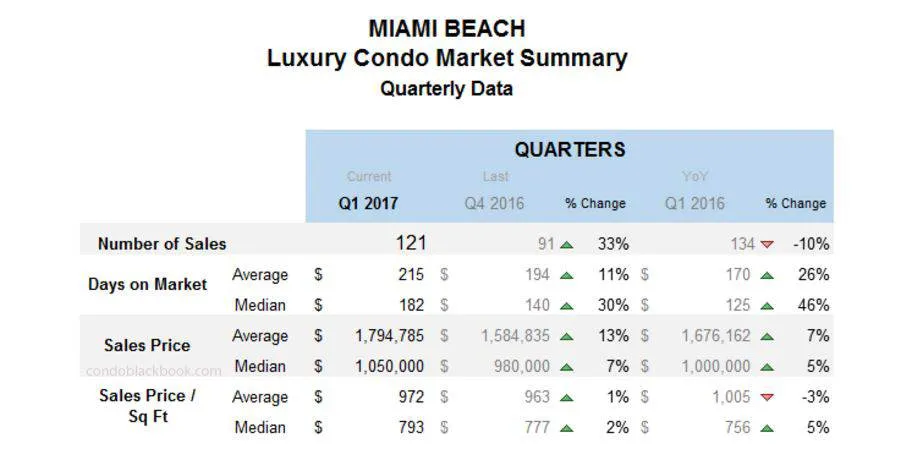
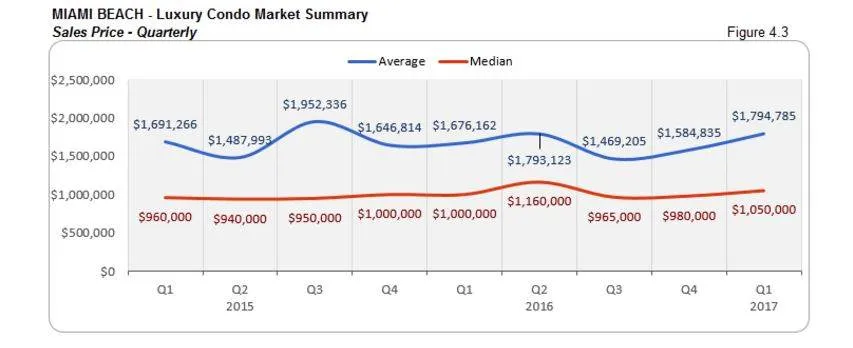
- Miami Beach’s luxury condo trends have been reflective of Miami’s overall trends.
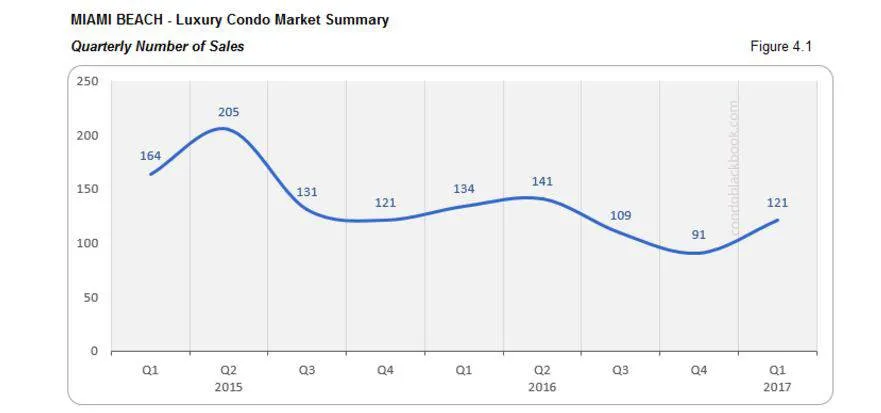
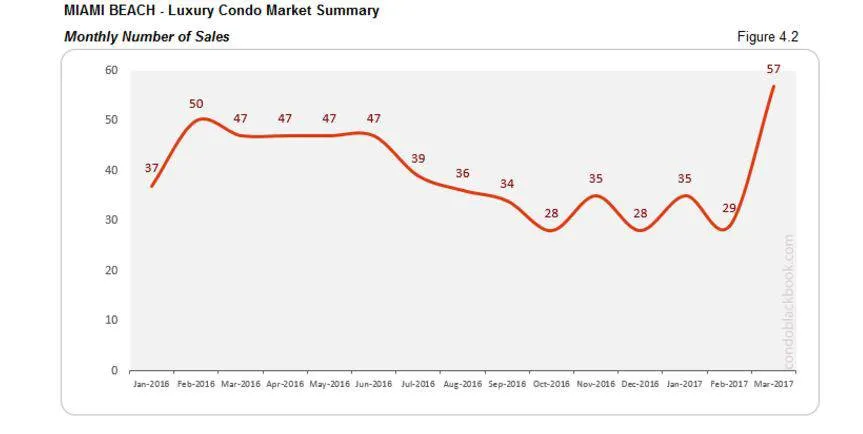
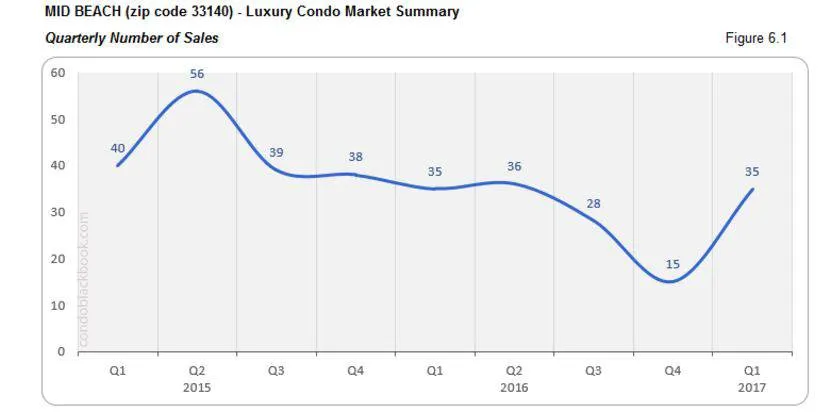
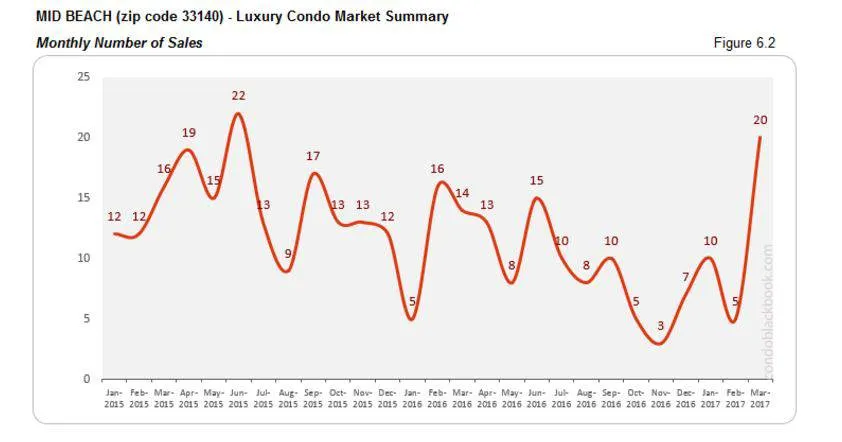
- Big recovery in the first quarter, thanks to a big jump in March sales. Comparing fig. 1.1 with fig. 4.1, it’s easy to see how sales started deteriorating in Q3 2015 overall and for Miami Beach. However, there’s been an impressive recovery this first quarter, thanks to a slight uptick in February followed by a steep jump in March (fig. 4.2). It will be interesting to see if this positive streak can be maintained in the coming months.
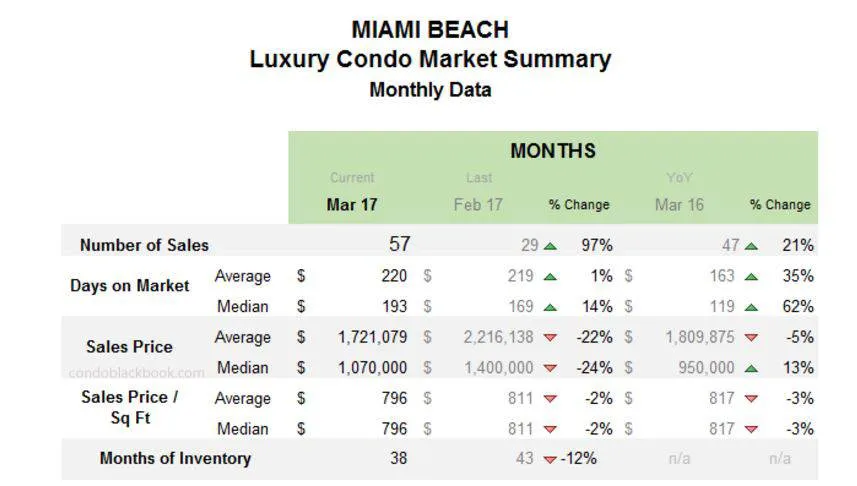
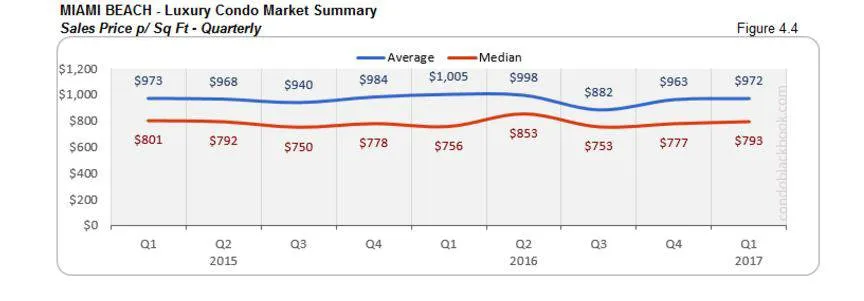
- $8 million ultra-luxury sale in March. However, this ultra-luxury sale didn’t register much of an impact on Miami Beach’s average and median sales price and price/sq. ft., as the prices still dipped slightly.
- Median days on market is still high at 193 (see monthly data summary chart).
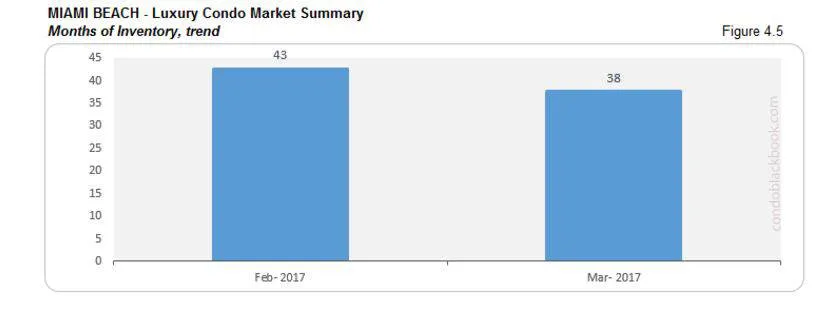
- 38 months of inventory on the market, much higher than the 9-12 month normal. Miami Beach currently has 1.3k active properties with 60 pending. The neighborhood averages 35 sales a month (based on last 6 months’ averages).
- Strong buyer’s market. All of this again points to a strong buyer’s market, where buyers are in firm control and have the best negotiating power. As a buyer, you can make the most of this market by searching for Miami Beach condos on sale here.
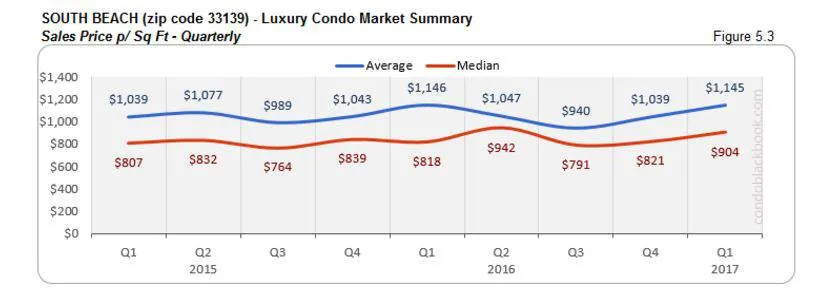
South Beach Luxury Condo Market Summary (33139 zip)
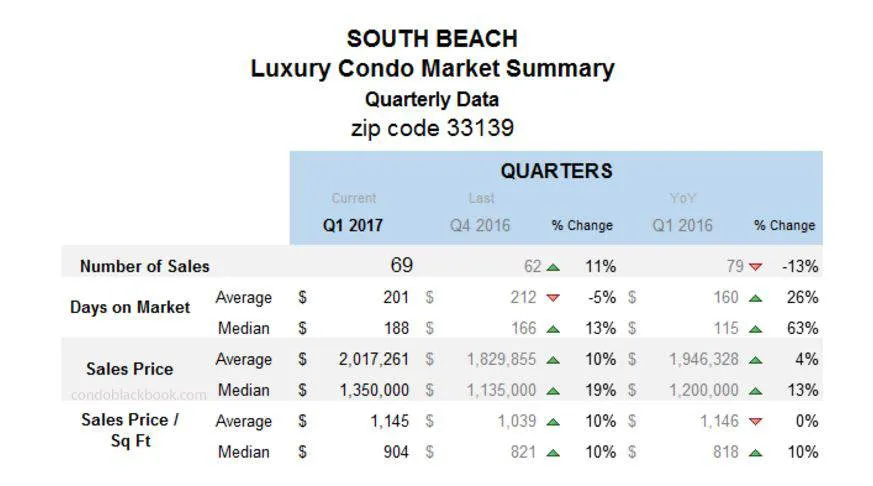
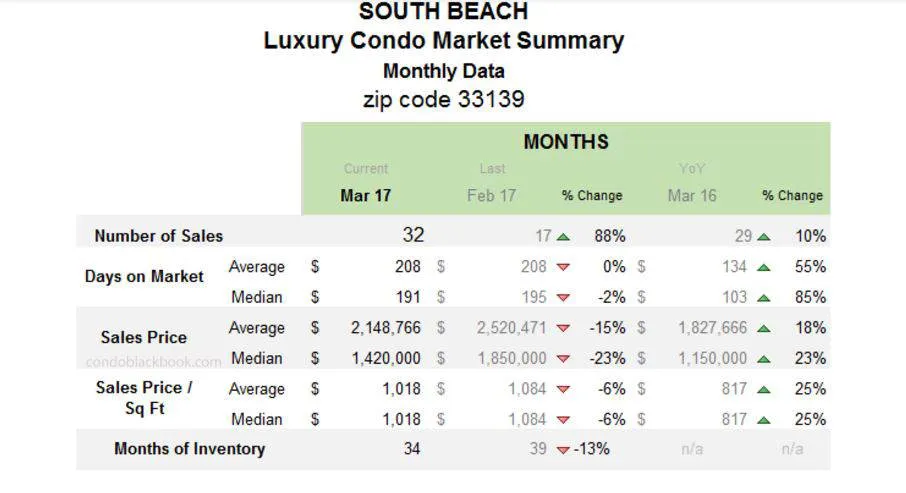
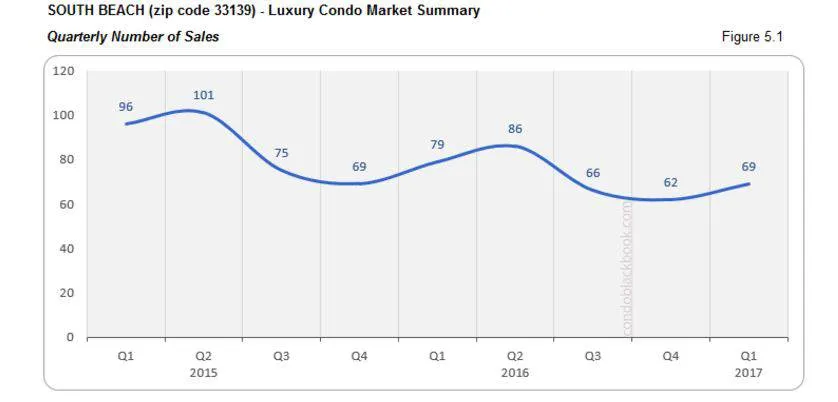
- South Beach’s March sales leaped 88% over February’s numbers. Pretty much in tandem with the overall luxury condo sales situation (fig. 1.1).
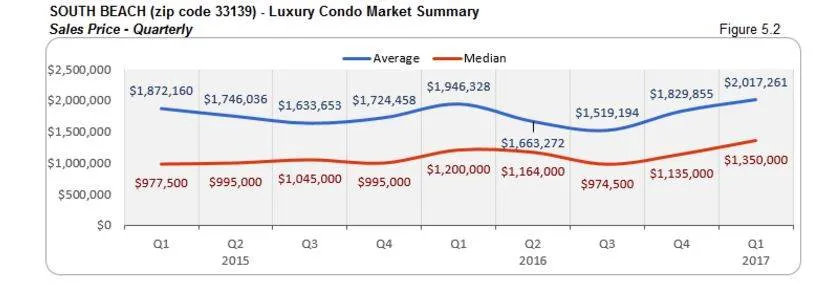
- Quarterly sales prices show an increase, but March sales prices drop. An oddity in South Beach’s sales prices is that while quarterly sales prices show an increase (see quarterly data chart), the monthly prices have dropped (see monthly data chart). These inflated quarterly prices are essentially because of February’s two odd sales of over $7 million.
- Median days on market stand at 191 for March (see monthly data summary chart).
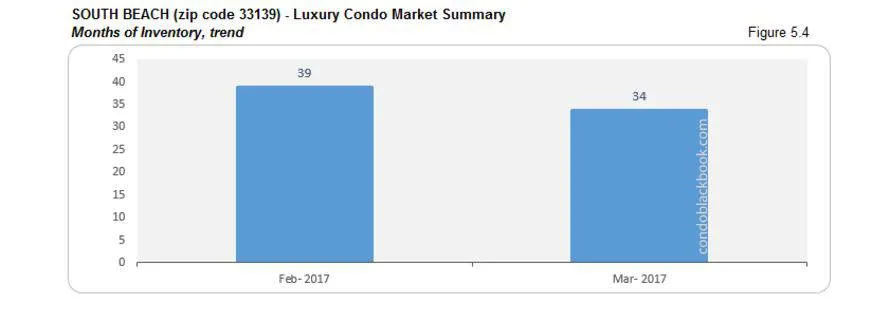
- South Beach has 34 months of luxury condo inventory. There are currently 700 active luxury properties and 33 pending, and an average of 22 deals per month (last 6 months’ average).
- All of this points to us being in a strong buyer’s market, where buyers have negotiation advantage. For an in-depth look into South Beach’s lifestyle or search South Beach condos for sale here.
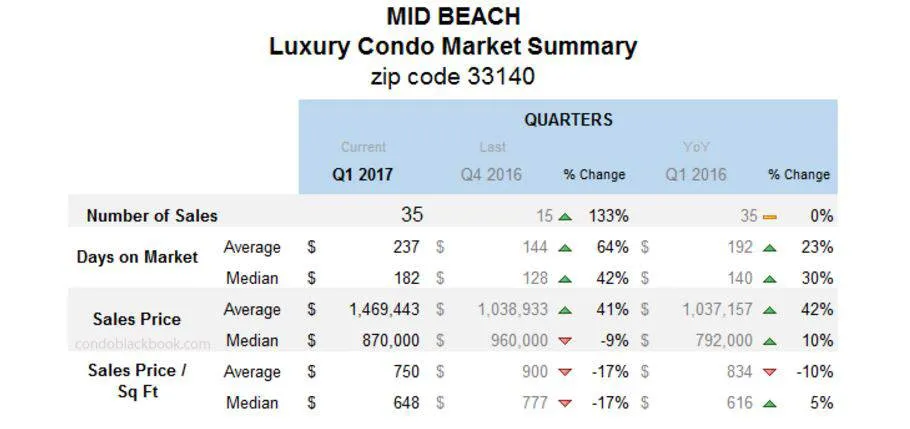
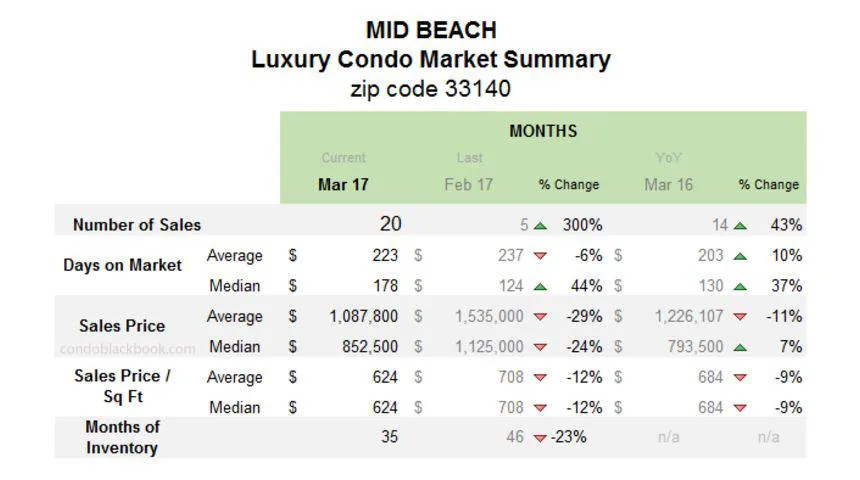
Mid-Beach Luxury Condo Market Summary (33140 zip)
- The big peak that we see in the sales volume for the overall market summary is also present here in Mid-Beach, going from 5 to 20 sales in just one month (fig. 6.2).
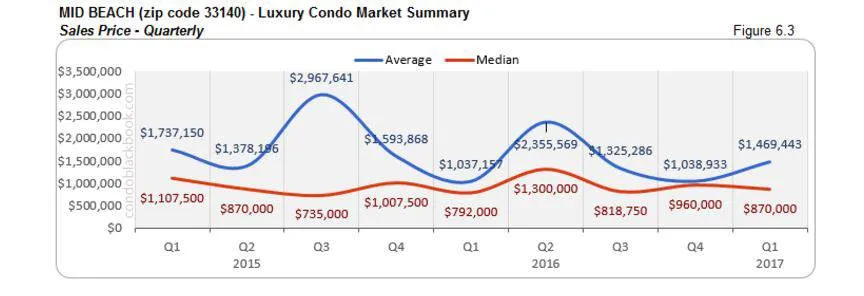
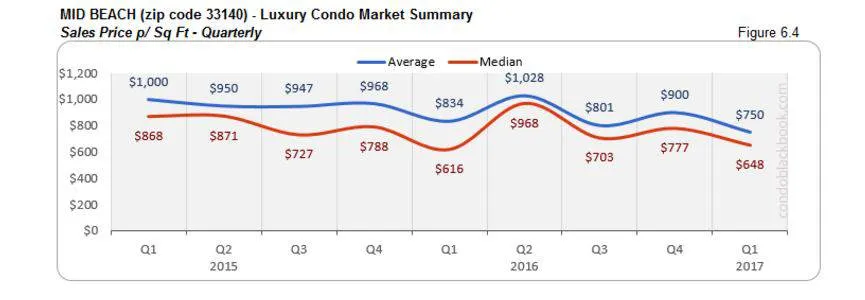
- As mentioned last month, expensive sales caused a jump in the quarterly average sale prices for Mid-Beach (fig. 6.3), but not in the price per sq. ft. (fig. 6.4).
- Mid-Beach has 273 active properties and another 19 under contract.
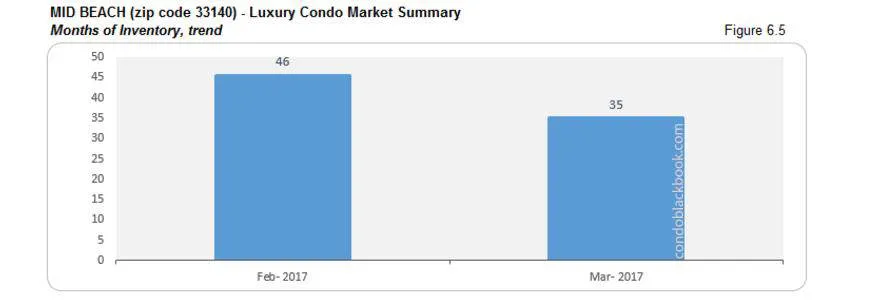
- Taking into account the average of 8 deals per month (based on last 6 months’ average), this family-friendly neighborhood north of South Beach now has 35 months worth of inventory, which shows an impressive 23% decrease (fig. 6.5) due to the jump in sales mentioned above.
- Even so, we are still in a very strong buyer’s market, and buyers have many choices along with a strong negotiating position in general. Click for a candid tour around Mid-Beach, or searching Mid-Beach condos for sale here.
Surfside Luxury Condo Market Summary
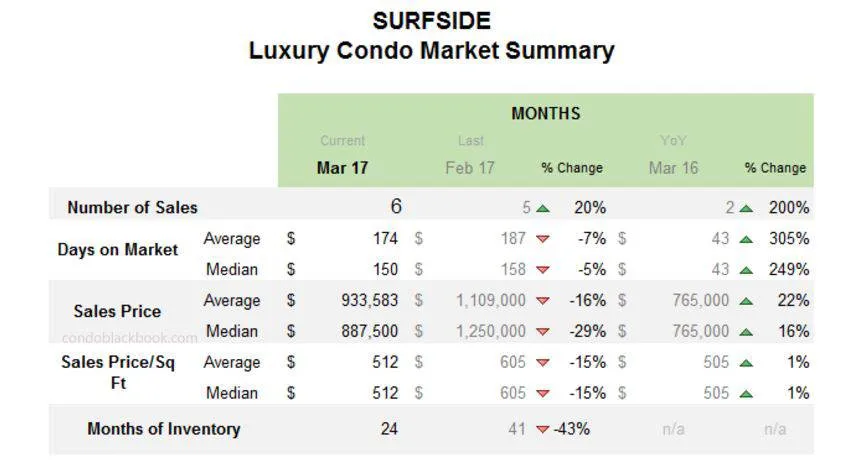
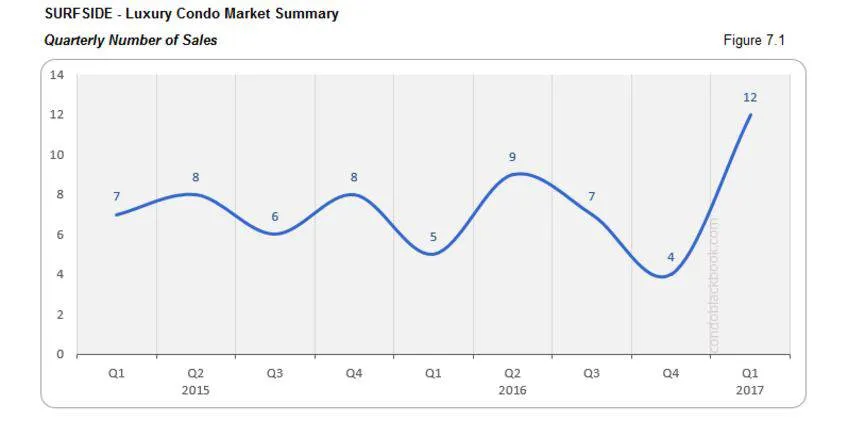
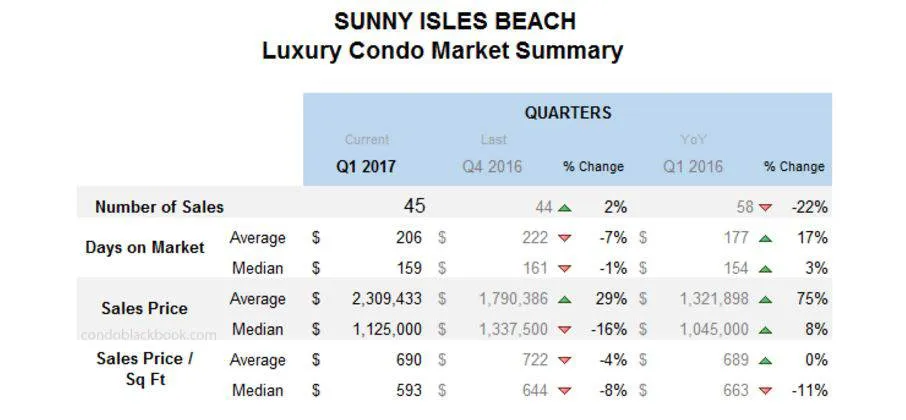
- Surfside’s charts too show an impressive peak in sales for quarter one (fig. 7.1)
- Surfside has 60 active properties on the market, with 3 pending.
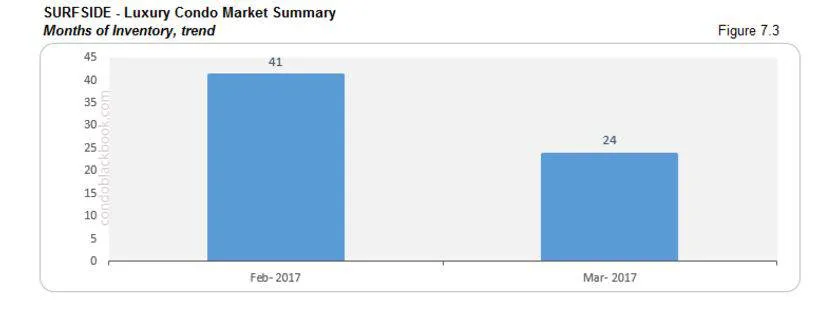
- Combining that with an average of 3 deals a month (taking last 6 months’ average); it means there is about 24 months of inventory that’s about 41% lower than last month.
- Given that Surfside’s luxury condo market is a bit modest to get a clear idea on market trends, you can look at Bal Harbour or Miami Beach’s stats for a better idea on where the market’s headed.
- Click to know what makes the chic neighborhood of Surfside a popular pick, or search a Surfside condo for sale here.
Bal Harbour Luxury Condo Market Summary
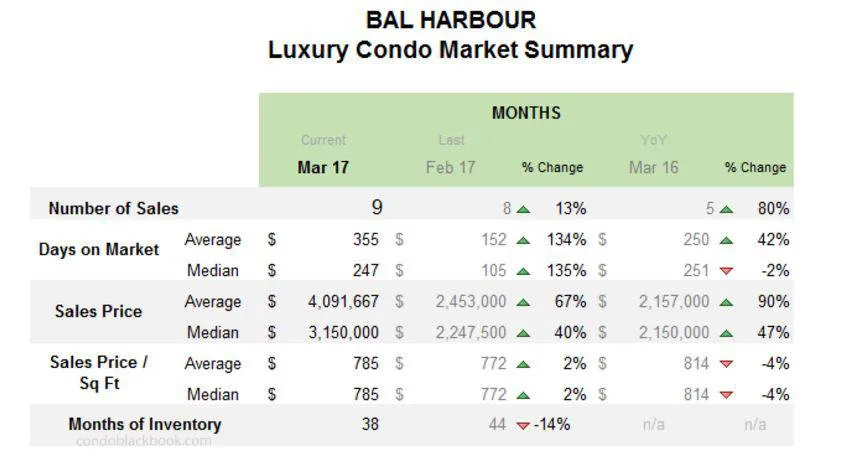
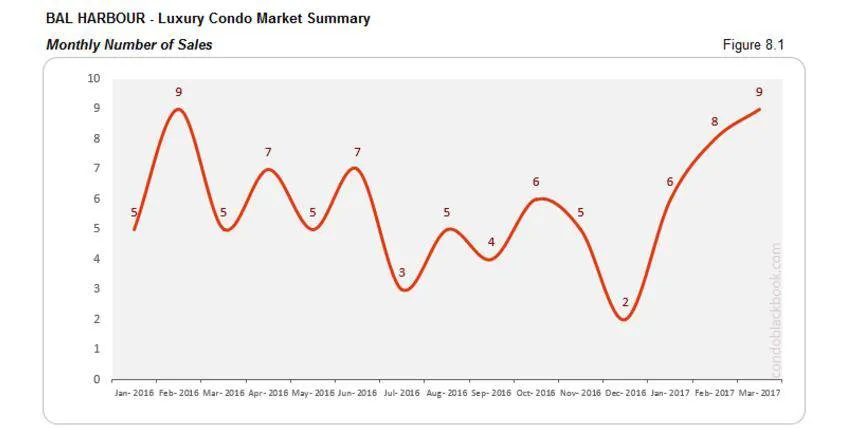
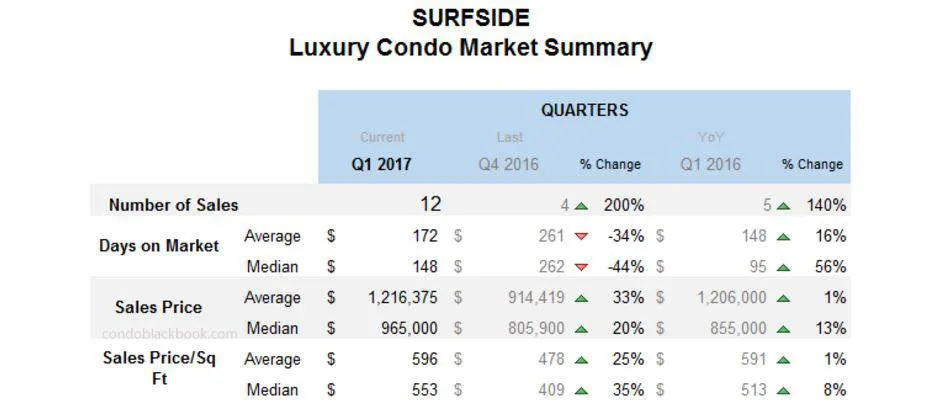
- Bal Harbour seems to be on a roll. It’s easy to trace the upscale neighborhood’s increase in sales through the months (fig. 8.1), with quarter one posting a 77% increase.
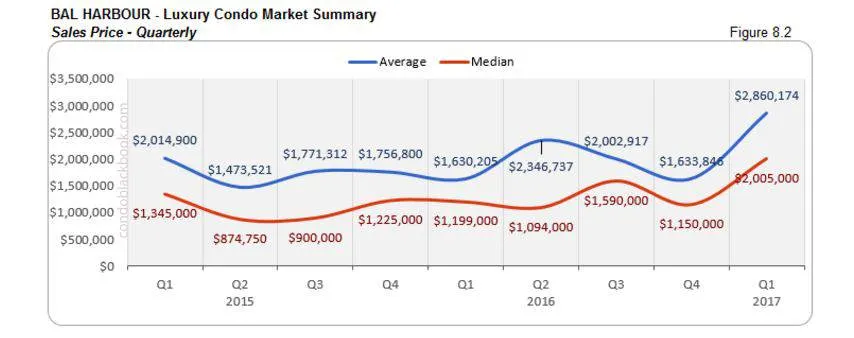
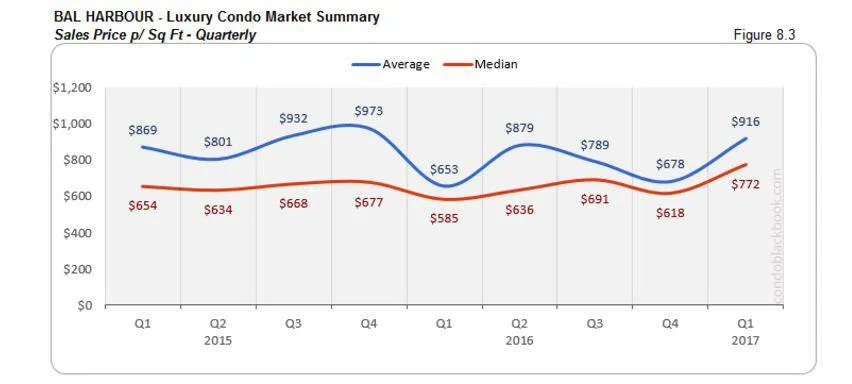
- Repeating February’s success, Bal Harbour again logged an ultra-luxury sale, this time priced at $14 million. This high-end sale not only shot up average sales prices for the neighborhood (fig. 8.2 and 8.3), but also left its mark on the overall luxury condo sales price trends in fig. 3.1 and 3.2.
- Bal Harbour currently has 220 active listings, plus another 7 under contract.
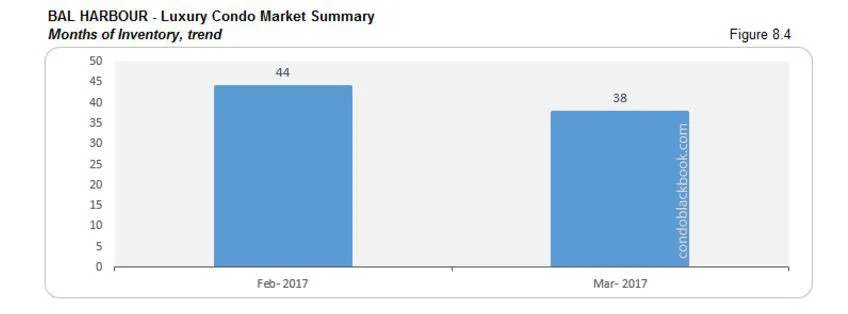
- Considering the average of 6 deals per month (last 6 months’ average), this posh neighborhood now has 38 months of inventory on hand (fig. 8.4).
- As is the trend in the rest of the luxury condo sub-markets, we have a strong buyer’s market, giving them the edge in negotiations due to heavy condo inventory. Click to see what amenities make Bal Harbour’s condos hot property, or Search Bal Harbour condos for sale here.
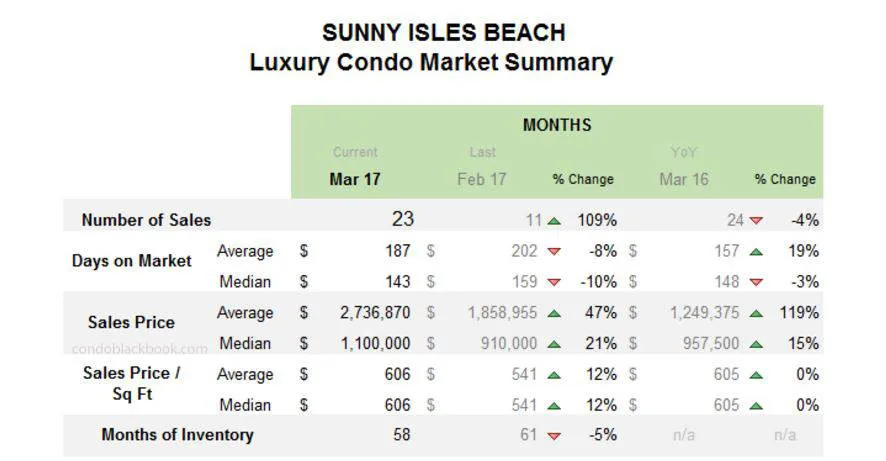
Sunny Isles Beach Luxury Condo Market Summary
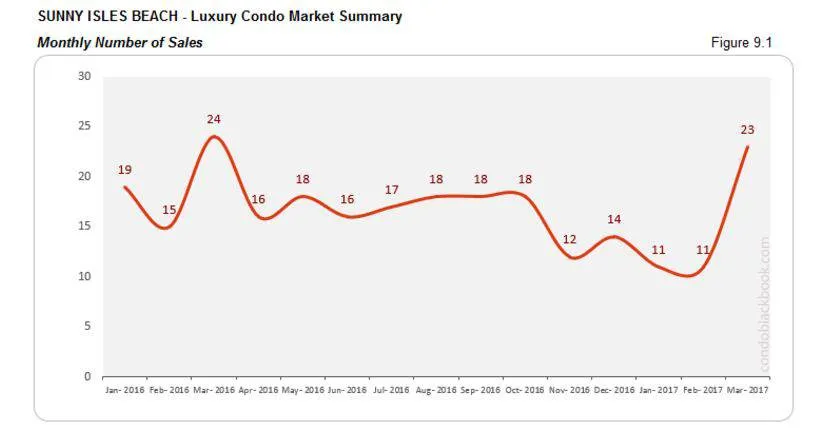
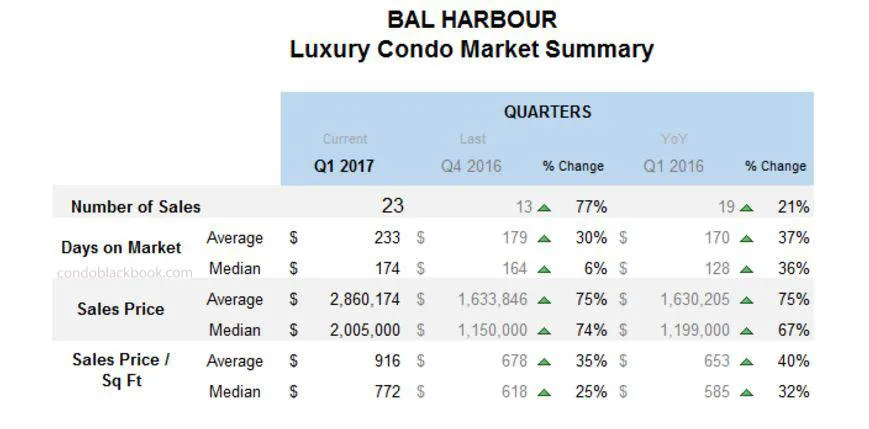
- Sunny Isles Beach follows the overall sales trend visible throughout this report. Posting a quiet January and February and then showing a sudden recovery in March (fig. 9.1).
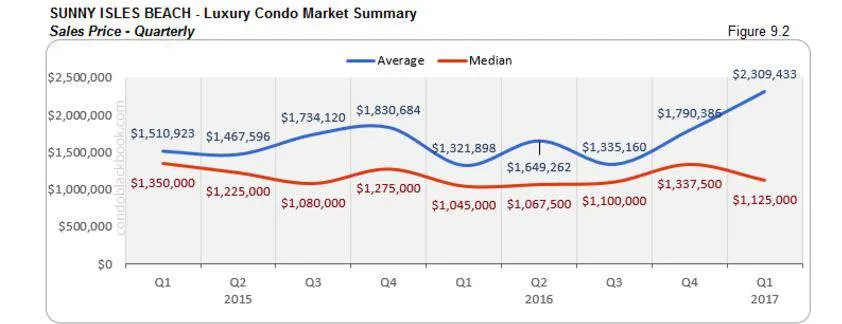
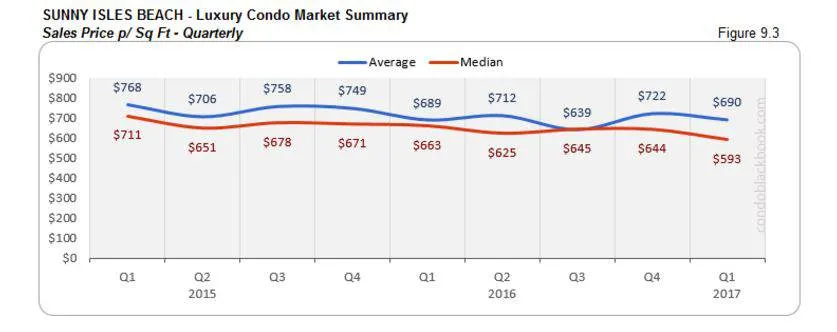
- However, the average sales price per sq. ft. (fig. 9.3) has been declining in this exclusive neighborhood, in spite of a $25 million ultra-luxury sale in March.
- Sunny Isles Beach currently has 831 active condo listings, plus 31 pending.
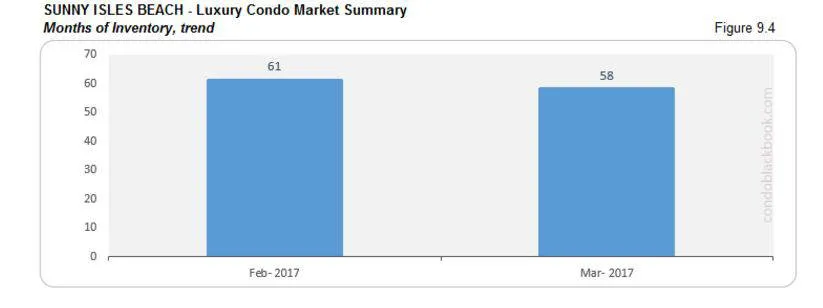
- Based on the average of 15 deals a month (last 6 months’ trend), Sunny Isles Beach still has 58 months of inventory to deal with.
- Buyers are again in firm control and sellers will have to be more flexible if they want their properties to move (until we get back to a balanced 9-12 months of inventory). Buyers can easily tour the amenities and lifestyle available in Sunny Isles Beach here, or search Sunny Isles Beach condos for sale here.
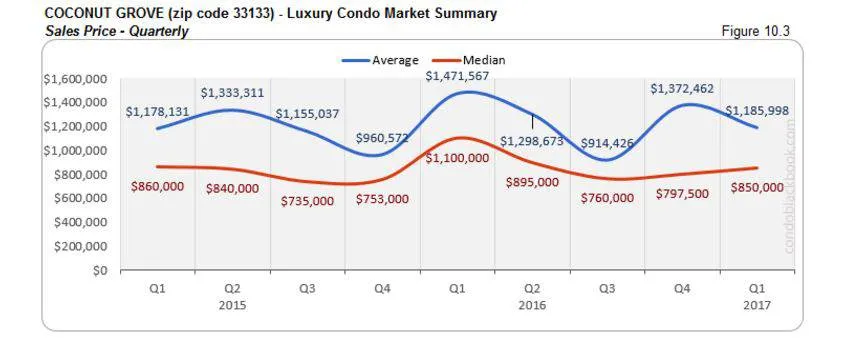
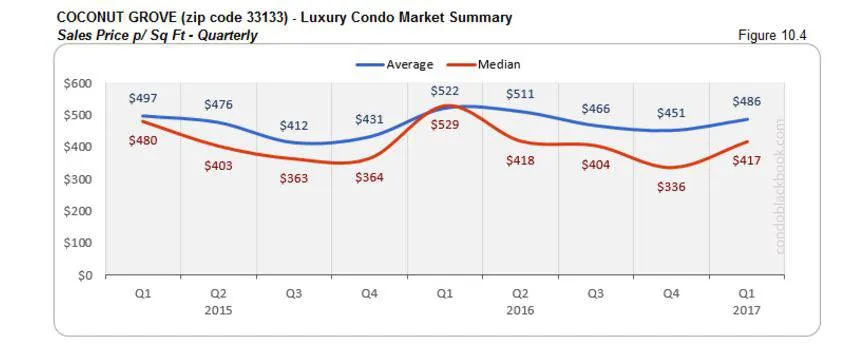
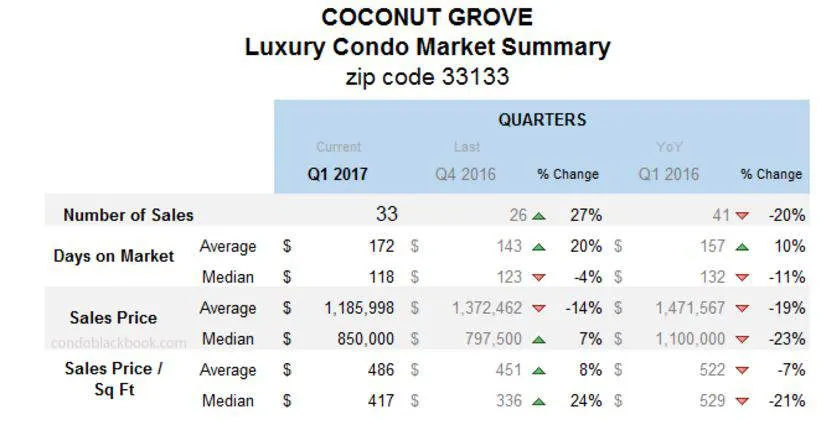
Coconut Grove Luxury Condo Market Summary (33133 zip)
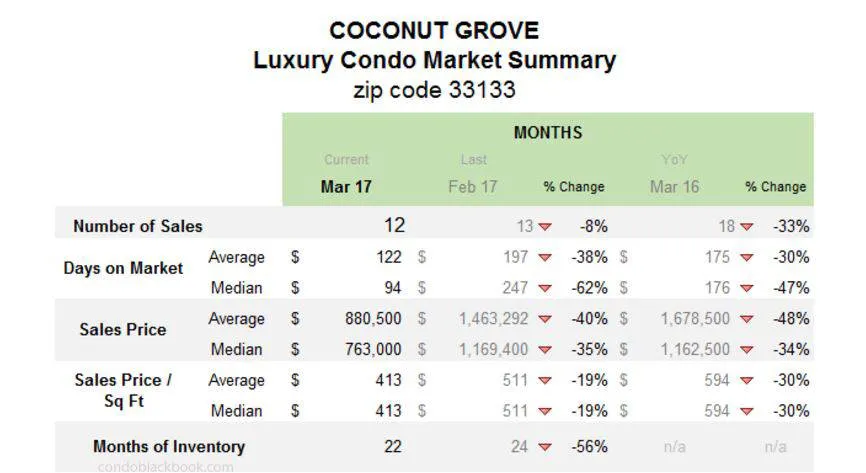
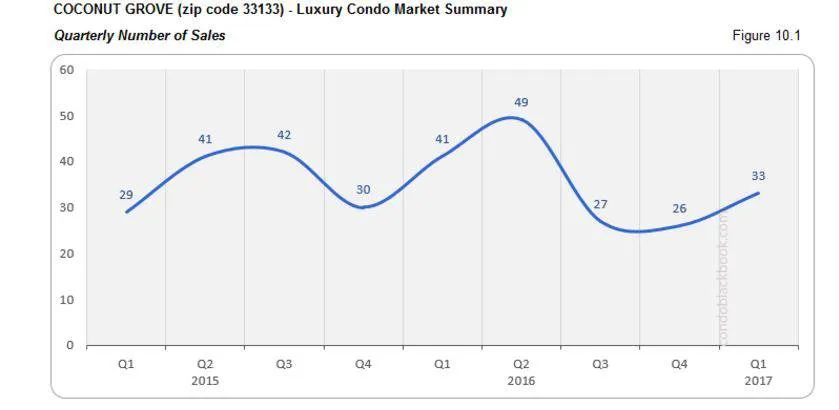
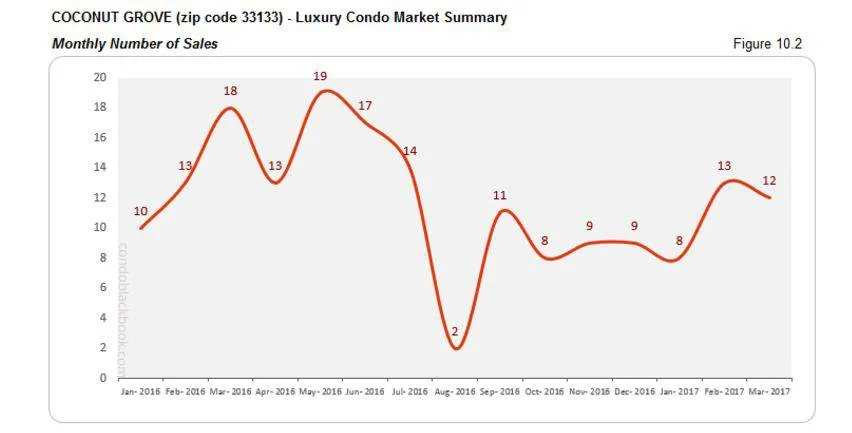
- Coconut Grove may have very well been the early bird in terms of number of sales recovery. It showed improvements in February and sustained those numbers through March (fig. 10.2), thus closing with a 27% increase over the last quarter (see fig. 10.1).
- Another interesting thing to note is how the average sales price per sq. ft. has suddenly jumped (fig. 10.4), whereas the average sales price shows a dip (fig. 10.3).
- Coconut Grove currently has 200 active properties plus 18 pending.
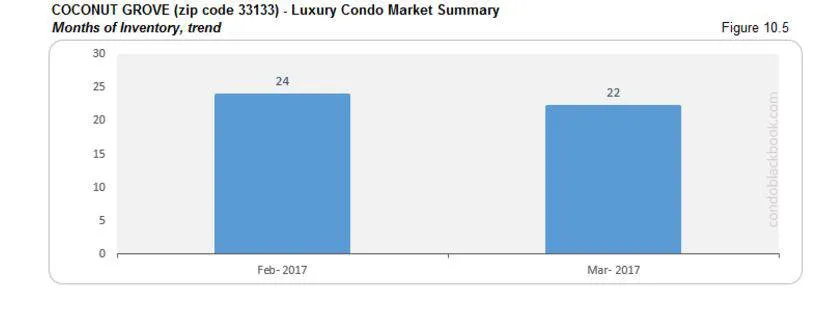
- Taking this vibrant neighborhood’s average of 10 deals a month (last 6 months’ trend), we’re still looking at 22 months of inventory on the market.
- With the market moving so slowly, buyers have the opportunity to grab great deals in the neighborhood. See what lifestyle options exist in the historic Coconut Grove, or search Coconut Grove condos for sale here.
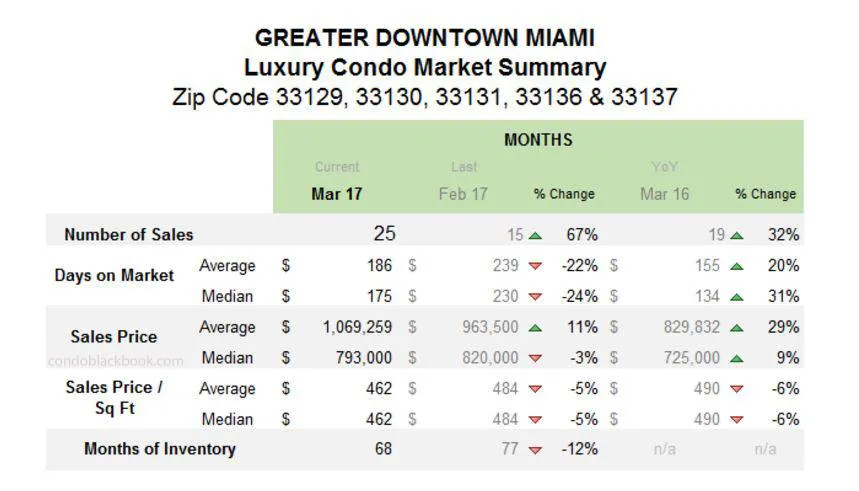
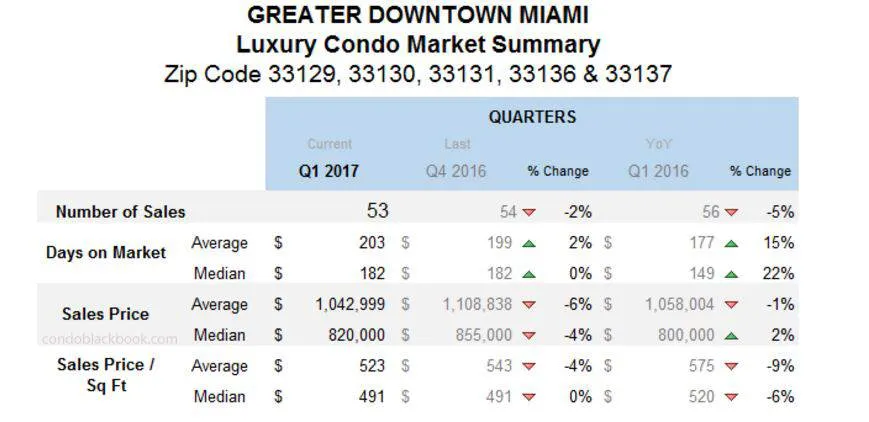
Greater Downtown Miami Luxury Condo Market Summary (33129, 33130, 33131, 33136, 33137 zips)
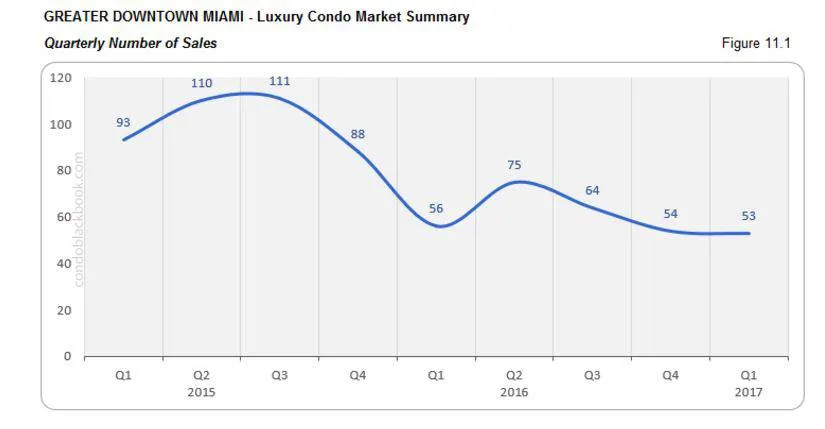
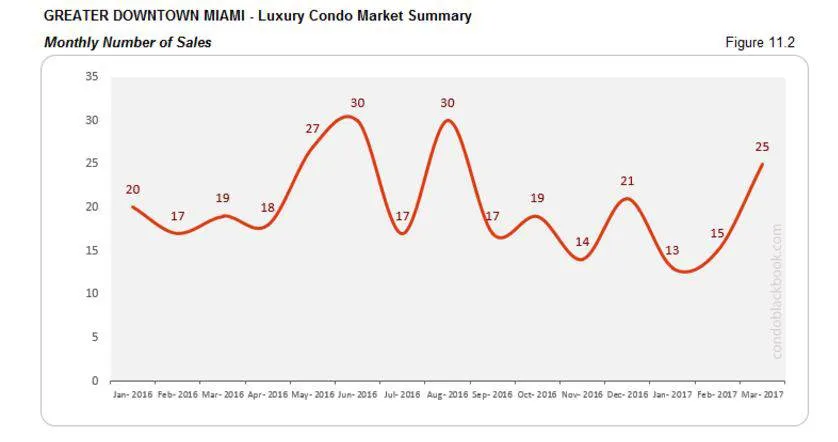
- Greater Downtown Miami has been the hub of activity in recent years, but we see a much smaller increase in sales for March (monthly data summary chart) as compared to other sub-markets that the quarterly numbers actually tend to dip (fig. 11.1).
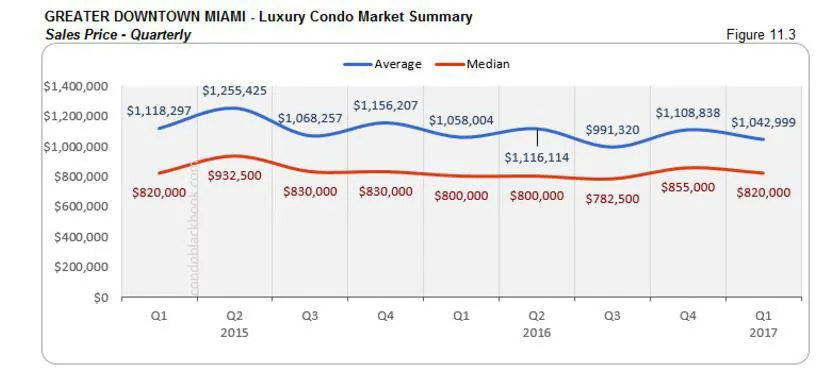
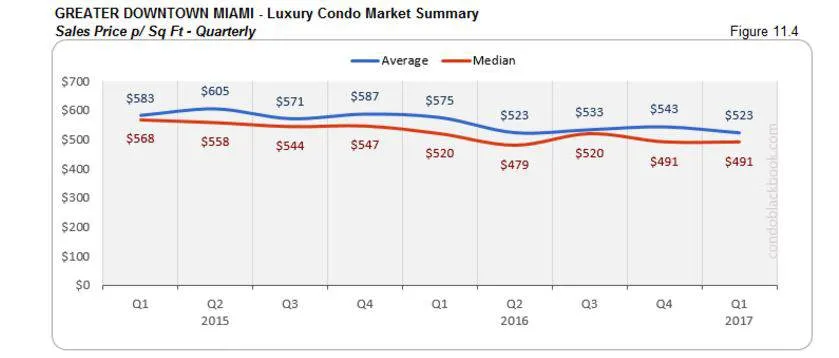
- There is no marked progress in the sales prices either (fig. 11.3 and 11.4), meaning buyers could get into this central neighborhood now, before prices go shooting up again. Click here to search the Greater Downtown Miami area condos for sale.
- Greater Downtown Miami has 1.2k active listings, with another 38 pending.
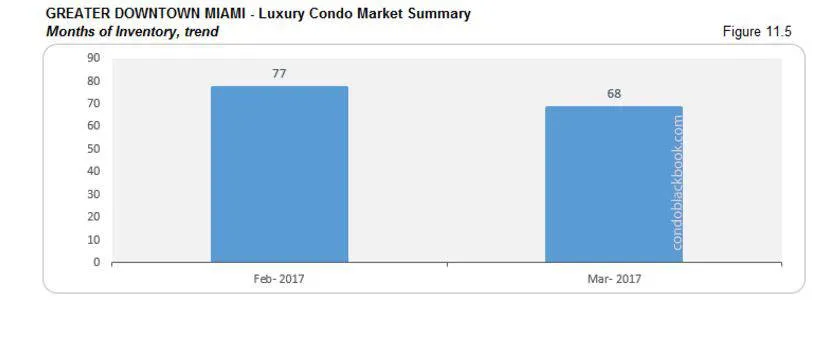
- Considering its average of 18 deals per month for units over $600K (based on last 6 months’ average), there is now 68 months of luxury inventory in this culturally active neighborhood. Normal inventory is generally between 9 and 12 months.
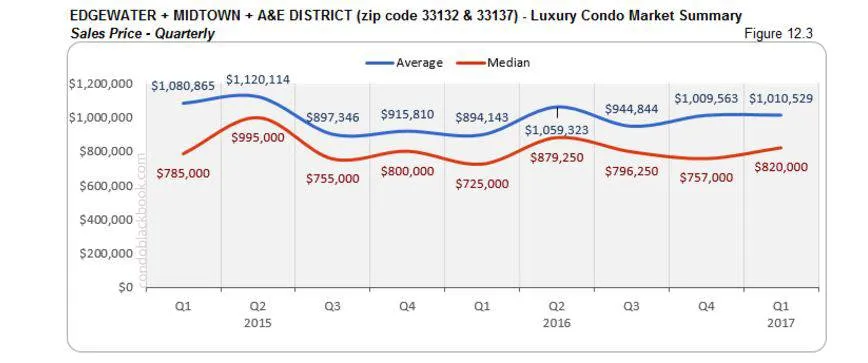
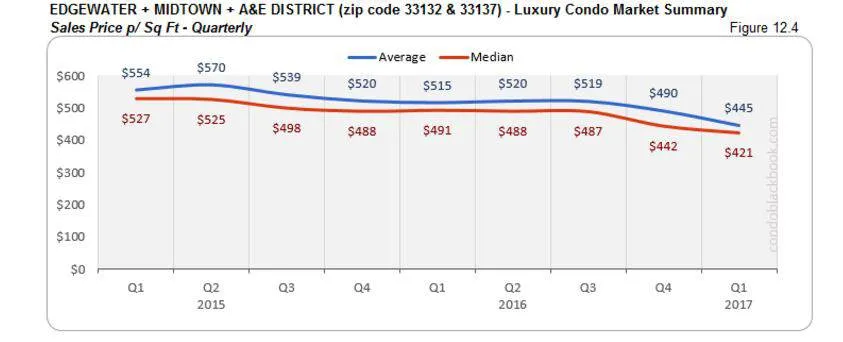
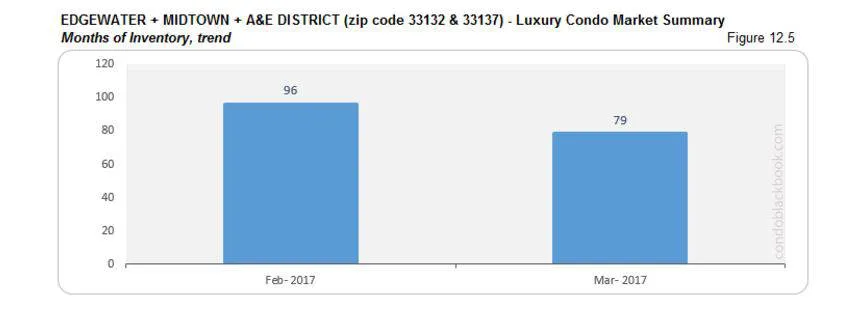
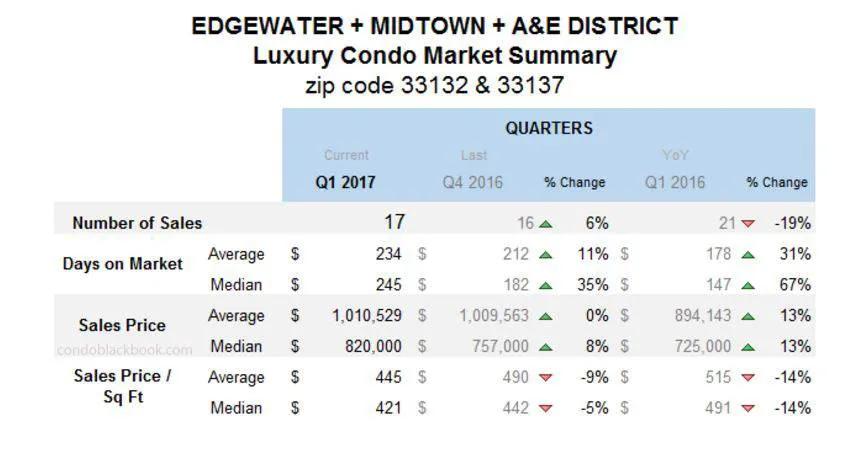
Edgewater + Midtown + A&E District Luxury Condo Market Summary (33132 + 33137 zip)
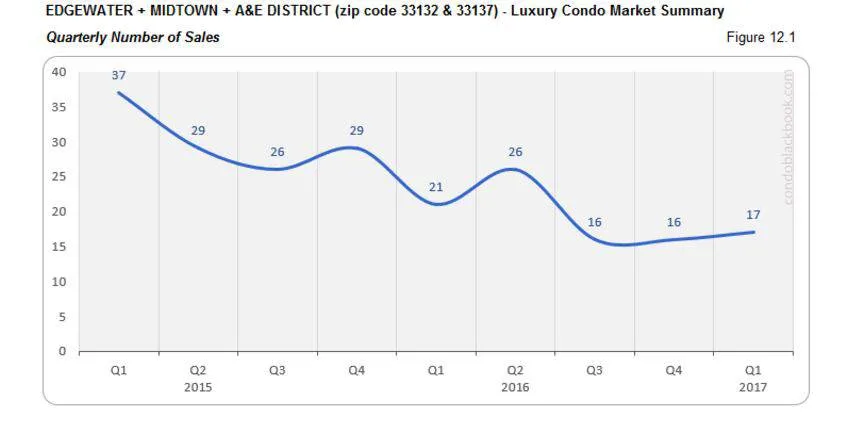
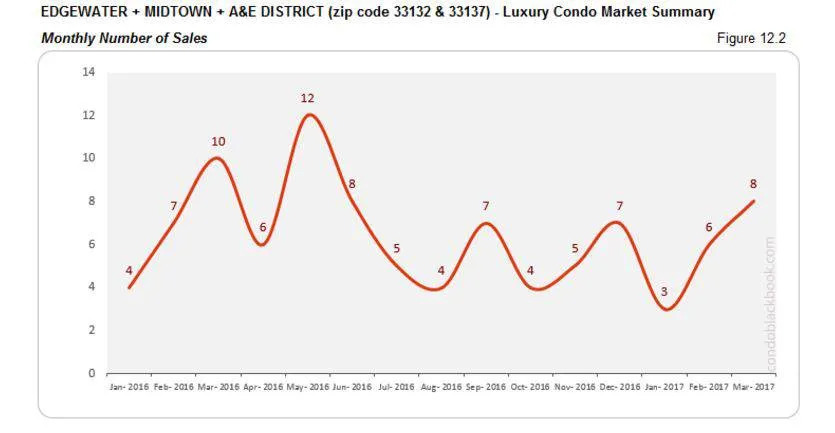
- Just like its neighboring Greater Downtown Miami, there is a blink-and-you-miss-it increase in sales volume in these upcoming neighborhoods (fig. 12.1)
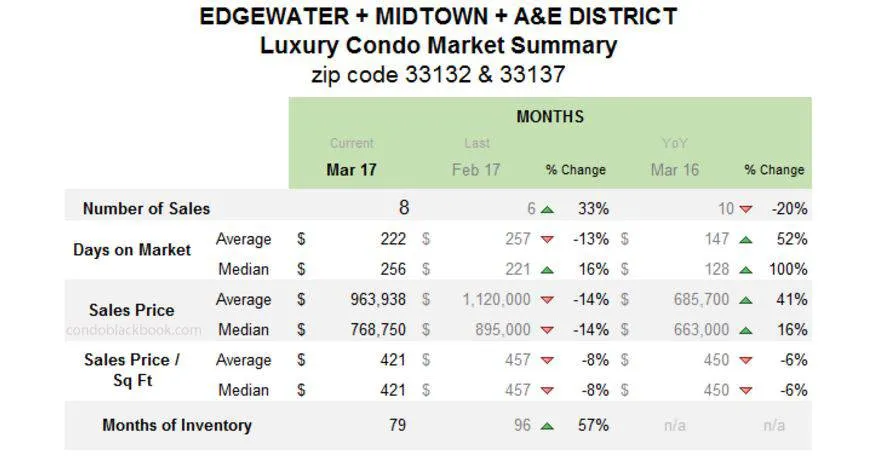
- There are 418 active properties for this grouping, plus another 14 under contract.
- With an average of 6 deals per month (last 6 months’ trend), we’re looking at a chunky 79 months of inventory. Normal inventory is between 9 and 12 months. This is a serious issue if you are a seller, but buyers can negotiate and chip away at the prices here for the time being.
- Sales prices are rather sticky (fig. 12.3) and even lower than last quarter (fig. 12.4), again making it a lucrative choice for buyers to get in before the next boom cycle hits. You can check out the individual lifestyle and condo options in Edgewater, Midtown and Arts & Entertainment District.
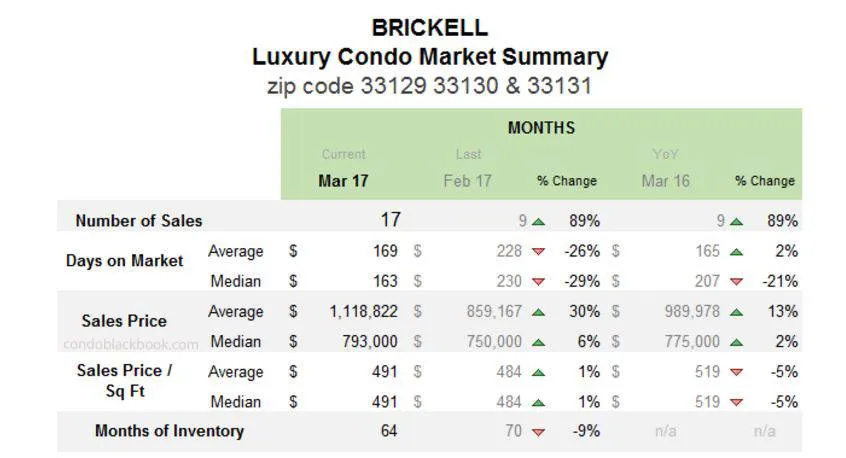
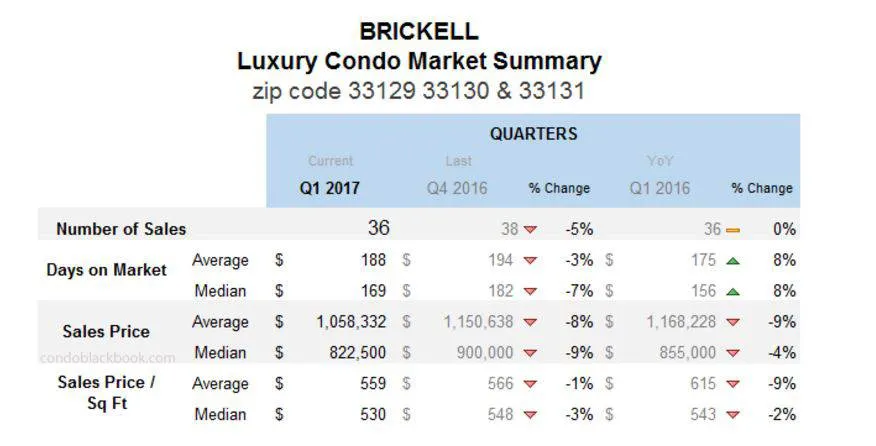
Brickell Luxury Condo Market Summary (33129, 33130, 33131 zip)
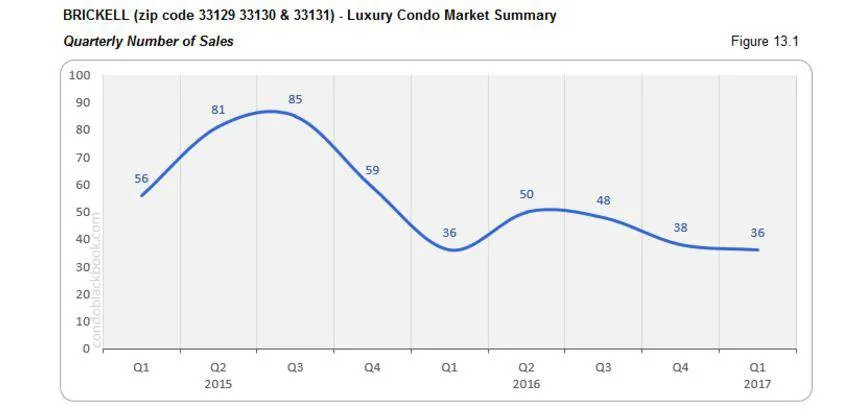
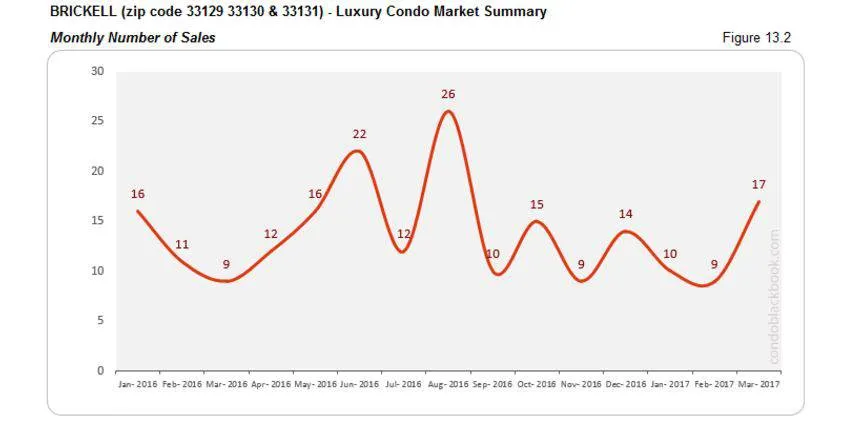
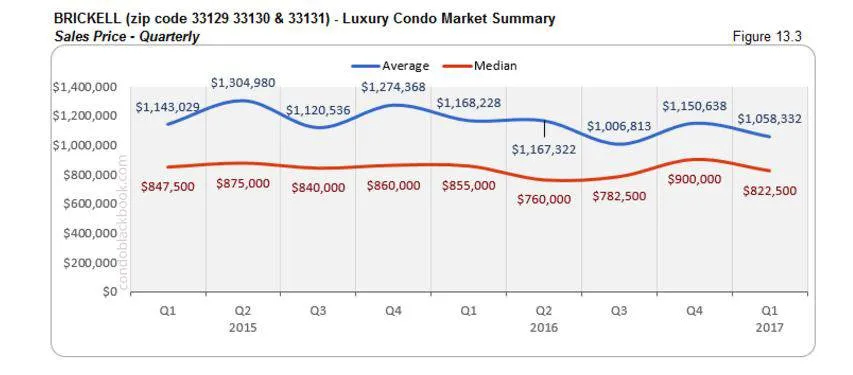
- Brickell logs in a huge 89% increase in sales this March, but January and February were so quiet that the whole quarter ends up with a 5% decrease compared to its previous (see quarterly and monthly summary charts).
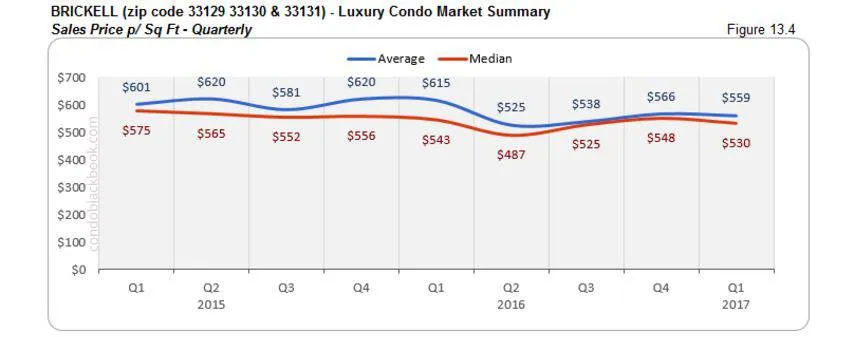
- The average sales prices per sq. ft. (fig. 13.4) here are a bit sticky too.
- Brickell has 761 active properties on the market, plus 24 pending.
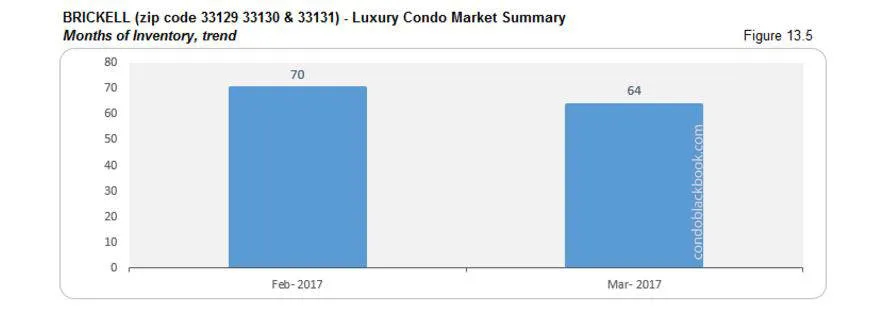
- With an average of 12 deals per month (last 6 months’ average), we’re looking at 64 months of inventory still sitting on Brickell’s luxury condo market. That’s way higher than the 9-12 months normal.
- Click to dabble through Brickell’s lifestyle and condo options that are shedding the strictly business tag..
Coral Gables Luxury Condo Market Summary
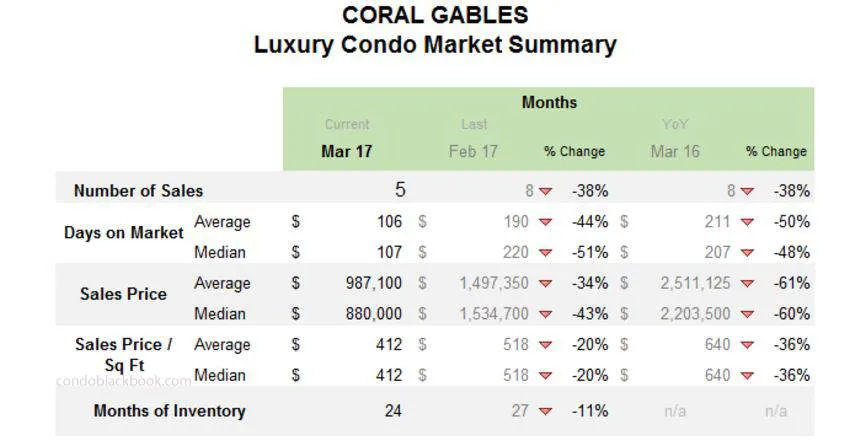
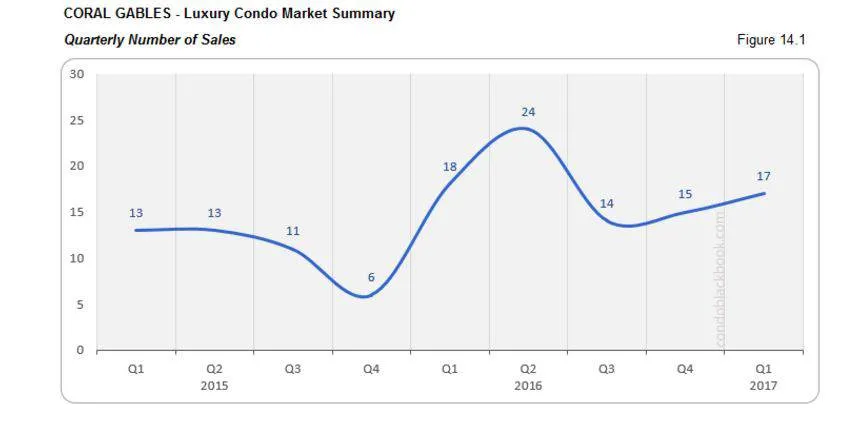
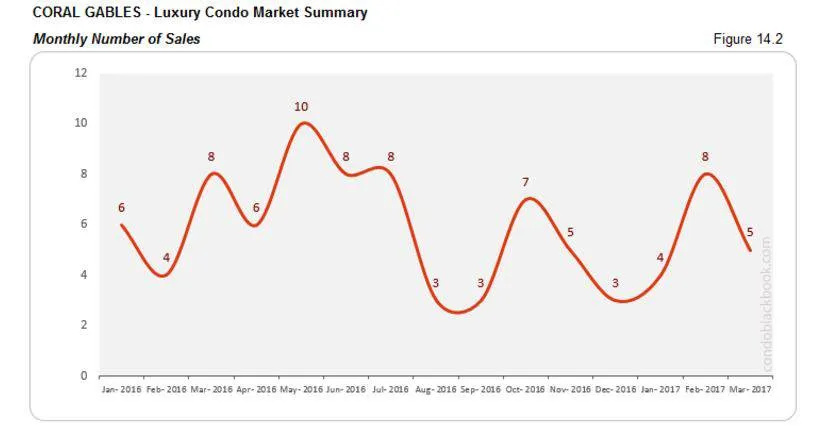
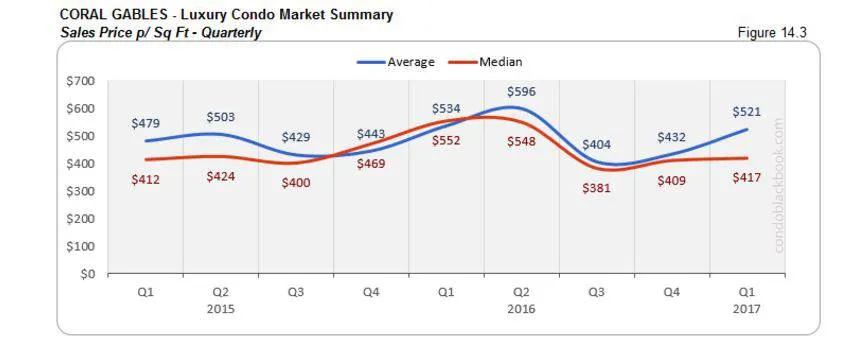
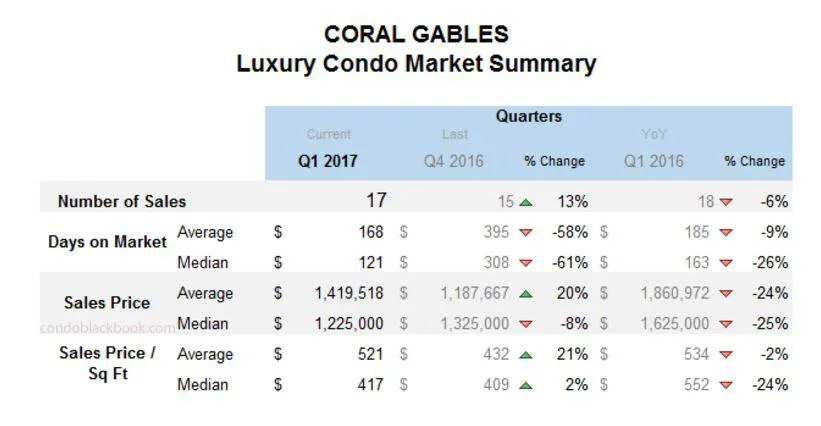
- Again, Coral Gables is a rather quiet neighborhood when it comes to luxury condo deals, so it may not always be reflective of overall trends – like its sales peaked in February rather than March (fig. 14.2).
- Looking into City Beautiful’s inventory, there are 115 active listings plus 11 pending.
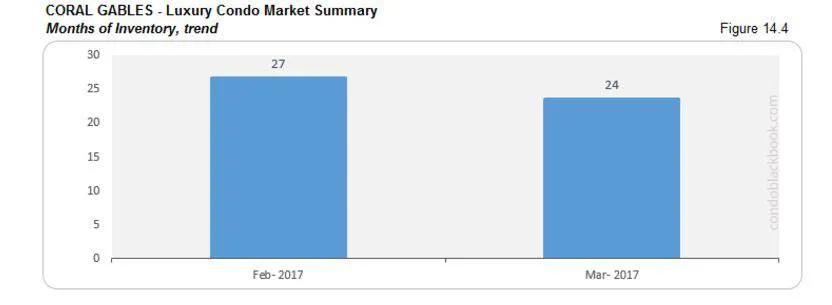
- Taking an average of 5 deals a month (based on last 6 months’ trends), there is still 24 months worth of inventory left on the market, giving buyers the edge.
- Click to see what Coral Gables has to offer in lifestyle, or search Coral Gables condos for sale here.
Conclusion
Good news continues for buyers in March as well. There’s still plenty of inventory to go around and buyers can afford to be picky as well as have the upper hand in negotiations until the market gains momentum again. So, happy shopping!
Love what you see? Don’t forget to subscribe and share our blog to receive the latest market news in your inbox.
See something wrong with the stats? Or have any questions? Please contact Sep at sniakan (at) hbroswell.com or call 305-725-0566.

