Miami Luxury Condo Market Report Q1 2020
Apr 30, 2020 April 30, 2020
The year 2020 opened up to an unprecedented global situation – the COVID-19 pandemic. The spread of the virus had naysayers predicting that the real estate market will come crashing like the bust of 2007-2008. But, by the end of the first quarter, has it?
With the first-quarter results out in our CondoBlackBook.com study of Miami's luxury condo market, you'll find answers to your most pressing questions, like "How has the coronavirus affected Miami condo sales this quarter?" "Is the market more buyer-friendly?" "Have prices tanked?" "What's next?", and more.
Read on for details on how Miami luxury condo sales, prices, days on market, and inventory trended for the first quarter of the year, as well as on a neighborhood basis in Q1 2020, and how the market is weathering the market conditions and changes due to COVID-19.
This luxury condo market report only features properties priced $1 million and above, and covers the neighborhoods of Greater Downtown Miami (inclusive of Edgewater and Brickell), Miami Beach (inclusive of Surfside, Bal Harbour, Sunny Isles Beach and Fisher Island) as well as Coral Gables and Coconut Grove.
Overall Miami Luxury Condo Market Summary - 1Q20 | ||
Quarterly sales down by 4.5% YoY | Overall luxury condo price/sq. ft. is flat | Inventory levels drop, but still favor buyers |
Overall Miami Luxury Condo Market Highlights
- Coral Gables and Coconut Grove grouping leads sales growth with 76% jump year-over-year
- South Beach and Mid/North Beach are the only neighborhoods with negative year-over-year sales
- 12-month sales trendline moves from flat to negative between Q4 2019 and Q1 2020, influenced by a strong 4Q19
- Overall price per sq. ft. stays flat, while year-over-year median sales price drops 10.8%
- The Surfside & Bal Harbour grouping is the most expensive neighborhood of 1Q20 on a per square foot basis with a median price of $1,511/sq. ft., beating Fisher Island
- Buildings built 2015-2020 remain a buyer favorite, with demand for pre-2000 buildings falling slightly
- Overall days on market declines 10.7% year-over-year, capturing positive buyer-seller dialogue
- Inventory down 17% year-over-year
- 2020 opens as a buyer's market
Table of Contents
- Overall Miami Luxury Condo Sales Trends
- Neighborhood Trends - Number of Sales
- Overall Miami Luxury Condo Price Trends - Sales Price, Price/Square Foot
- Neighborhood Trends - Sales Price, Price/Square Foot
- Miami Condo Sales Price Trends by Building Year
- Overall Miami Luxury Condo Days on Market Trends
- Neighborhood Trends - Days on Market
- Overall Inventory Trends
- Conclusion
- Where Does the Miami Luxury Condo Market Go From Here?
Luxury Condo Sales Down in Miami Overall
Overall Miami Luxury Condo Quarterly Market Summary - Fig. 1.1

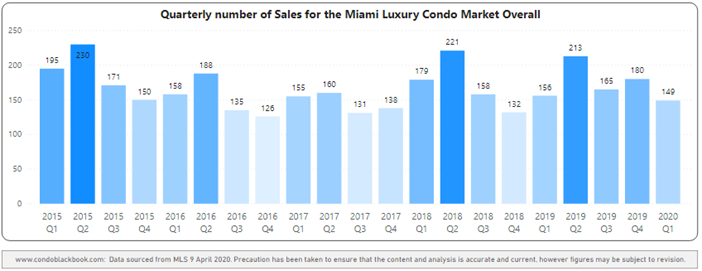
Sales down 4.5% year-over-year with a negative trendline. Though the beginning of the year is known to be soft with the second quarter usually coming in stronger, Q1 2020 reports a rather slow start, with sales dropping 4.5% (149 sales) against the same quarter 2019 (156 sales) (fig. 1.2). Contrary to what people would believe, sales do not seem to be affected by the COVID-19 health crisis yet – and a closer look at the monthly sales reveals why.
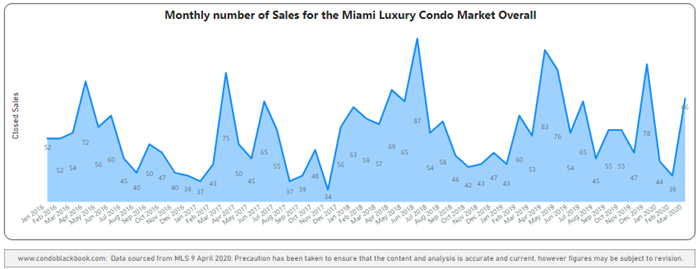
Fig. 1.3 below shows that January closed with similar sales to 2019, February reported a decline to 39 closed sales from last year's 60, whereas March saw a spike of 66 compared to last year's 53 sales. So, a direct correlation of the health crisis to Q1's sales figures is not seen.
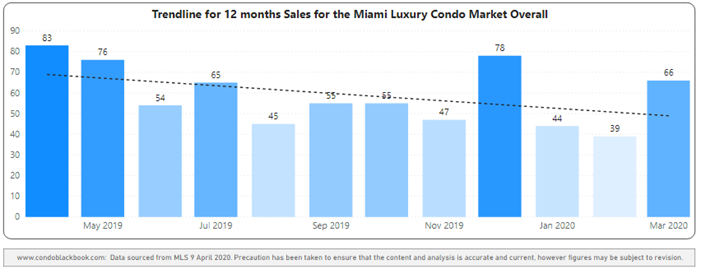
Consistent with the drop we see in quarter-over-quarter sales, the 12-month trend line in fig. 1.4 slopes negatively. But this is more a factor of a stronger than usual ending to 2019. Indeed, this is quite evident since the last two quarters of 2019 reported a higher than normal sales volume, while Q1 2020 did not follow suit, however March showed a strong uptick that we'll have to follow through the second quarter.
Miami Overall Quarterly Sales 2015 - 2020 Heatmap - Fig. 1.2
Miami Luxury Condo Monthly Sales from Jan. 2016 to Mar. 2020 - Fig. 1.3
Miami Overall 12-Month Sales with Trendline - Fig. 1.4
Neighborhood Trends - Number of Sales
Q1 Year-over-Year Sales Trends (fig. 1.5)
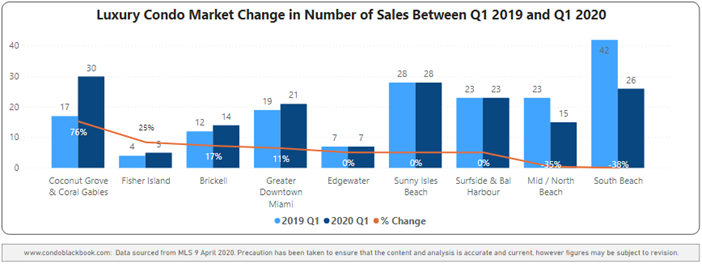
- Winner: The combined neighborhood of Coral Gables and Coconut Grove reports the highest percentage (76%) growth in year-over-year sales - an impressive three-quarter jump
- Up: Fisher Island (25%), Brickell (17%), and Greater Downtown Miami (11%) all report an increase in sales
- Flat: Edgewater, Sunny Isles Beach and Surfside & Bal Harbour post the same level of sales as Q1 2019
- Down: South Beach (-38%) and Mid / North Beach (-35%) were the only neighborhoods to report a decline in year-over-year sales
More details available, including quarterly data, in the dedicated reports for Greater Downtown Miami, Miami Beach and the Barrier Islands, plus Coral Gables & Coconut Grove.
Miami Luxury Condo Neighborhood 1Q20-over-1Q19 Sales Comparison - Fig. 1.5
Overall Luxury Condo Prices Down - Price/Sq. Ft. Flat, Sales Price Declines
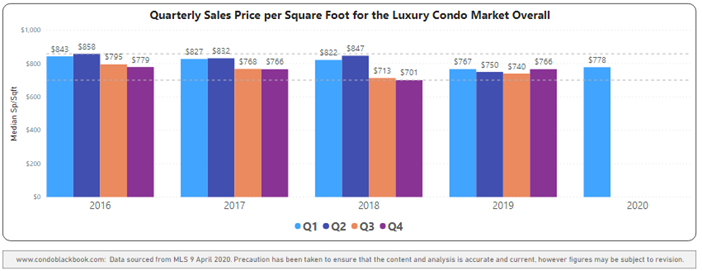
Price/sq. ft. essentially flat at $778, median price declines 10.8% year-over-year. Overall, the price per sq. ft. for luxury condos in Miami is essentially flat quarter-to-quarter and year-over-year, reporting only a marginal (1.5%) increase. Additionally, the median sales price posts a 10.8% drop in year-over-year trends, falling to $1,650,000 this year from last year's $1,850,000 in Q1 (fig. 1.1), capturing the general trend of the luxury condo market.
The difference between the median price and price per sq. ft. trends could be due to the newer set of recently delivered condos to the market being smaller in size, yet more amenity-rich, making them fetch a higher price per sq. ft. for the additional ultra luxury provided.
What's worth noting, however, is that the median price per sq. ft. is the highest it has been in over one-and-a-half years, since Q3 2018 (see fig. 2.1 below).
Miami Overall Quarterly Price per Sq. Ft. 2016-2020 - Fig. 2.1
Neighborhood Trends - Price/Square Foot, Sales Price
Q1 Year-over-Year Price Trends
Price per Sq. Ft. - Median (fig. 2.2.1)
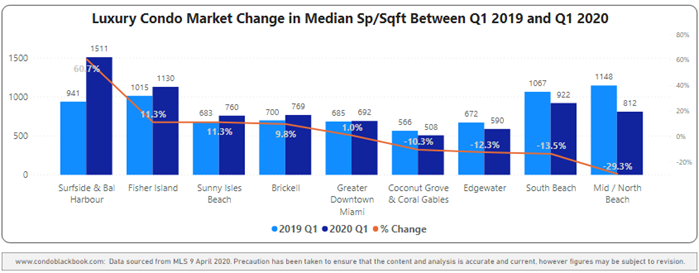
- Winner: The combined district of Surfside & Bal Harbour is the most expensive neighborhood with a median price of $1,511/sq. ft.
- Winner: Surfside & Bal Harbour reports the highest percentage growth in year-over-year price per sq. ft. (60.7%), with Surfside's luxury condos being the biggest contributors to this jump
- Up: Other neighborhoods reporting an increase in year-over-year price per sq. ft. - Fisher Island (11.3%), Sunny Isles Beach (11.3%), Brickell (9.8%)
- Flat: Greater Downtown Miami (+1%)
- Down: Neighborhoods reporting a drop in year-over-year price per sq. ft. - Mid/North Beach (-29.3%), South Beach (-13.5%), Edgewater (-12.3%), Coral Gables & Coconut Grove (-10.3%)
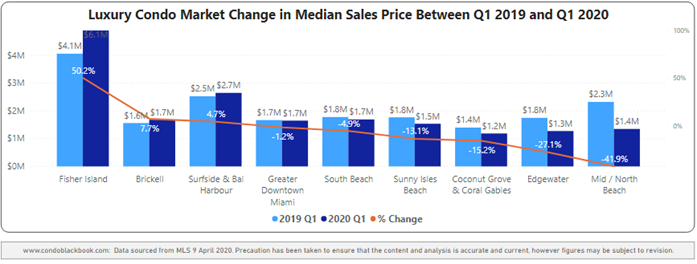
Sales Price - Median (fig. 2.2.2)
- Winner: Fisher Island reports the highest percentage growth in year-over-year sales price (50.2%)
- Winner: Besides Fisher Island posting a 50% jump to $6.1 million (Fisher Island perpetually has the highest priced luxury condos in Miami on a medial sales price basis), the combined neighborhood of Surfside & Bal Harbour reports the highest sales price of $2.7 million this first quarter
- Up: Other neighborhoods reporting an increase in year-over-year sales price - Brickell (7.7%), Surfside & Bal Harbour (4.7%)
- Flat: Greater Downtown (-1.2%)
- Down: Neighborhoods reporting a drop in year-over-year sales price - Mid/ North Beach (-41.9%), Edgewater (-27.1%), Coral Gables and Coconut Grove (-15.2%), Sunny Isles Beach (-13.1%), South Beach (-4.9%)
Neighborhood 1Q20-over-1Q19 Median Price per Sq. Ft. Comparison - Fig. 2.2.1
Neighborhood 1Q20-over-1Q19 Median Sales Price Comparison - Fig. 2.2.2
Sales Price Trends by Building Year - Miami Market Overall
Below is a detailed analysis of how prices added up on the basis of age of construction for luxury condos in Miami, categorized as new construction buildings (2015-2020), buildings from 2000-2014, and pre-2000 buildings.
NEW CONSTRUCTION BUILDINGS BUILT: 2015-2020
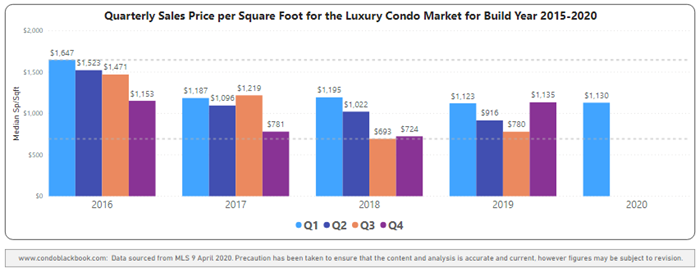
New construction Q1 sales post a slight improvement over the previous quarter (2.3%) as well as the same quarter last year (4.8%), showing that this newly-built segment continues to be an obvious buyer favorite (fig. 2.3). The median price per sq. ft. remains flat quarter-to-quarter and year-over-year at $1,130/sq. ft., trending in the mid-range of median prices traced over the past five years (fig. 2.4).
Overall Sales Heatmap for Buildings Dated 2015-2020 - Fig. 2.3
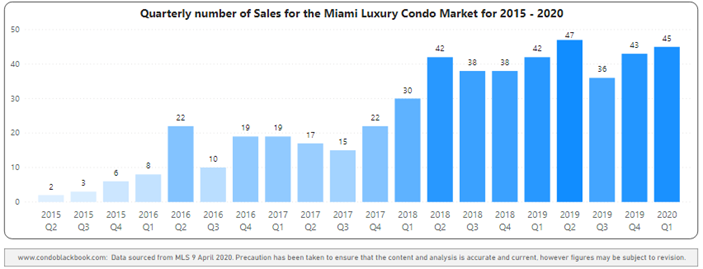
Overall Price per Sq. Ft. for Buildings Dated 2015-2020 - Fig. 2.4
BUILDINGS BUILT: 2000-2014
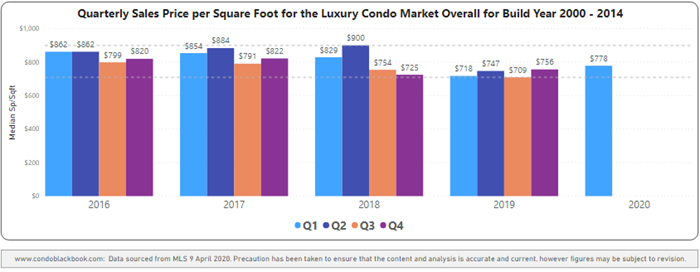
For Miami's newer buildings, sales cool only a bit after a good performance in Q4 last year. Still, Q1 sales are at par with the same quarter 2019, showing continued buyer interest (fig. 2.5). The median price per sq. ft. for the category is at its highest since Q3 2018, increasing from $718 in Q1 2019 to $778 in Q1 2020 (fig. 2.6).
Overall Sales Heatmap for Buildings Dated 2000-2014 - Fig. 2.5
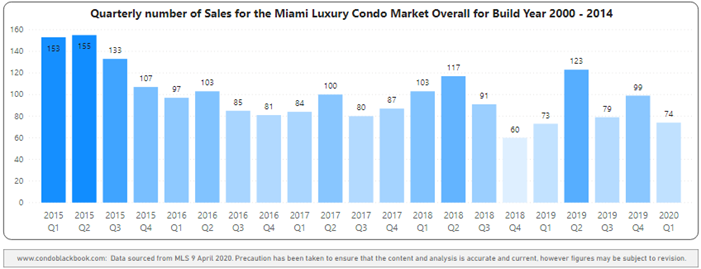
Overall Price per Sq. Ft. for Buildings Dated 2000-2014 - Fig. 2.6
BUILDINGS BUILT BEFORE YEAR 2000
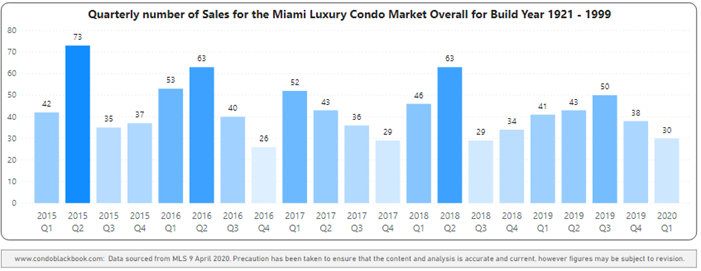
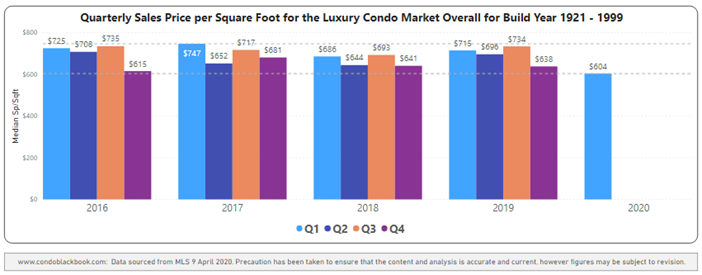
For Miami's older luxury buildings, sales drop quarter-to-quarter as well as year-over-year in this seasoned segment (fig. 3.8). The median price per sq. ft. closed at $604, trending at the lowest of all quarters since 2016 (fig. 3.9), making it a good time to buy into some of Miami's historically glamorous or architecturally significant older condo buildings.
Overall Sales Heatmap for Buildings Dated 1921-1999 - Fig. 2.7
Overall Price per Sq. Ft. for Buildings Dated 1921-1999 - Fig. 2.8
Overall Days on Market Flat QoQ, Down YoY
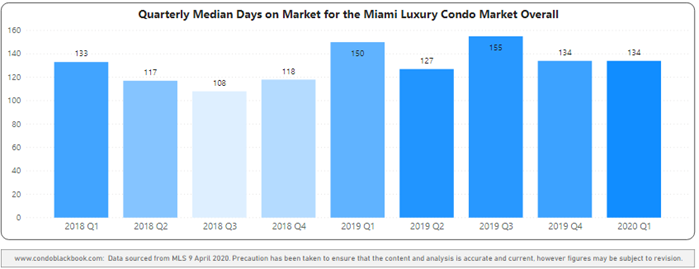
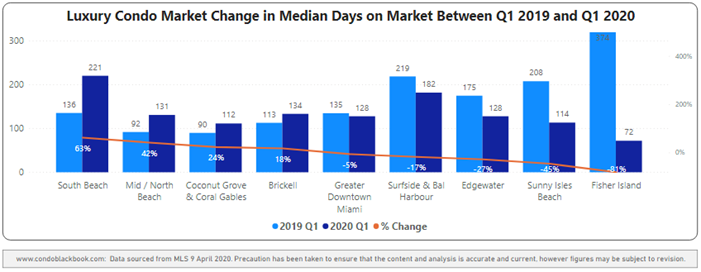
Days on market drop 10.7% year-over-year. With luxury condos spending 134 days on market (the same as last quarter), and 16 fewer days compared to Q1 last year, the metric reports a positive trend for the beginning of the year. This shows that buyers and sellers started the first quarter on a healthy note, being quicker to reach a consensus on deals.
Miami Overall Quarterly Days on Market 2018 - 2020 Heatmap - Fig. 3.1
Neighborhood Trends - Days on Market
Q1 Year-over-Year Days on Market Trends (fig. 3.2)
- In a positive indication, majority of neighborhoods report a decline in annual days on market - Fisher Island (-81%), Sunny Isles Beach (-45%), Edgewater (-27%), Surfside & Bal Harbour (-17%), Greater Downtown Miami (-5%)
- South Beach reports the highest increase of 85 days to a median of 221 days on market (63%) of all the neighborhoods studied
- Other neighborhoods with increases include Mid/North Beach (42%), Coconut Grove & Coral Gables (24%), and Brickell (18%)
Neighborhood 1Q20-Over-1Q19 Days on Market Comparison - Fig. 3.2
Inventory Down but High Levels Favor Buyers
Q1 closes with 45 months of inventory. In spite of slower sales, Miami's luxury condo market made progress this first quarter as the months of inventory posts a reduction. The figure is not only closer to December's 44 months, but also much lower than March last year's closing of 54 months. Still, numbers are way higher than the ideal 9-12-month benchmark. This gives buyers a great window of opportunity to have the upper hand in negotiations and drive deals in their favor.
Months of Inventory from Mar. 2019 to Mar. 2020 - Fig. 4.1
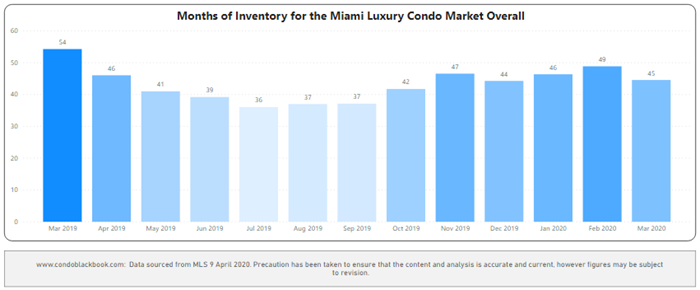
A balanced market has only 9-12 months of inventory. The months of inventory are calculated as – no. of active listings + no. of pending listings divided by the average number of deals in the last 6 months.
Conclusion
2020 off to a good start amid health crisis, stays buyer-friendly. Considering the sudden onset of the COVID-19 pandemic, the luxury condo market in Miami got off to a good start in 2020. Even though overall sales were softer than Q1 last year, if South Beach and Mid/North Beach (the only two neighborhoods with negative sales) were to be taken out of the mix, the rest of the Miami market actually reports a healthy year-over-year increase of 17%.
However, with prices continuing a slight downward trend, buyers especially have great opportunities for discounts in the older (built 1921-1999), sometimes historic section of the luxury condo market. The days on market too report declines, showing good market movement.
Q1 also comes in with good chips made in the months of inventory. However, with high levels to begin with, buyers still have the luxury of time and choices to seek out top deals as Miami's luxury condo market stays in their favor.
Luxury Market Predictions and Analysis: Where Does the Market Go From Here?
Miami's luxury condo market has stayed in favor of the buyer for the past couple of years, and the trend continues into 2020. We see the following factors making a major impact on the way the market behaves this year as well as extending the ongoing buyer-friendly cycle:
COVID-19 Crisis. There is no doubt that this unprecedented global situation has resulted in buyer hesitation – the full impact of which is expected to come through in the second quarter. However, with too many unknowns, it is too soon to predict how much and how long-lasting of an impact the pandemic will have on the real estate market, specifically the luxury condo segment in Miami.
Presidential Elections. Election years have historically resulted in some buyer hesitation. This year it is expected to be even more so with the addition of the coronavirus situation. However, it is expected that some emboldened buyers and investors will take advantage of distressed properties as the overall price pressure and economic challenges continue. Although, it's too soon to tell how extended what many see as a temporary distress might be and how big of an impact it will have once the pandemic dies down and the country gets back up and running.
Inventory. Regardless of COVID-19, the luxury condo market is still inventory-heavy in Miami. And, even though fewer pre-construction deliveries are scheduled for the year, the time frame to reach a balanced market has been extended for now.
Want more details on the data? Send us an email or give us a call. Love what you see? Don't forget to share our blog and subscribe (see the subscribe link on the top menu) to receive the latest market news in your inbox.
Share your thoughts with us
Your Miami Condo Awaits
Recent Posts
