Miami Luxury Condos: Q2 Report June 2017
Jul 19, 2017 July 19, 2017
Miami Luxury Condo Report Overall Market Summary
City and Neighborhood Luxury Condo Reports
Miami Beach Luxury Condo Report
South Beach Luxury Condo Report
Bal Harbour Luxury Condo Report
Sunny Isles Beach Luxury Condo Report
Coconut Grove Luxury Condo Report
Greater Downtown Miami Luxury Condo Report
Edgewater / Midtown / A&E District Luxury Condo Report
Coral Gables Luxury Condo Report
Miami Luxury Condo Market Report: Summary back to top
With June’s numbers in, we have the analysis for the second quarter of the year. This in-depth, luxury condo market report only features properties priced $600,000 and above.
Overall Market Highlights:
- Overall quarterly sales up 10%, monthly numbers still no match for previous years
- Median days on market reduced by growing sales
- Quarterly sales price and price/sq. ft. pushed down by buyers market
- Months of inventory marginally down, sellers might need to be more flexible
- Most neighborhoods followed the overall market trend in June
- Market still favors buyers, giving them the benefit of time and control over negotiations
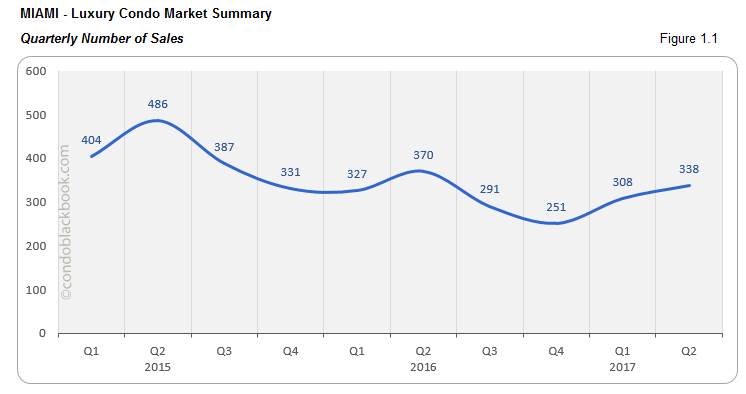
Quarterly sales volume up, but June posts slower progress. June went by quieter than May, with most neighborhoods posting a negative trend. However, this cannot be written off as a market slowdown yet, since the quarterly numbers have posted an increase – showing a definite improvement in the bigger picture. With the sales graph yo-yoing, it is too early to draw any conclusions on whether the market is on the road to recovery or not.
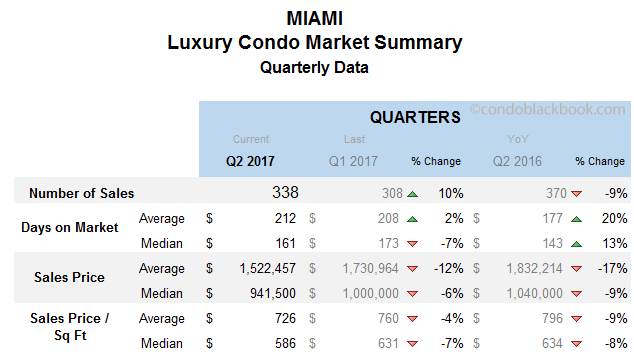
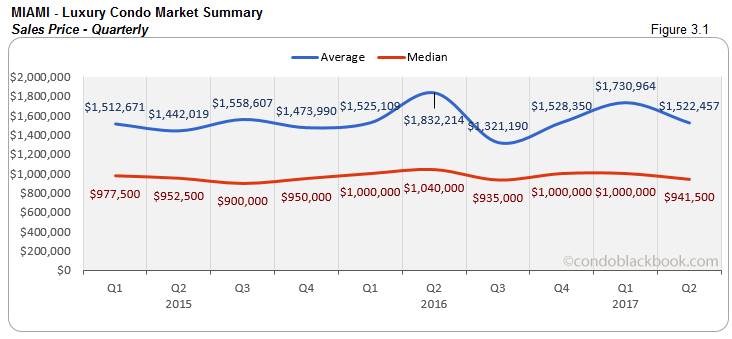
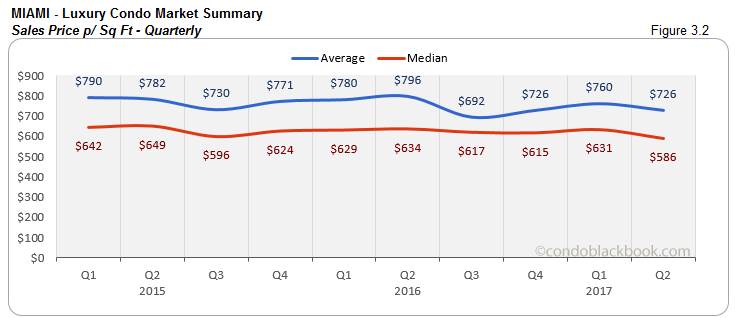
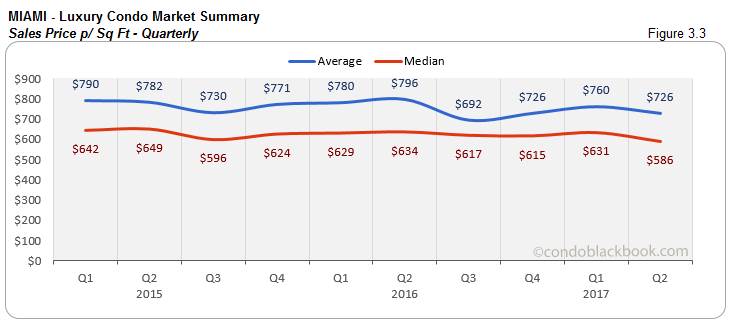
Buyer’s market drives down prices, in turn fueling sales. This quarter’s overall market summary chart below shows how the buyer’s market has pushed down median prices. This in turn fueled the increase in sales we see in fig. 1.1. The median sale price per square foot in Miami dropped down to $586 by the end of the second quarter, which is 7% lower than the first.
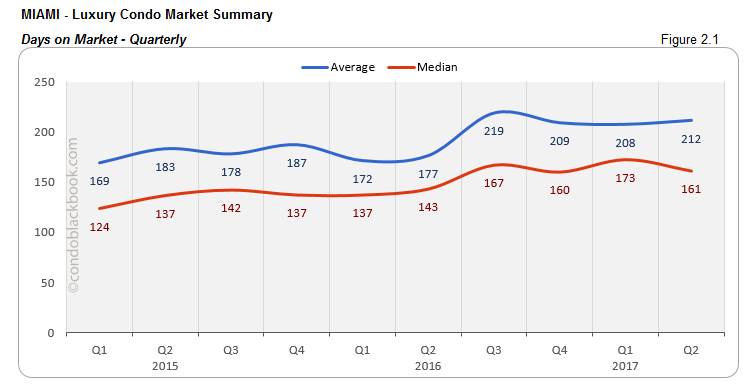
Days on Market finally descend, inventory down too. Finally, the progress in sales over the past couple of months has come through to post a decline in the median ‘Days on Market’ for this second quarter (fig. 2.1). Talking about June, most neighborhoods registered a decrease in days on market, showing that sellers are being realistic and giving buyers enough reason to be motivated.
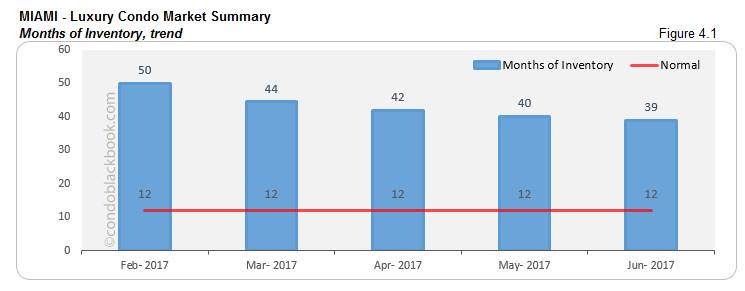
On the other hand, inventory has steadily been decreasing, which is definitely a positive for the luxury condo market. But, 39 is still a long way off from the 12 months of a balanced market.
Overall, I’d say signs of improvement are there, but it is still too early to predict how long it would take the new up-cycle to start. Till then, prospective buyers can enjoy the luxuries (read negotiation power) a buyer’s market brings along.
How Did We Get Here, and What Is the Miami Condo Market Prediction? back to top
Our previous reports have detailed how a strengthening U.S. dollar, strong stock market, Zika, shaky start to the presidency and a desire for tax breaks by the wealthy are the real reasons behind the current sales slowdown. While Zika’s effects may be wearing off, there are still a lot of other factors to work through before this surplus inventory can be absorbed, which will probably take another 12 months or more overall.
Much of what happens next depends on what the new presidential administration can do in terms of tax benefits for the wealthy and overall econimic stimulus for small businesses. That will likely give many would-be buyers the confidence to pull the trigger on a home upgrade or a second home in South Florida. In addition, if the dollar weakens, as some are predicting, that will bring back the foreign nationals that fueled the last boom.
Some sub-markets that don't have a lot of new inventory coming may find themselved recovering faster. Until such time, buyers can enjoy being in control and grab some great deals in the process.
Below is an insight into Miami’s overall and neighborhood-level luxury condo trends for June 2017:
Monthly Number of Sales - Miami Luxury Condo Market Overall back to top
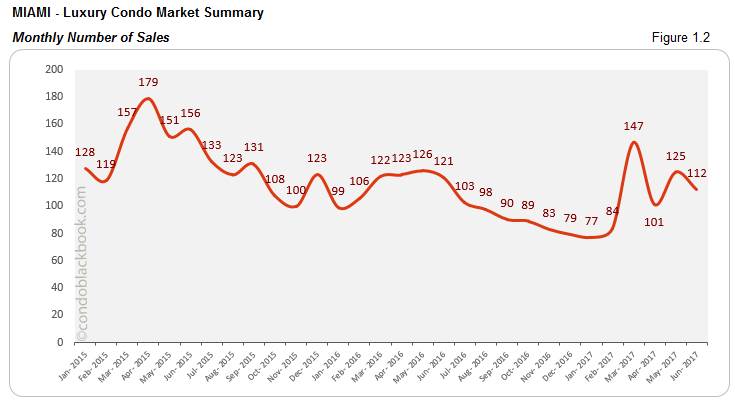
- Quarterly sales hike 10%. There are great expectations of the luxury condo market this year. And, the second quarter delivers marginally. The quarterly sales have come back to post an uptick (fig. 1.1) of 10% over the first quarter. However, comparing this second quarter year-over-year, we can see a decline of 9% (refer quarterly data summary chart).
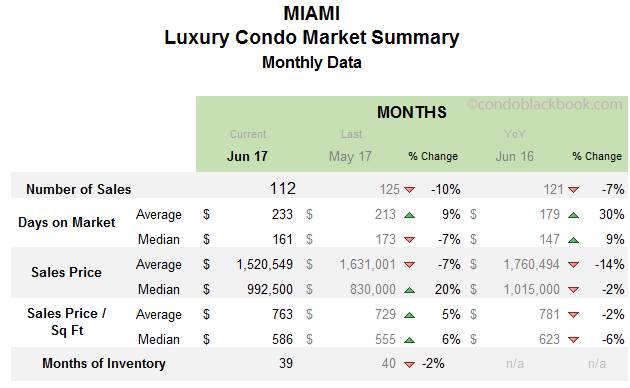
- Monthly sales chug along, but struggle year-over-year. June’s sales have crossed the 110 mark, posting some growth. However, they still lagged 10% since May and 7% year-over-year (monthly data summary chart). Though the sales picture is looking positive, the market is still favoring buyers.
Days on Market - Miami Luxury Condo Market Overall back to top
“Days on market” are the total number of days from when a property is active to the day it sells.
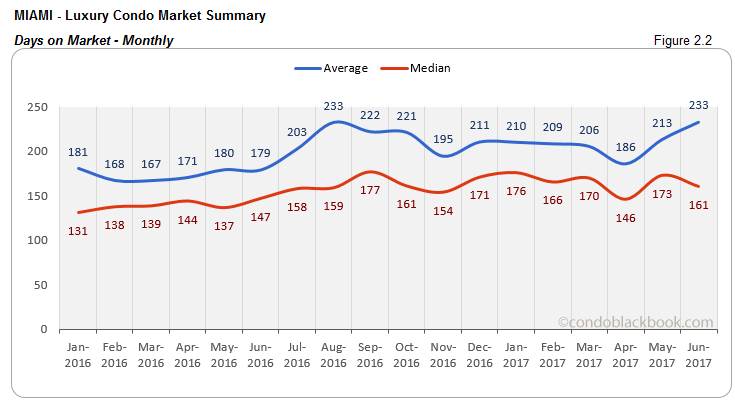
- Median days on market first to recede. Even though sales have been posting a positive trend for the past couple of months, they are not yet strong enough to make a major impact on days on market. As you’ll notice in fig. 2.1 and 2.2, the average days are still high, but the median days have started their downward trek. If the market upholds its trend of positive sales, we will see a deeper plunge in the charts, which is a positive sign for the market.
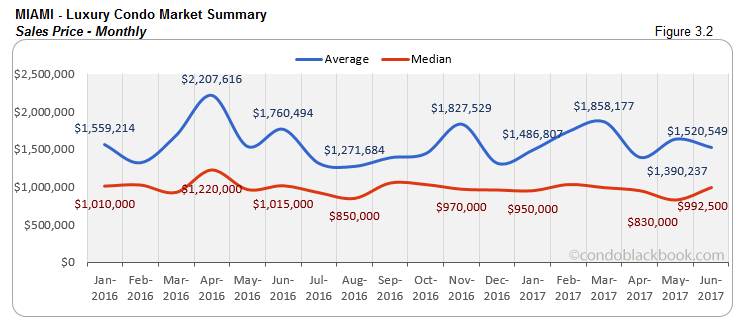
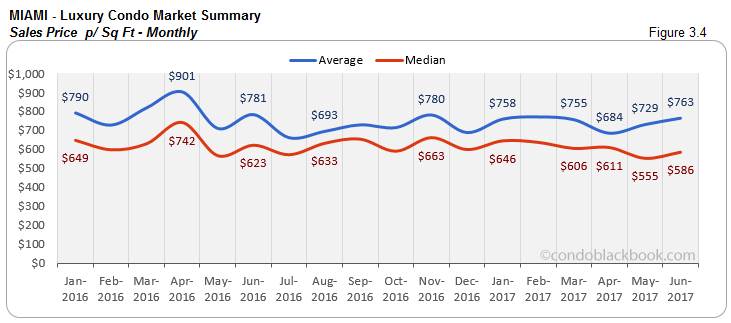
Sales Price Trends - Miami Luxury Condo Market Overall back to top
- Buyer’s market pushes down quarterly prices. The quarterly charts for both, sales price and price/sq. ft. (fig. 3.1 and 3.3) illustrate the impact of the current buyer’s market. This downward trend has been the main fuel for the increase in sales we’ve seen over the past couple of months. So, if buyers are listening, they will need to maintain their flexibility, if they want their listing to get off the market soon.
Inventory Trends - Miami Luxury Condo Market Overall back to top
A balanced market will only have 9-12 months of inventory.
- 39 months of inventory. June had 3.78k active luxury condo listings on the market, with another 169 pending. Considering inventory moves at an average (last 6 months) of 101 deals a month, there is now 39 months of inventory overall.
- Slow-paced decline. The month of June witnessed a much smaller shift down in inventory at 2%. The previous months had posted a 5% decline at least (fig. 4.1). It seems that both sellers and buyers are treading with caution in the current market situation. It will be quite the wait till we get back to the normal of 9-12 months.
City and Neighborhood Market Reports back to top
Miami Beach Luxury Condo Market Summary back to top
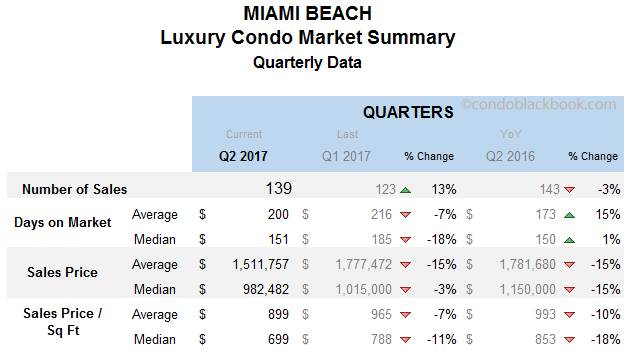
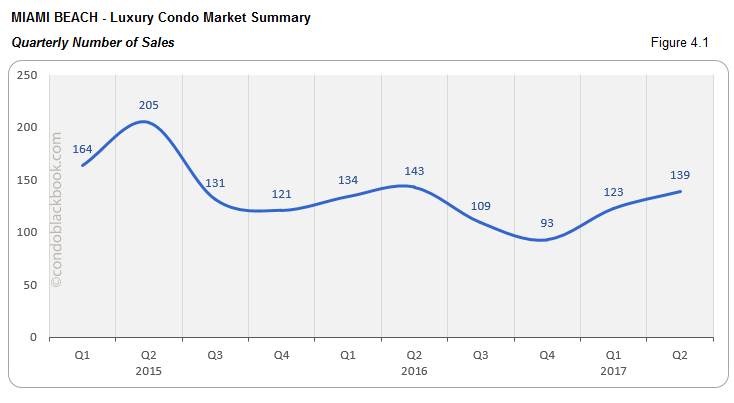
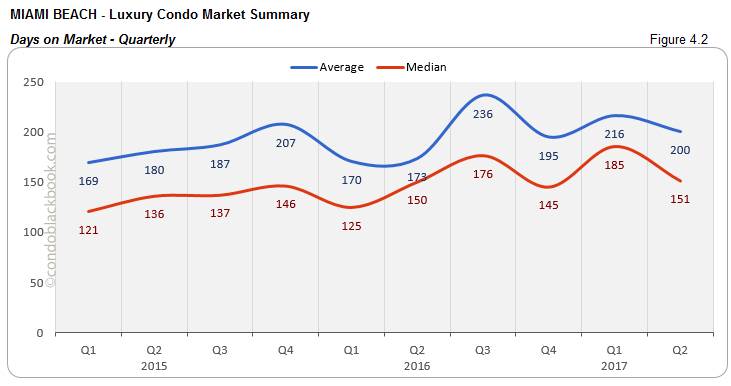
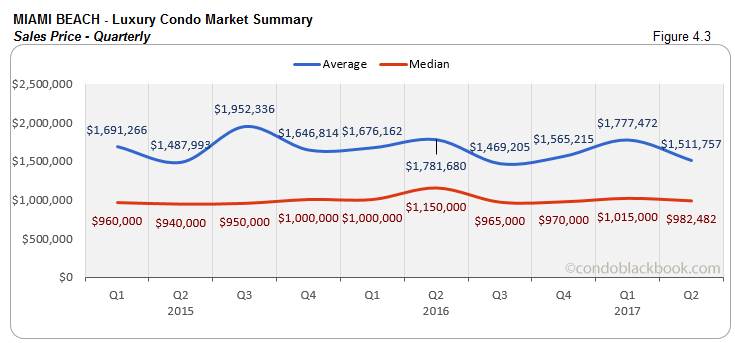
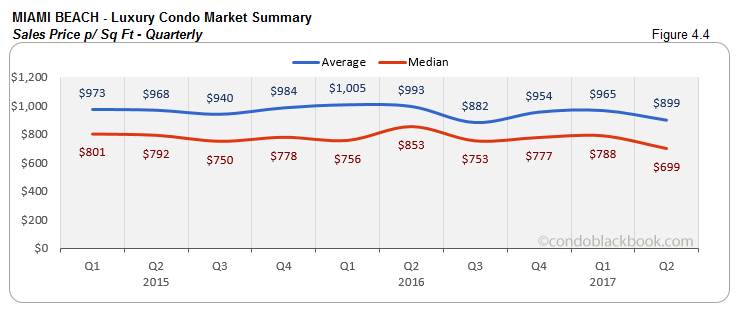
- Higher quarterly sales and lower prices push down days on market. Overall, Miami Beach real estate market trends are heading toward a healthier pattern. The second quarter did well by posting 13% more sales than the previous, but they were still 3% lower year-over-year (fig. 4.1). The buyer’s market is making a visible impact on the price and price/sq. ft. (fig. 4.3 and 4.4) by driving both the averages and medians down. This finally makes the median days on market (fig. 4.2) deflate 18%, meaning momentum is picking up.
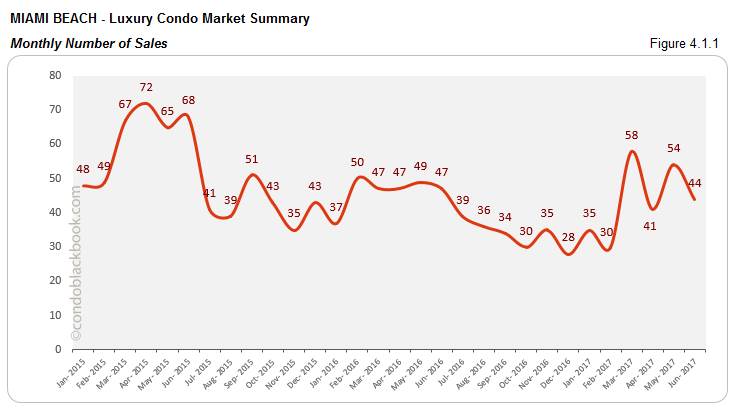
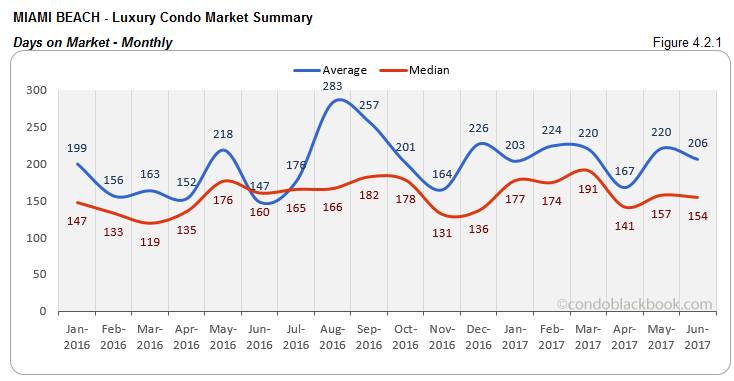
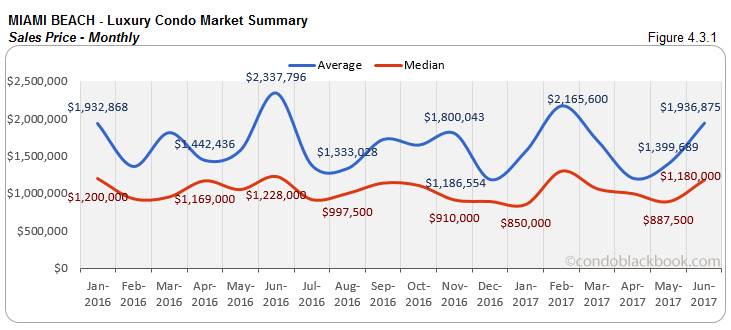
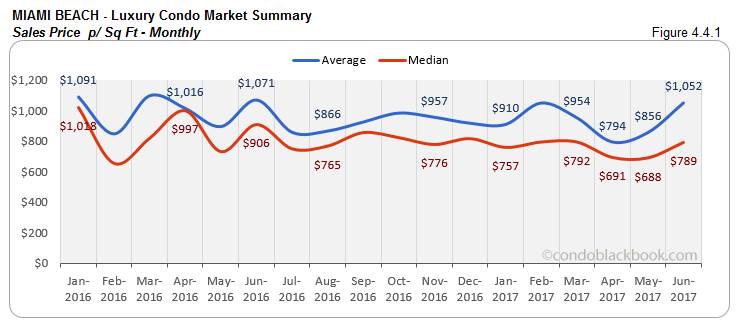
- Monthly sales perform marginally as prices kick up, though days on market reduce. On the other hand, we have June reporting 19% less sales month-on-month and 6% less year-over-year. Progress is visibly quieter than the previous months (fig. 4.1.1). Surprisingly, we have the sale price and price/sq. ft. kicking up a notch (fig. 4.3.1 and 4.4.1). For now the median days on market have dropped 2% (fig. 4.2.1), but sellers will have to be flexible if they want their listings moving off sooner.
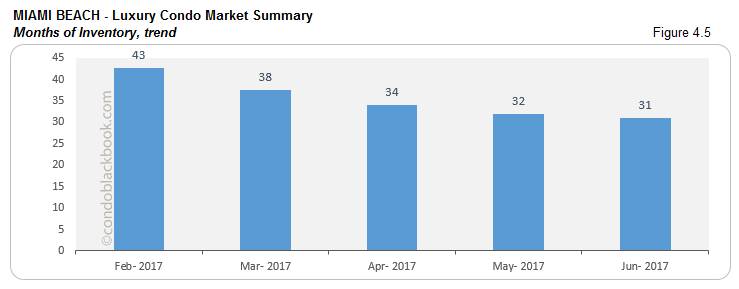
- 31 months of inventory, buyers get the pick of the litter. In June, Miami Beach reported 1199 active luxury condo listings, plus another 59 pending. With inventory moving at an average (last 6 months) of 41 deals a month, there is still 31 months’ worth on the market (fig. 4.5). This is way higher than the 9-12 months of a balanced market. With plenty of listings and a buyer-friendly market make it the perfect time to go shopping for Miami Beach condos here.
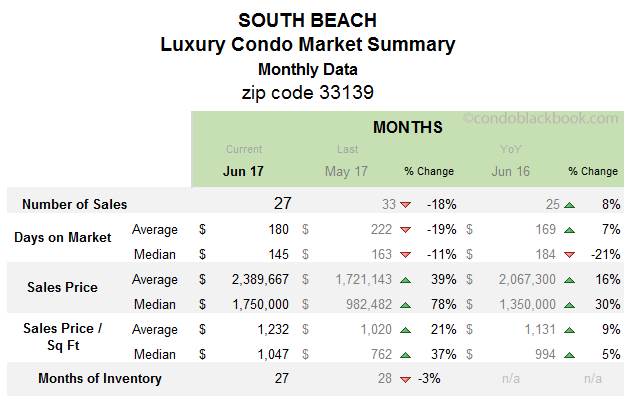
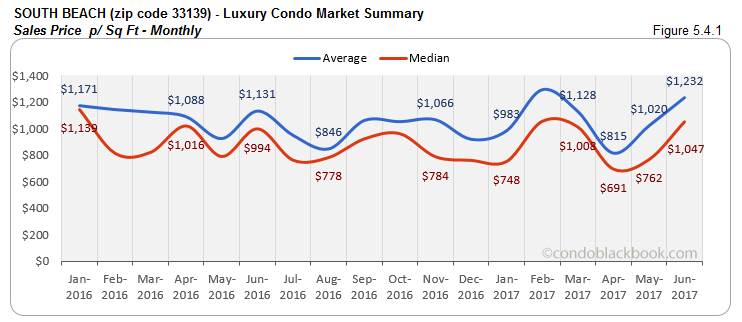
South Beach Luxury Condo Market Summary (33139 zip) back to top
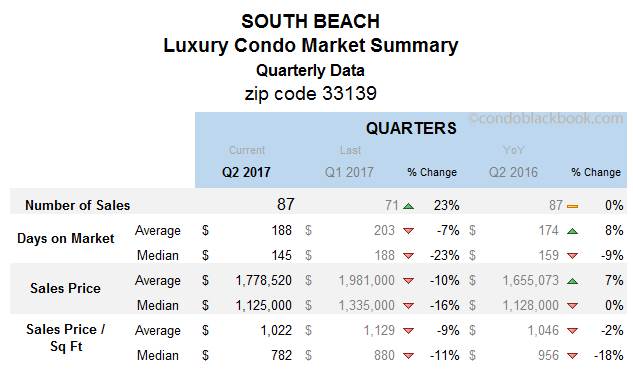
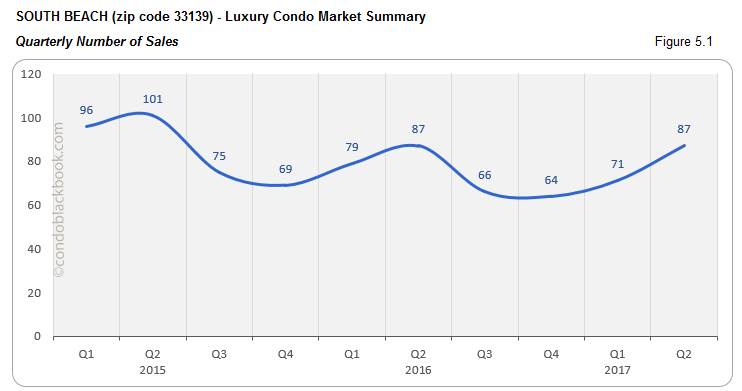
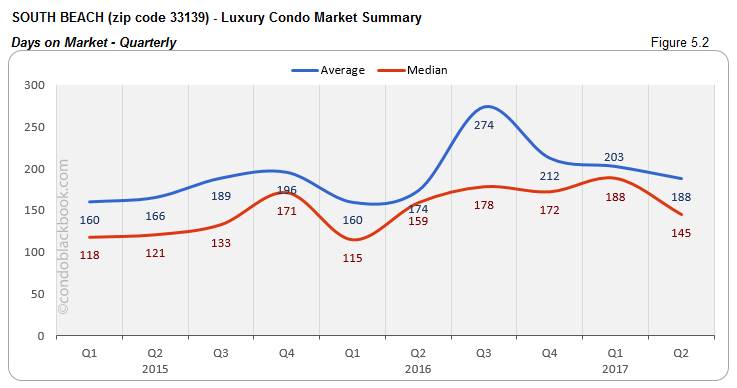
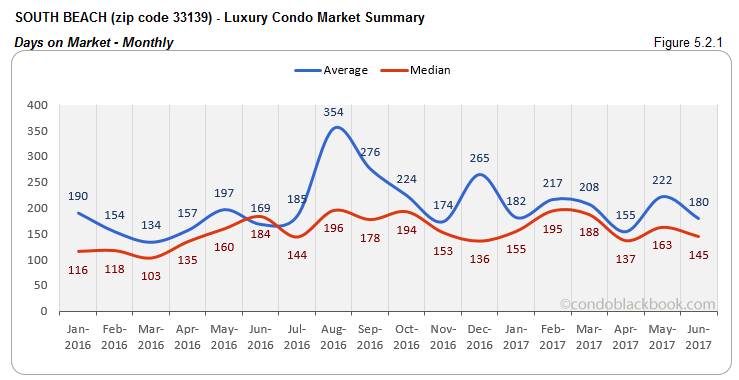
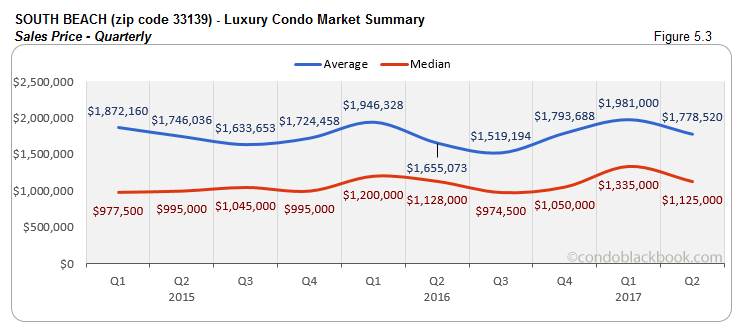
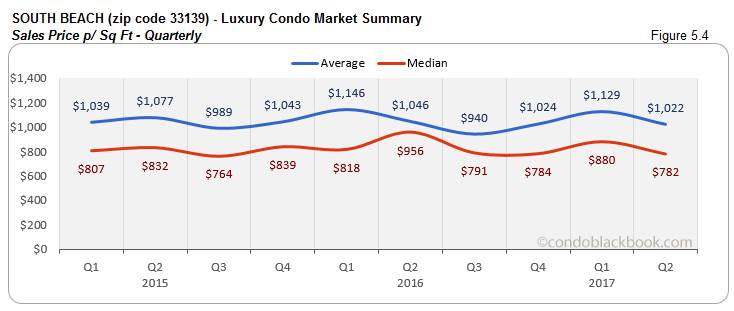
- Quarterly sales up 23% with lower prices and days on market. The median sales price and price/sq. ft. have gone down in South Beach by 16% and 11%, respectively this quarter (fig. 5.3 and 5.4). This has sales numbers climbing up (fig. 5.1). And, together they’ve managed to push down the median days on market by a good 23% (fig. 5.2).
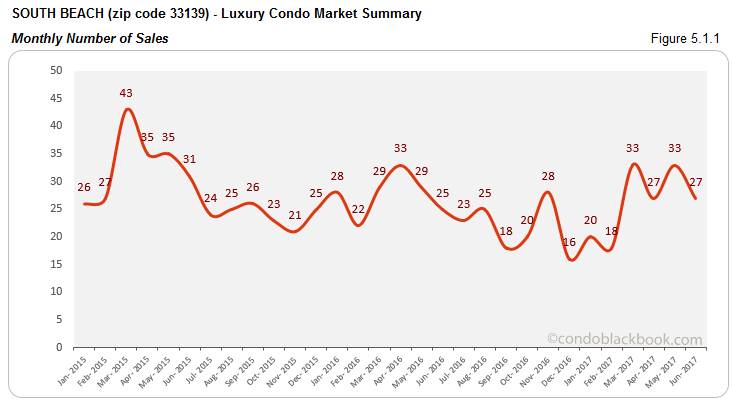
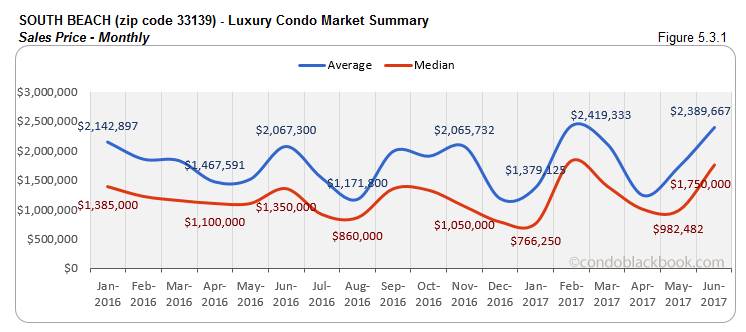
- Monthly sales lower and prices kick up, but days on market post descend. June saw an 18% decrease in sales, but they were still 8% more than last year (fig. 5.1.1). This had the median days on market reducing 11% (fig. 5.2.1). However, both the median sales price and price/sq. ft. went up a whopping 78% and 37%, respectively in June (fig. 5.3.1 and 5.4.1). This seems to be an anomaly. Future months will make that more clear.
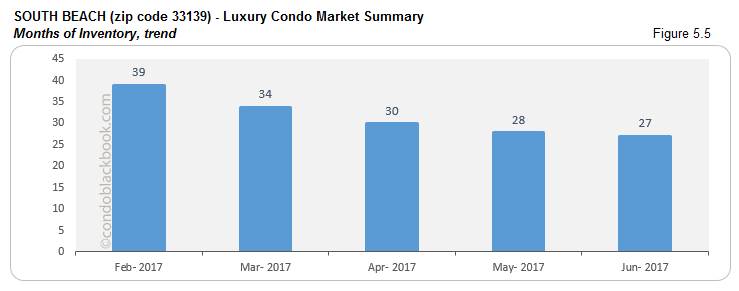
- 27 months of inventory and a buyer-friendly market. June posted 655 active luxury condo listings, with another 28 pending. Considering inventory moves at an average (last 6 months) of 25 deals a month, South Beach still has 27 months of inventory left. This is much higher than the 9-12 months of a normal market and has only dropped 3% since May (fig. 5.5). Buyers can make the most of this surplus inventory and market by searching South Beach condos for sale here or look up this beach paradise’ lifestyle and amenities here.
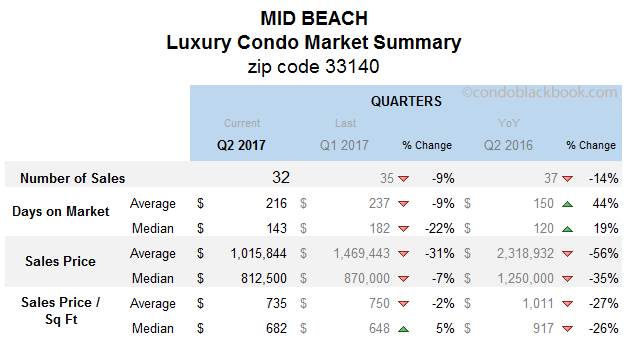
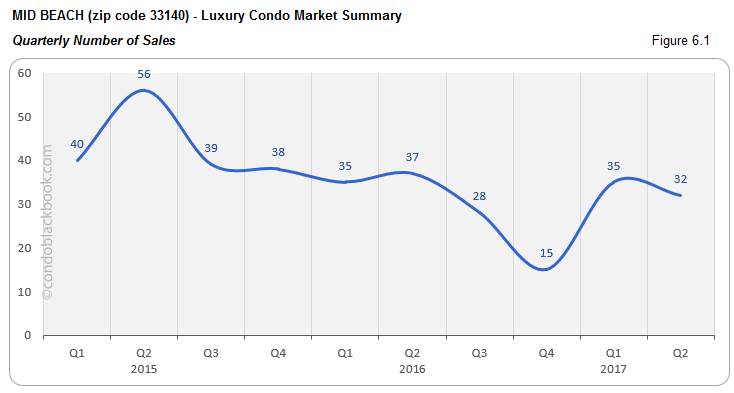
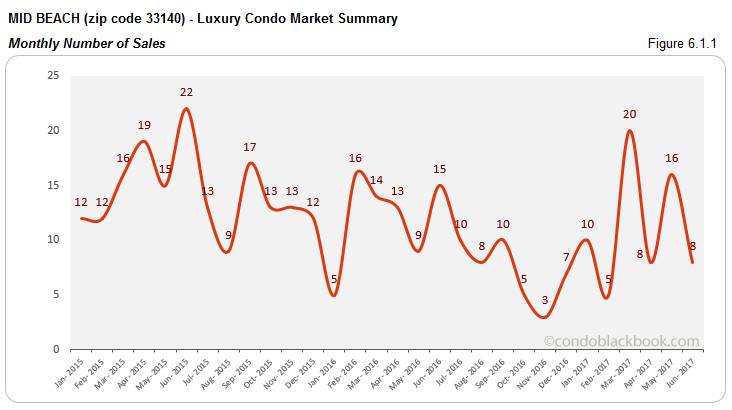
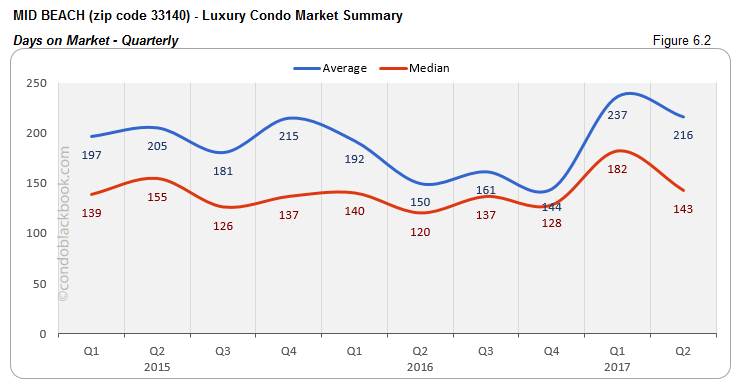
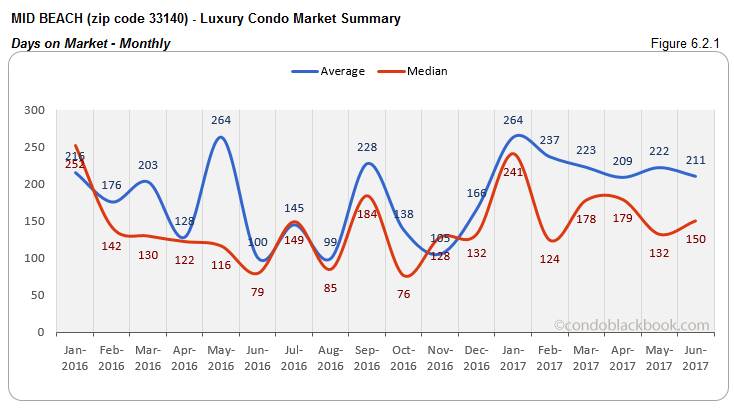
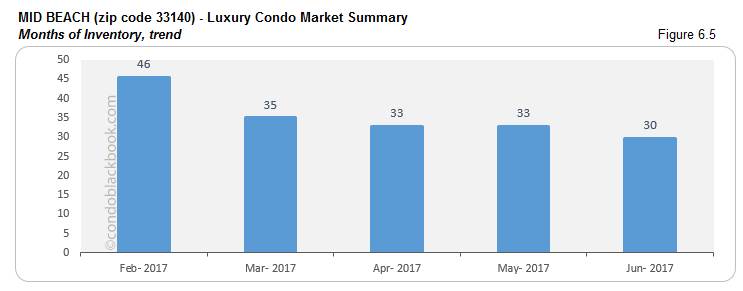
Mid-Beach Luxury Condo Market Summary (33140 zip) back to top
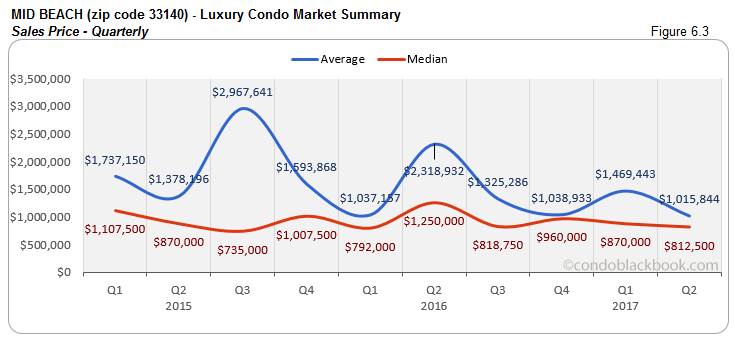
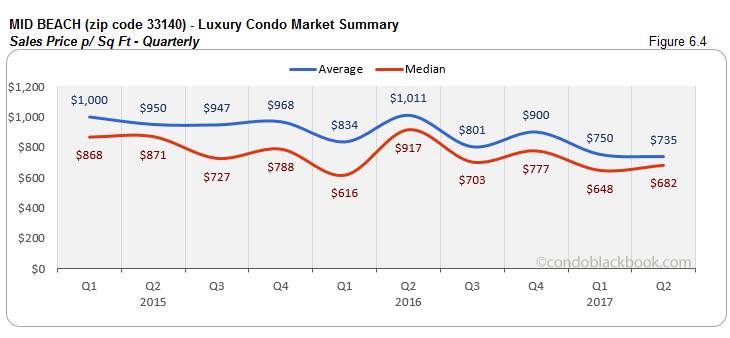
- Quarterly sales slower with lower prices and days on market. Mid-Beach goes astray from the market overall (fig. 1.1) when it comes to sales this quarter. It posts a 9% decline (fig. 6.1). However, the median days on market (fig. 6.2) reduce 22% to demonstrate progress was made. The buyer’s market takes effect as median prices (fig. 6.3) come down 7%, but oddly the median price/sq. ft. (fig. 6.4) went up 5%.
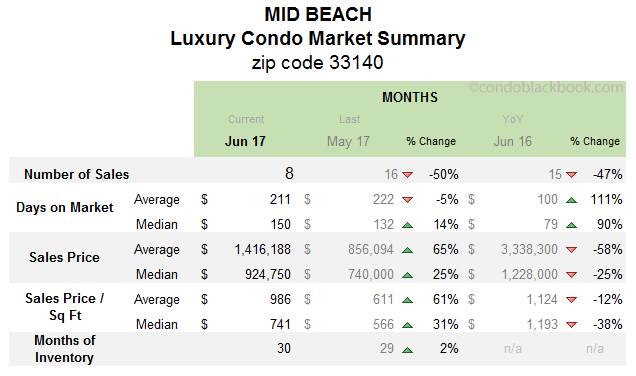
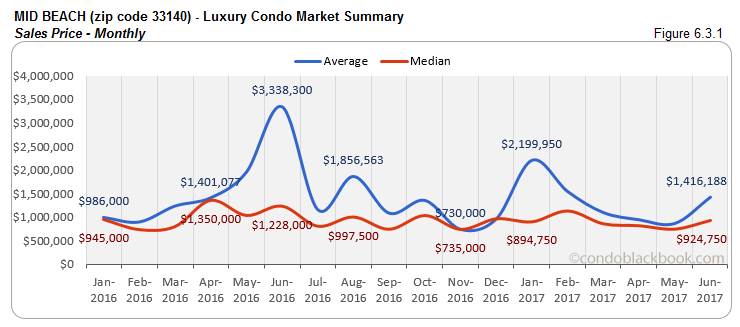
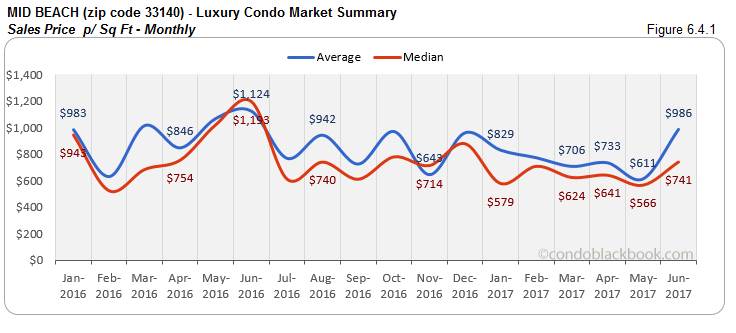
- Monthly sales slow down with higher days on market and prices. Sales were a bit sticky in Mid-Beach this June, as they posted a 50% decline (fig. 6.1.1). Days on market increased 14% (fig. 6.2.1). The sales price and price/sq. ft. also posted an uptick for the neighborhood (fig. 6.3.1 and 6.4.1).
- 30 months of inventory provide buyers ample choices. For June, Mid-Beach posted 270 active listings, plus another 17 pending. With inventory moving at an average (last 6 months) pace of 10 deals a month, there is still 30 months of inventory on the market (fig. 6.5). This being way off the 9-12 month normal of a balanced market, buyers clearly have an advantage. Search Mid-Beach condos for sale here or take a tour around Mid-Beach here.
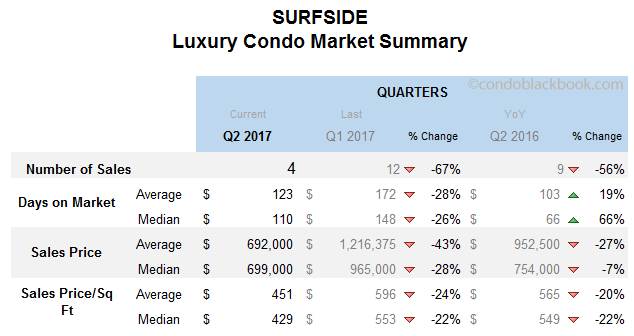
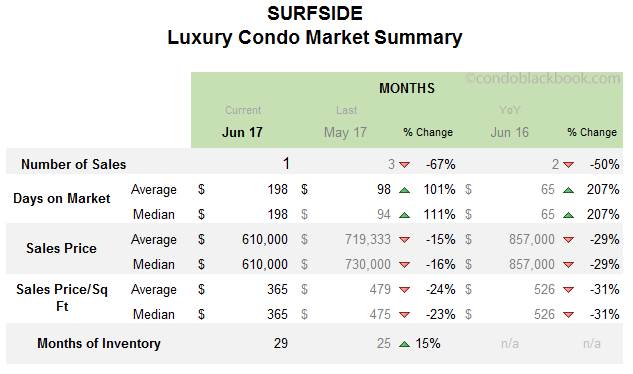
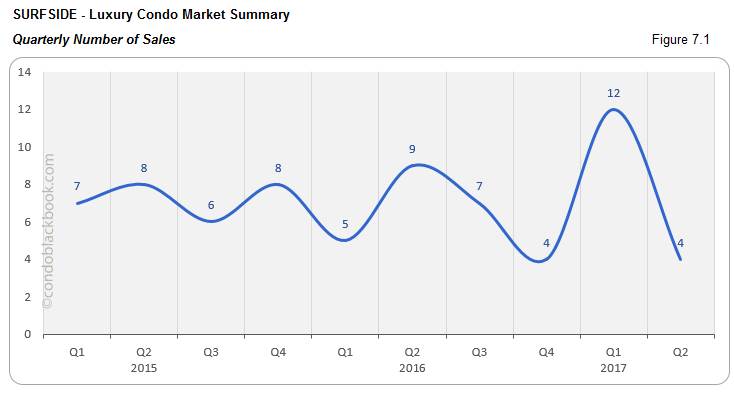
Surfside Luxury Condo Market Summary back to top
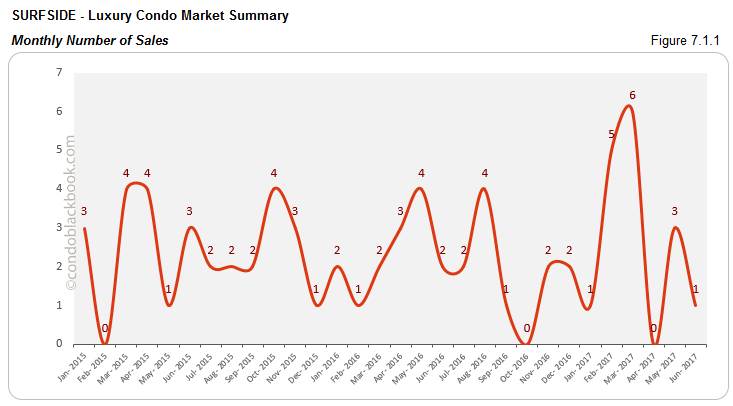
- Quarterly sales dive. April’s zero sales are what make Surfside’s quarterly numbers skewed (fig. 7.1). Considering Surfside has a very modest luxury condo market to begin with, it is not unusual for its charts to dance to their own tune.
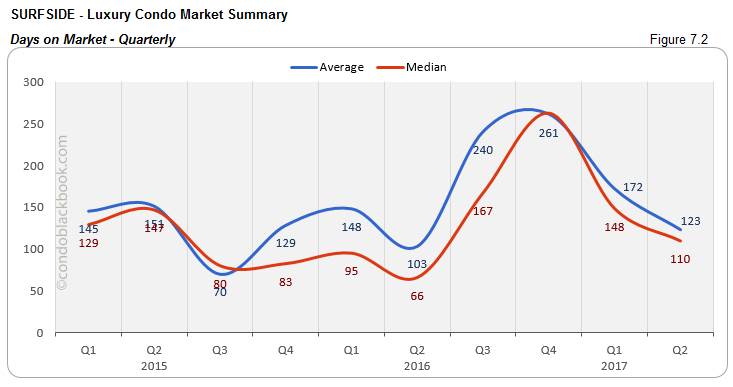
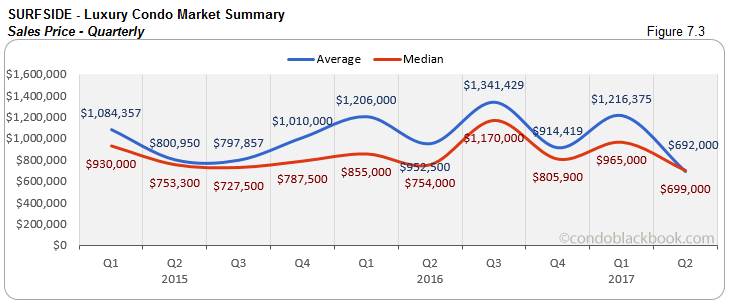
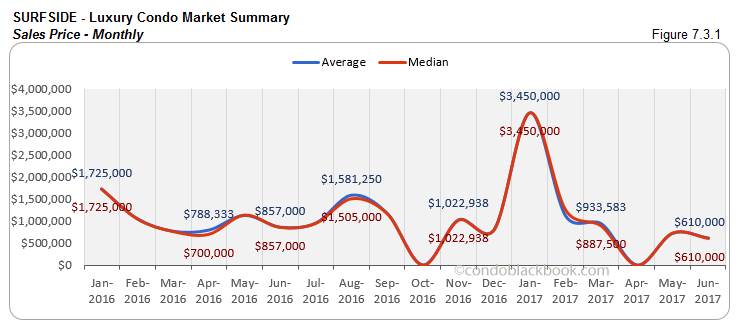
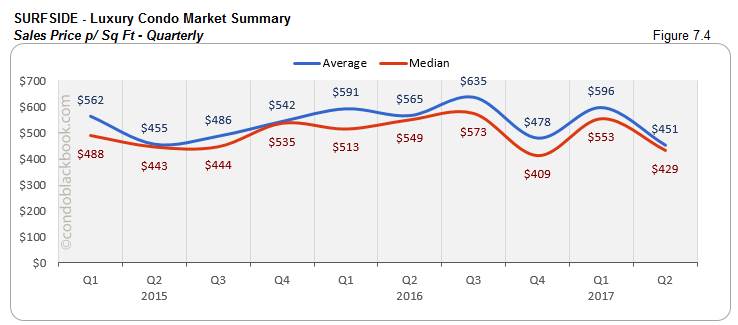
- Days on market and prices decline. Usually on a path of its own, the days on market (fig. 7.2) and median price (fig. 7.3 and 7.4) charts for Surfside are in tandem with the market overalls (fig. 2.1, 3.2 and 3.4) this quarter. This means sellers are revising their prices according to the current market situation, which has helped properties get off the market.
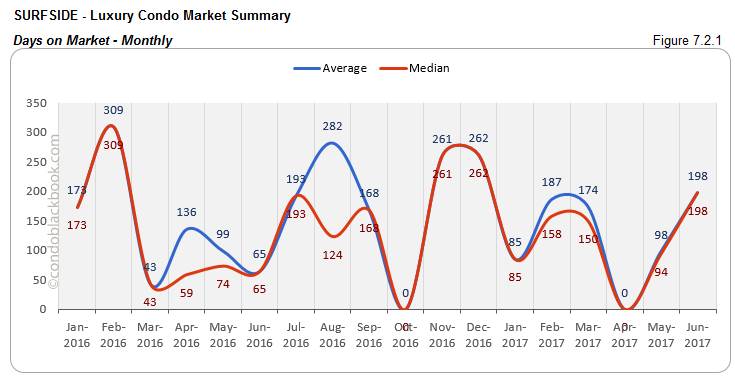
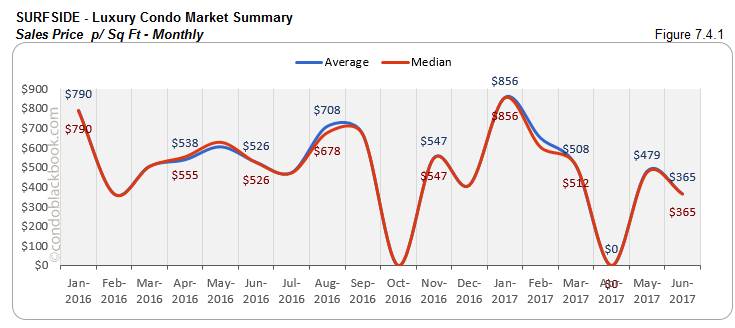
- Monthly sales, prices and days on market post a decrease. June posted 67% fewer luxury condo sales (fig. 7.1.1) than May in Surfside. This is what has the median days on market with the highest inflation in the market, up by 111% (fig. 7.2.1). However, the median sales price (fig. 7.3.1) and price/sq. ft. (fig. 7.4.1) have dropped 16% and 23%, respectively to accommodate the current buyer’s market.
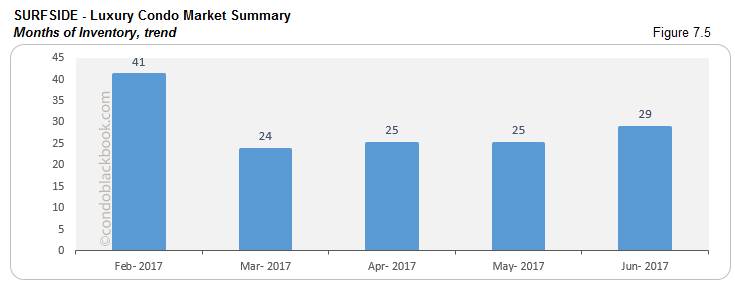
- Months of inventory up 15%, buyers get upper hand. June saw 69 active luxury condo listings in Surfside, plus 3 pending. With inventory moving at an average (last 6 months) pace of 3 deals a month, the beach community still has 29 months’ worth of inventory on the market (fig. 7.5). This is much higher than the 9-12 months of a balanced market. With so many choices at hand and drop in prices, it’s a great time to search a Surfside condo for sale here, or see what lifestyle makes up this chic Surfside community.
Bal Harbour Luxury Condo Market Summary back to top
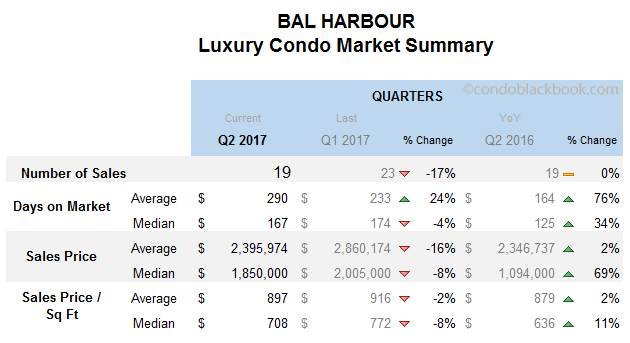
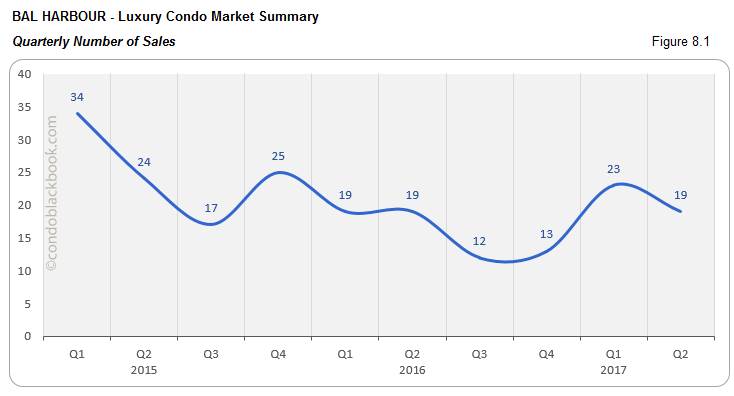
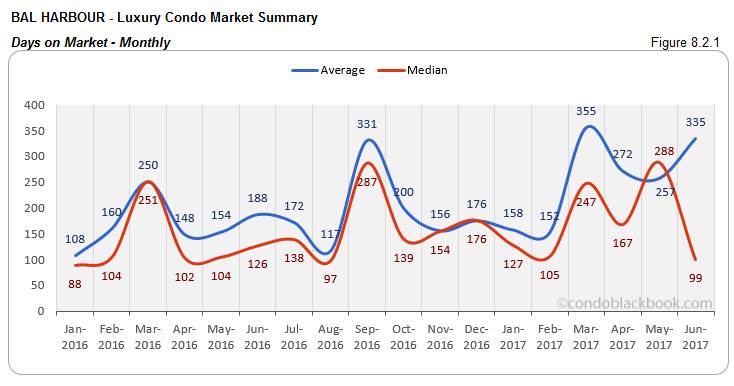
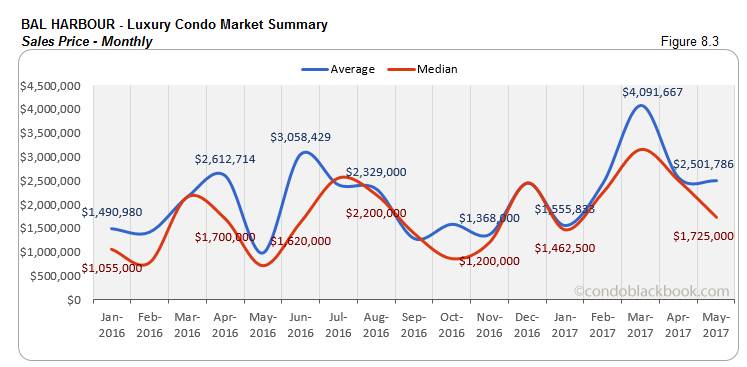
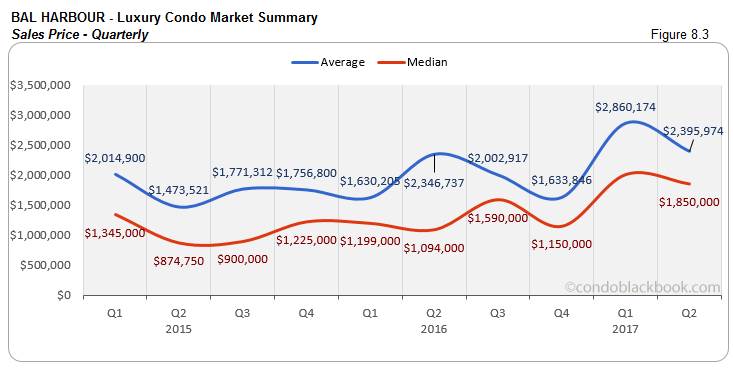
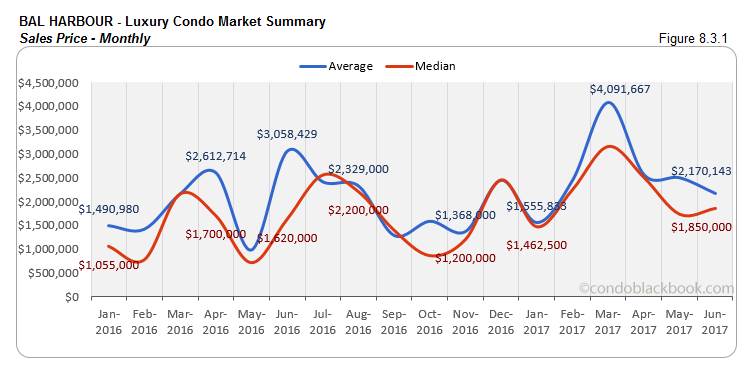
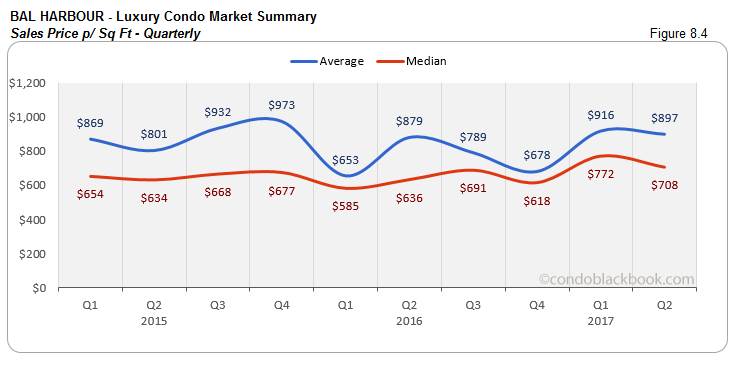
- Quarterly sales, median days on market and prices decline. The luxury condo market was quieter in Q2 than Q1 on the sales front (fig. 8.1). However, the median days on market (fig. 8.2) post a 4% decline. This could be correlated to the 8% decline in both, the median sales price (fig. 8.3) and price/sq. ft. (fig. 8.4).
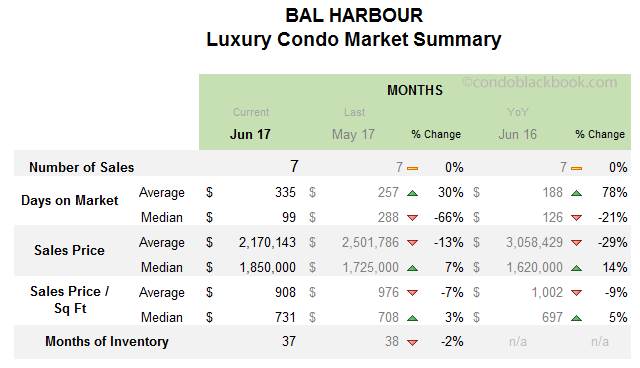
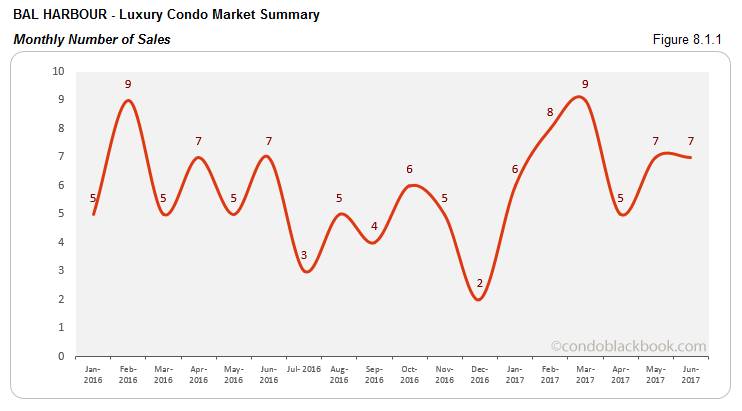
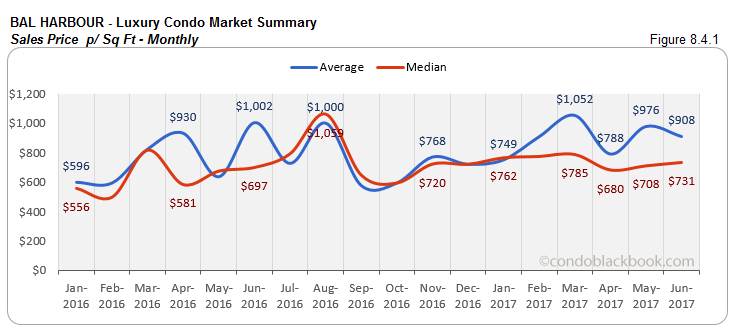
- Monthly sales sustain, days on market drop, but median prices rise. June matches May’s sales numbers (fig. 8.1.1) in Bal Harbour. The recent sales momentum has helped push down median days on market (fig. 8.2.1) by a good 66%. It also may mean that new entrants to the market are being smarter with their pricing strategies. However, the median sales price (fig. 8.3.1) and median price/sq. ft. (fig. 8.4.1) is showing an increase of 7%.
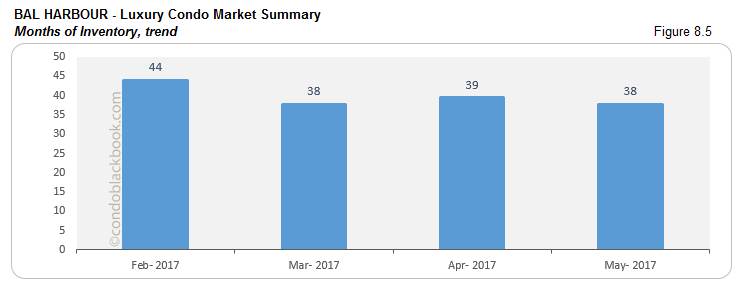
- Marginal decline in months of inventory, buyers retain edge. In June, there were 217 active luxury condo listings on the market, plus 8 pending. With inventory moving at an average (last 6 months) of 6 deals a month, there is still 37 months of inventory on the market (fig. 8.5). Even though inventory is down 2%, it is still far from the 9-12 months of a balanced market. Buyers can make the most of this surplus by searching Bal Harbour condos for sale here, or check out the upscale neighborhood Bal Harbour here.

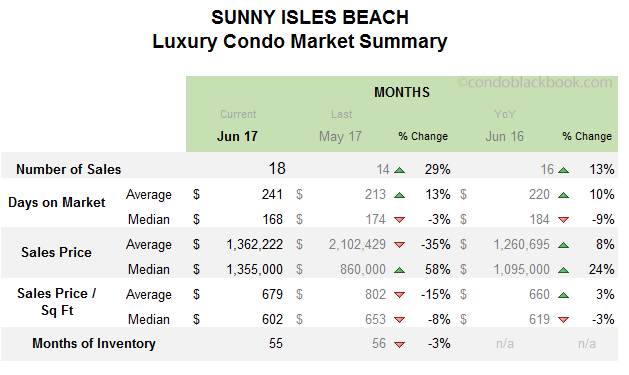
Sunny Isles Beach Luxury Condo Market Summary back to top
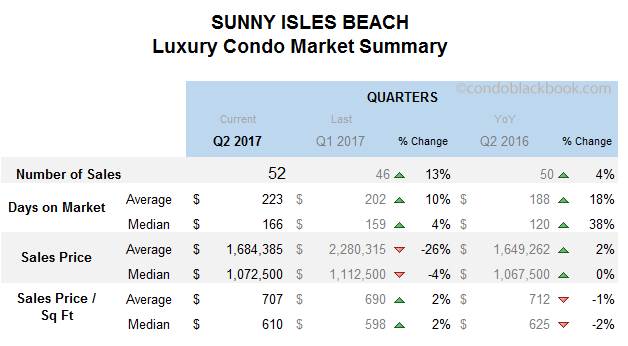
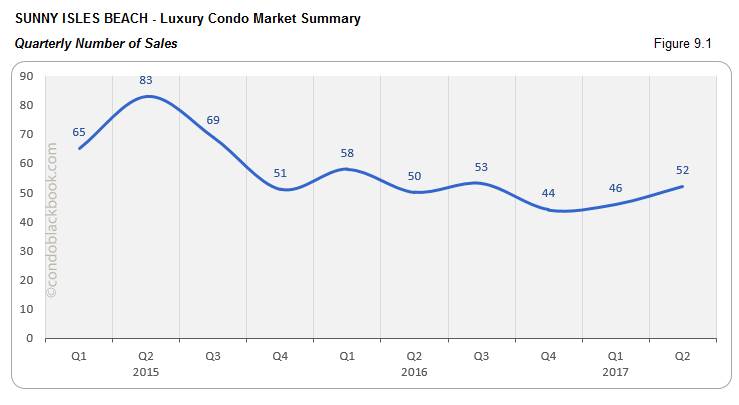
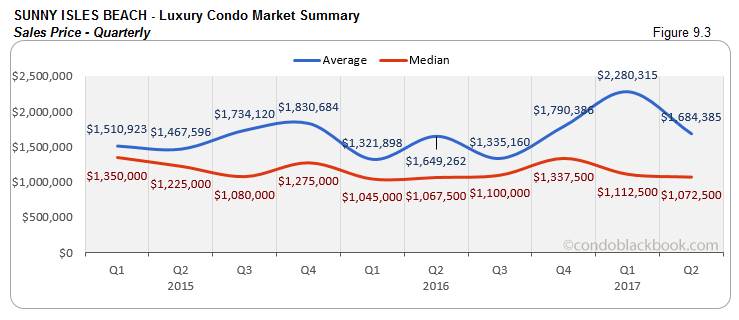
Quarterly sales high, but days on market increase. Sunny Isles Beach has turned into the brand corridor of Miami with Armani and Porsche debuting here – and the numbers show for it. Sales for Q2 are up 13% (fig. 9.1). However, the median days on market still climbed 4% (fig. 9.2).
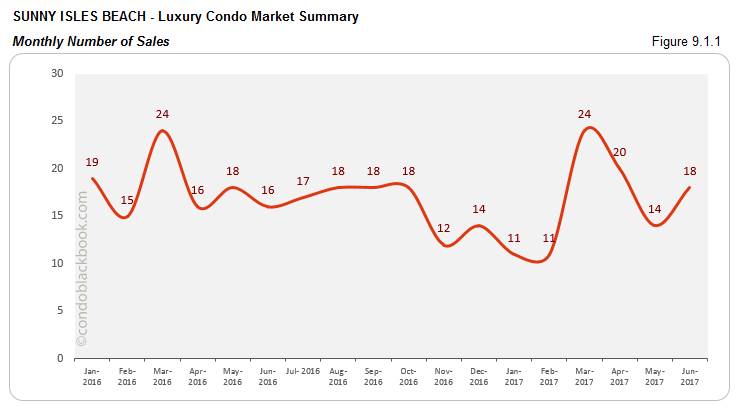
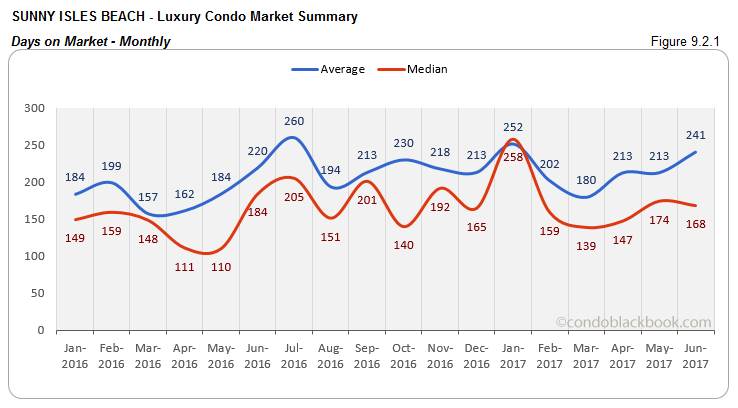
- Monthly sales climb to drive down days on market. June’s sales performed very well by going up 29% (fig. 9.1.1). This momentum helped push down the median days on market by 3% (fig. 9.2.1).
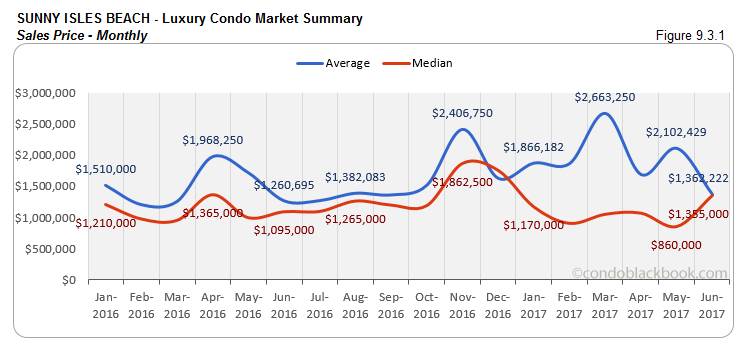
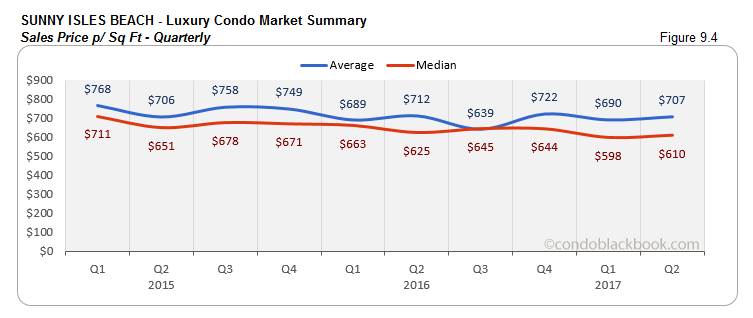
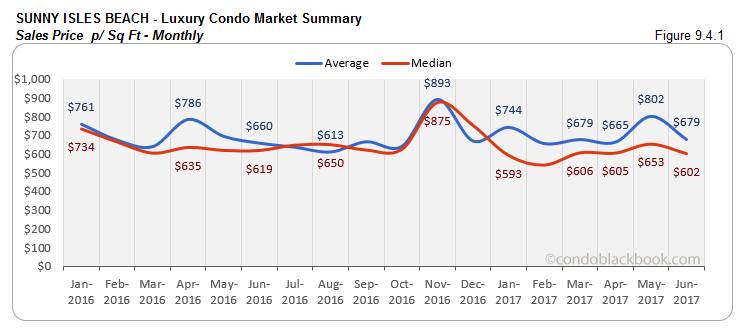
- Prices show volatility. Perhaps a number of upcoming ultra-luxury properties are causing volatility in the quarterly and monthly sales prices. The quarterly median sales price has decreased 4% (fig. 9.3), whereas median price/sq. ft. climbed up 2% (fig. 9.4). On the other hand, the monthly median sales price jumped 58% (fig. 9.3.1), while median price/sq. ft. fell 8% (fig. 9.4.1).
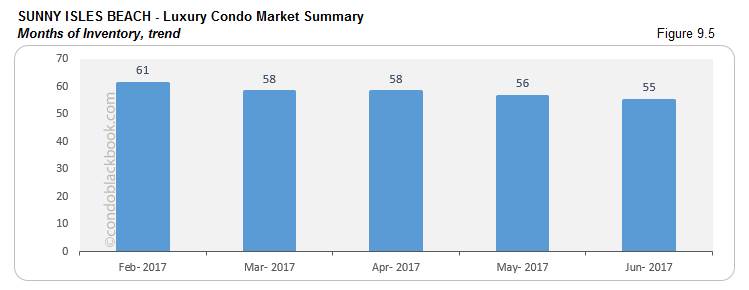
- Months of inventory down 3%, but surplus still high. June saw 824 active listings, with another 27 pending. Considering inventory moves at an average (last 6 months) of 16 deals a month, Sunny Isles Beach has 55 months of inventory on the market (fig. 9.5). This is way higher than the 9-12 months of a normal market. So buyers still have time to take advantage of surplus inventory and search Sunny Isles Beach condos for sale here or tour the amenities and lifestyle in Sunny Isles Beach here.

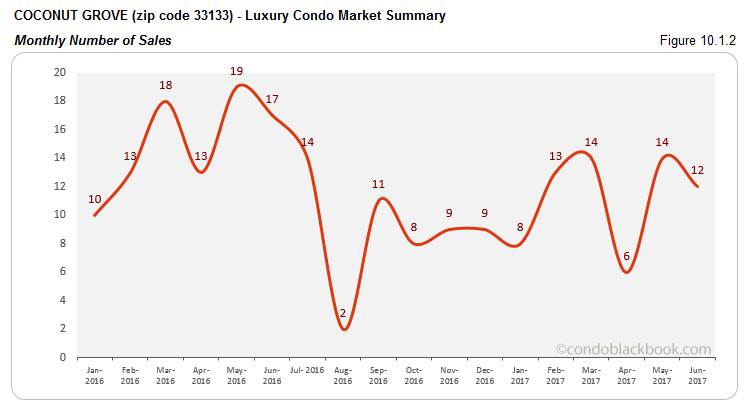
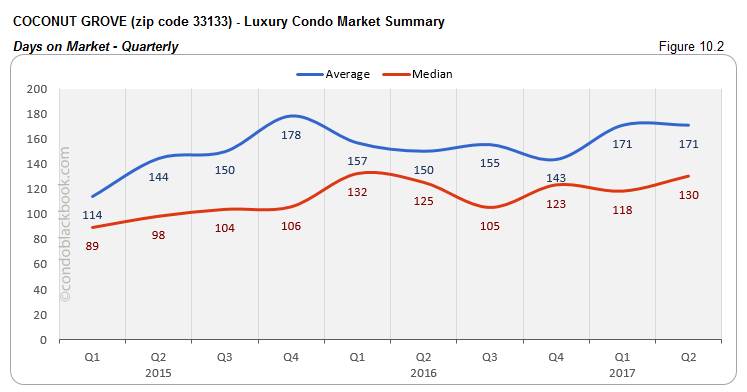
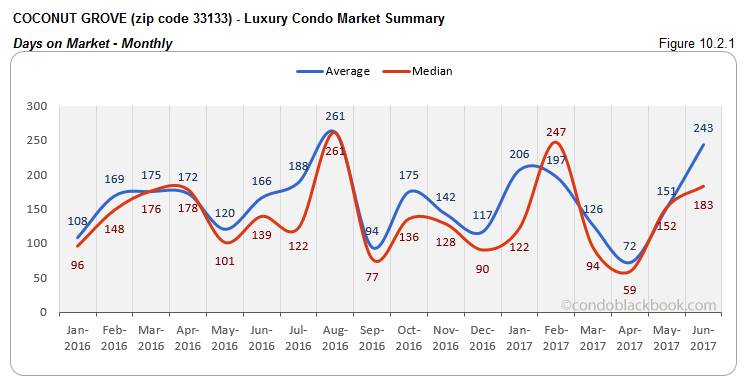
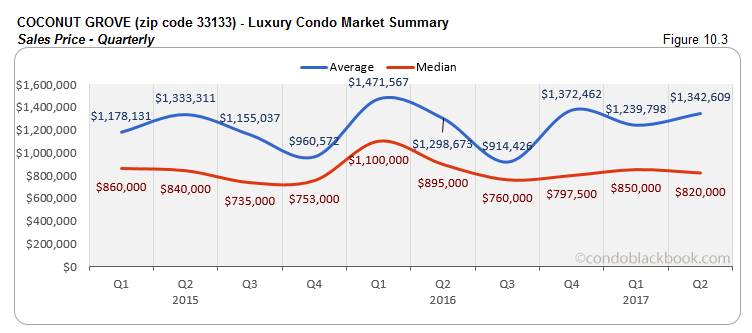
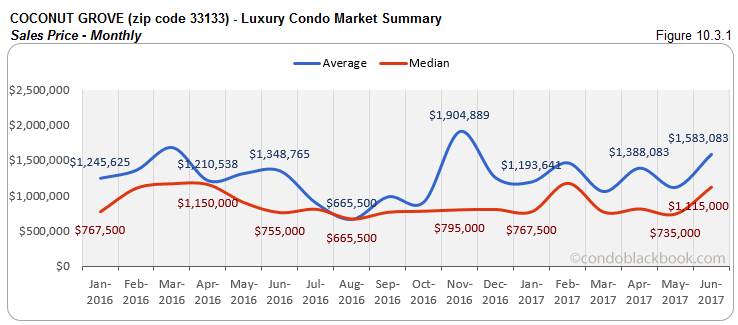
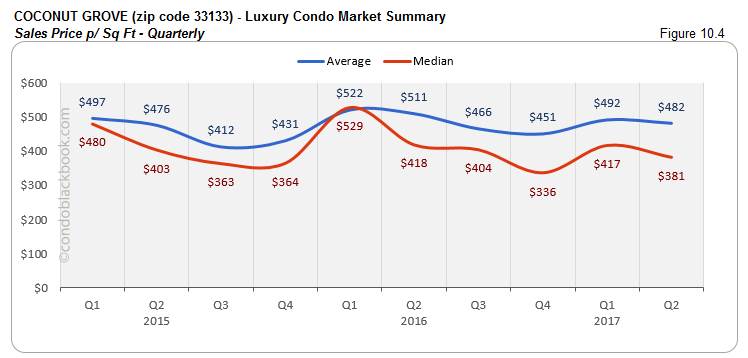
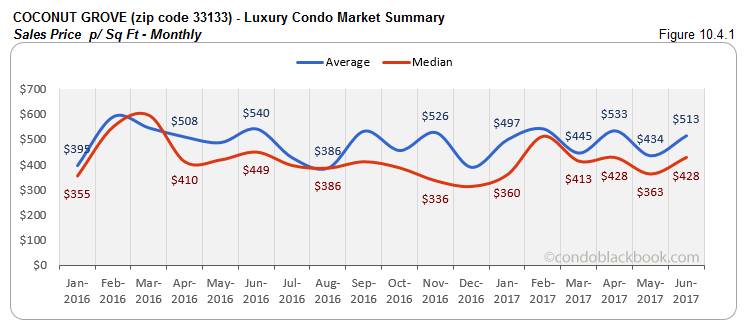
Coconut Grove Luxury Condo Market Summary (33133 zip) back to top
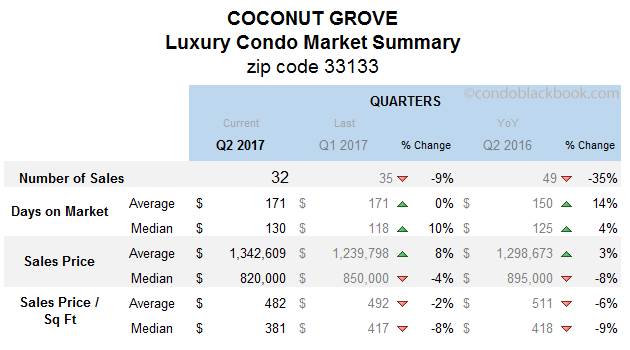
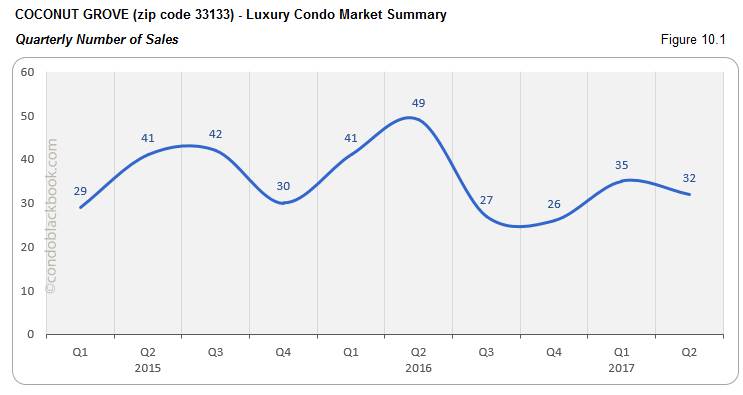
- Quarterly days on market increase, as sales slowdown, but prices decrease. The sales for Q2 may have fallen 9% (fig. 10.1) in Coconut Grove, but this should still be considered a positive as the luxury condo market here is quite modest. The sales momentum fell a bit short in the vibrant neighborhood, with median days on market increasing 10% (fig. 10.2). The notable news is that the median sales price (fig. 10.3) and price/sq. ft. (fig. 10.4) dropped 4% and 8%, respectively, creating some motivation for buyers.
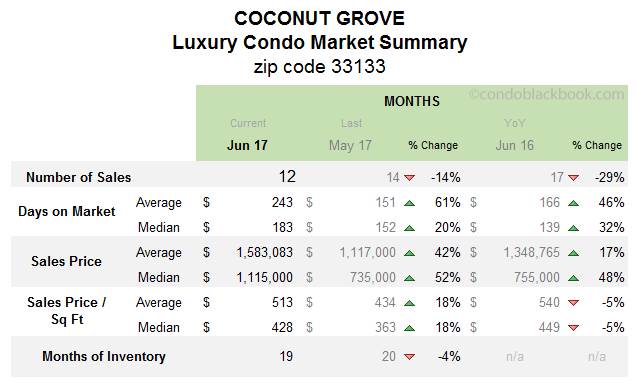
- Monthly sales sluggish with higher days on market and prices. June sales drop 14% (fig. 10.1.1), and the days on market increased 20% (fig. 10.2.1). The median price (fig. 10.3.1) and median price/sq. ft. (fig. 10.4.1) increased 52% and 18%, respectively.
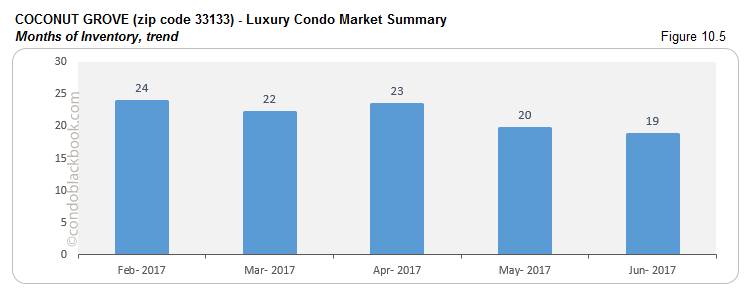
- Marginal drop in inventory still favors buyers. For June, Coconut Grove had 177 active listings, plus another 23 pending. As inventory moves at an average (last 6 months) of 11 deals a month, Coconut Grove has 19 months of inventory left on the market (fig. 10.5). While inventory in this historic neighborhood is nearing the 9-12 months of a balanced market, buyers still have time to take advantage of the buyer-friendly environment by searching Coconut Grove condos for sale here. Or, simply begin by exploring the lifestyle options in Coconut Grove.
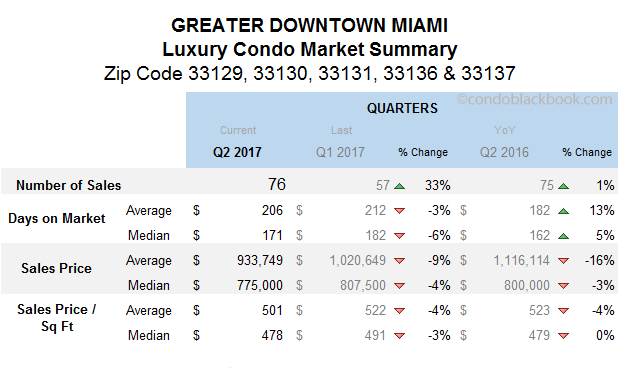
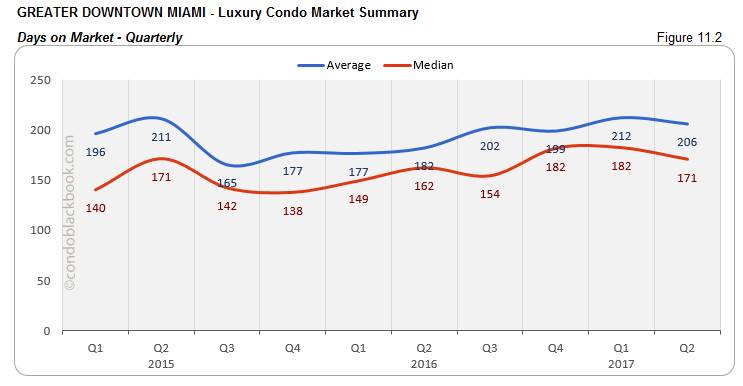
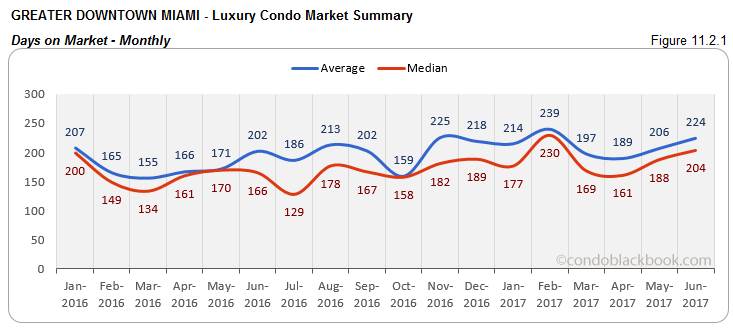
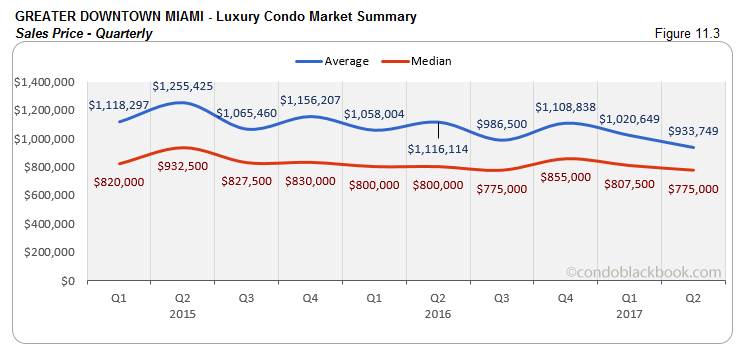
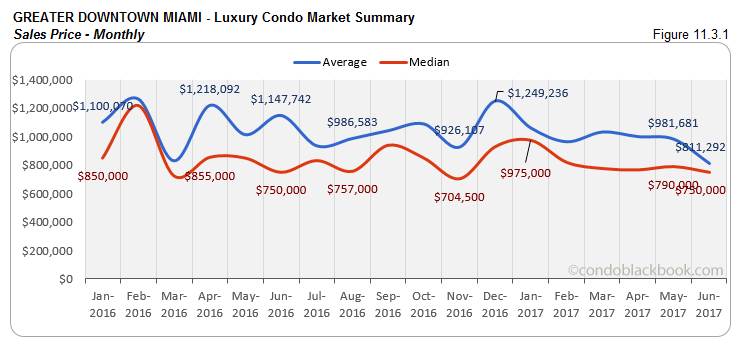
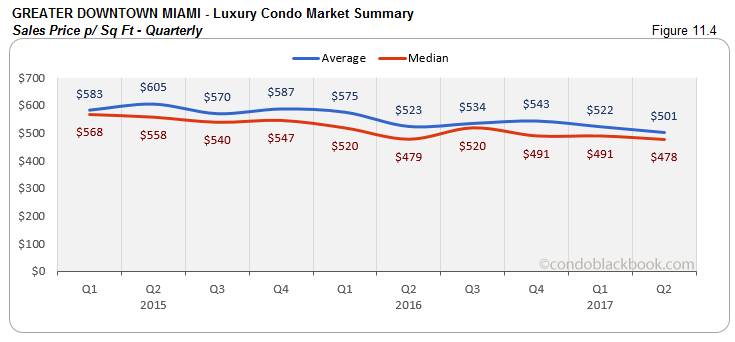
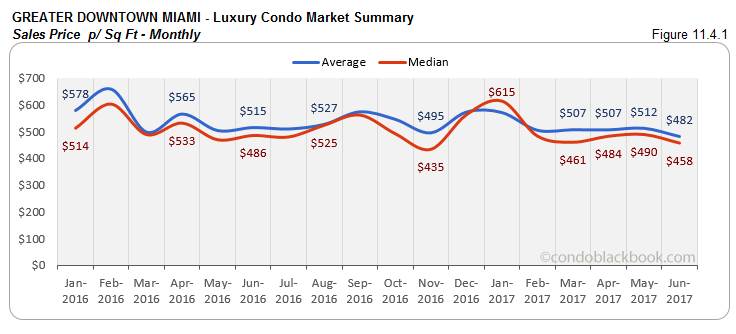
Greater Downtown Miami Luxury Condo Market Summary (33129, 33130, 33131, 33136, 33137 zips) back to top
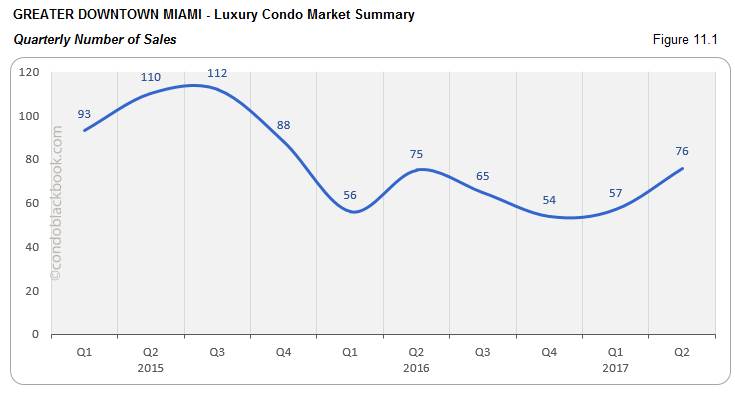
- Quarterly sales leap with lower prices to pull down days on market. The Greater Downtown area has posted a great second quarter, with sales going up 33% (fig. 11.1). The median price (fig. 11.3) and median price/sq. ft. (fig. 11.4) fell 4% and 3%, respectively, to favor buyers. Both these factors combine to bring down days on market by 6% (fig. 11.2).
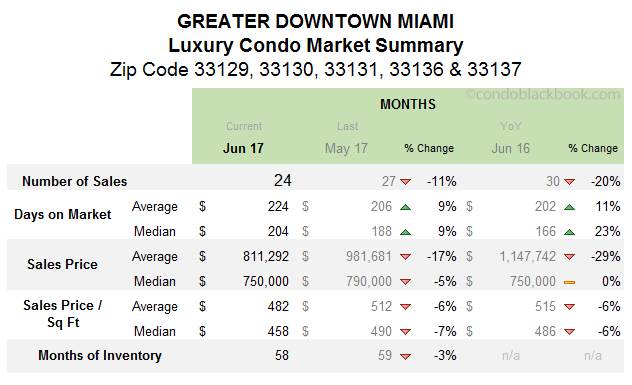
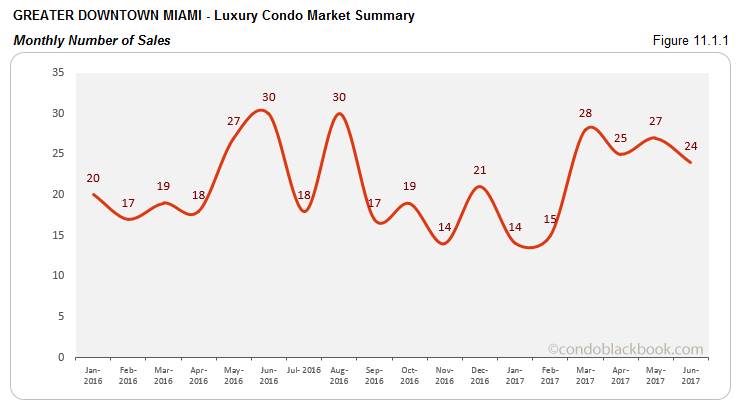
- Monthly days on market up, but sales and prices lower. June’s sales marginally fell (fig. 11.1.1) in Greater Downtown; however, it’s too early to write off these numbers as negative. The median days on market again climbed 9% (fig. 11.2.1). But, the median sales price (fig. 11.3.1) and median price/sq. ft. (fig. 11.4.1) have come down 5% and 7%, respectively to lure in buyers.
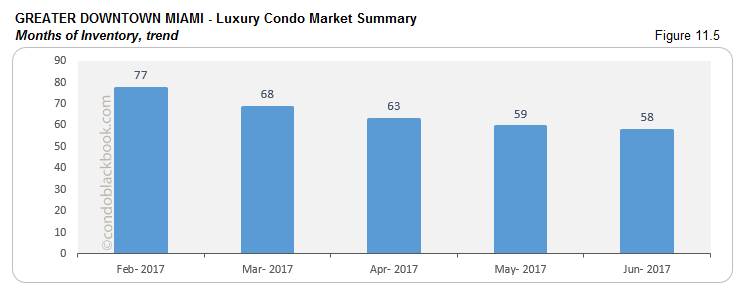
- Months of inventory gradually descend, but buyers retain advantage. June had 1182 active luxury condos listed on the market, with 33 pending. Considering inventory moves at an average (last 6 months) of 21 deals a month, the area still has 58 months of inventory on the market (fig. 11.5). Though there is a drop of 3%, the numbers are way off the 9-12 months of a balanced market. Since heavy surplus makes the market buyer-friendly, seekers should make use of the opportunity by looking at their options in the Greater Downtown Miami area here.
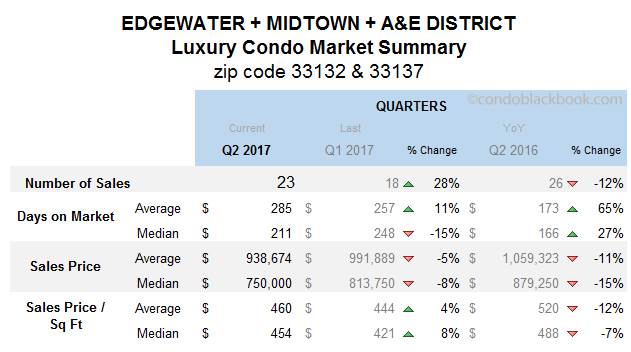
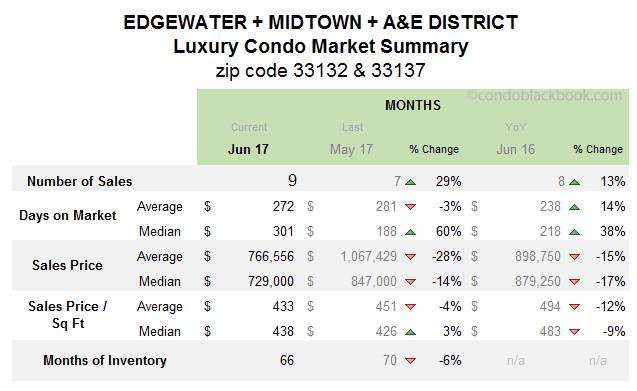
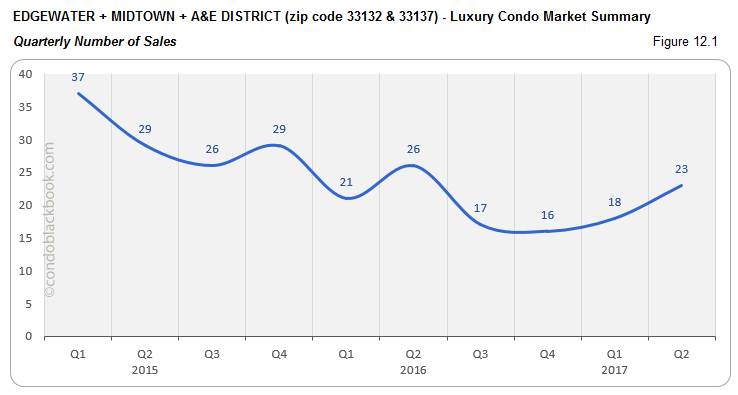
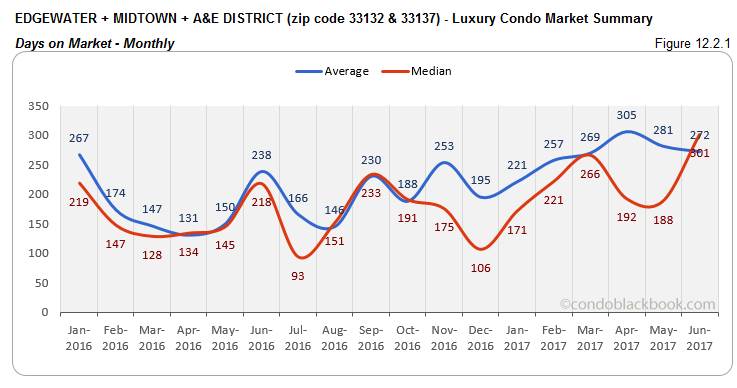
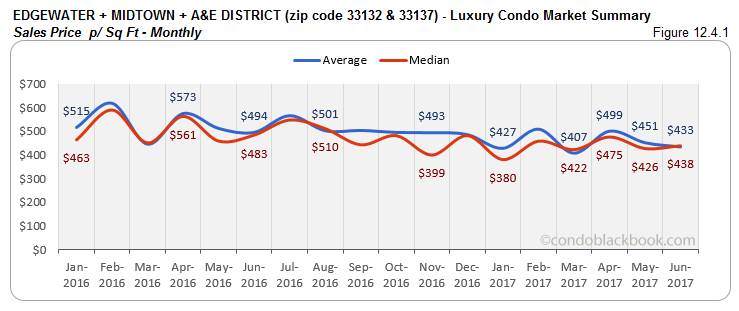
Edgewater + Midtown + A&E District Luxury Condo Market Summary (33132 + 33137 zip) back to top
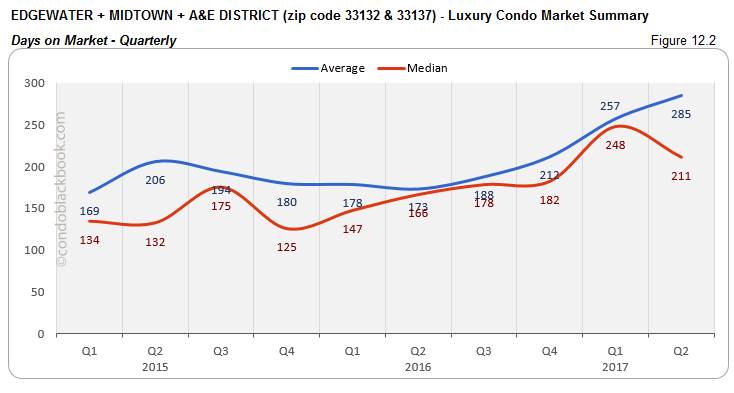
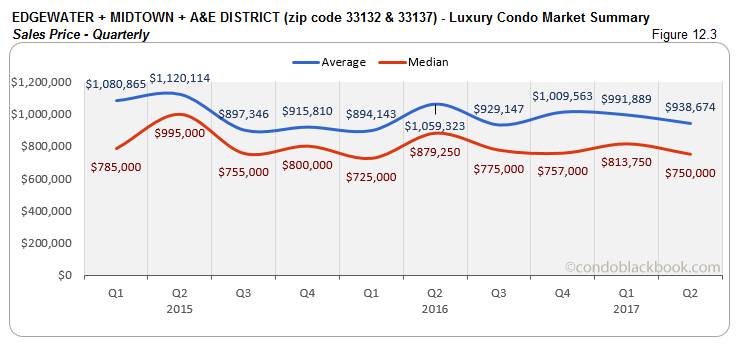
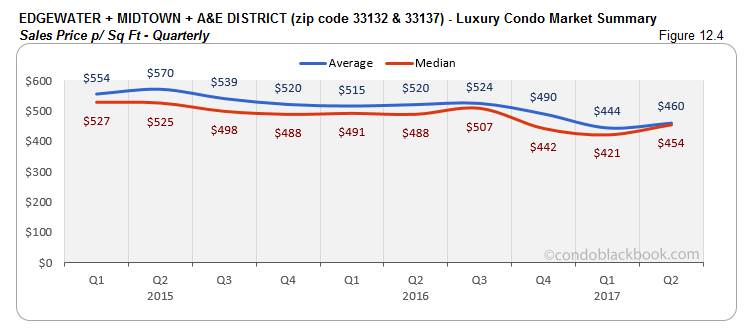
- Quarterly sales post improvement with lower days on market and sales price, but higher price/sq. ft. Sales have kicked up 28% (fig. 12.1) for this grouping in the second quarter. On the other hand, median sales prices decline 8% (fig. 12.3). This helped bring down the median days on market by 15% (fig. 12.2). However, the median price/sq. ft. (fig. 12.4) went up 8%.
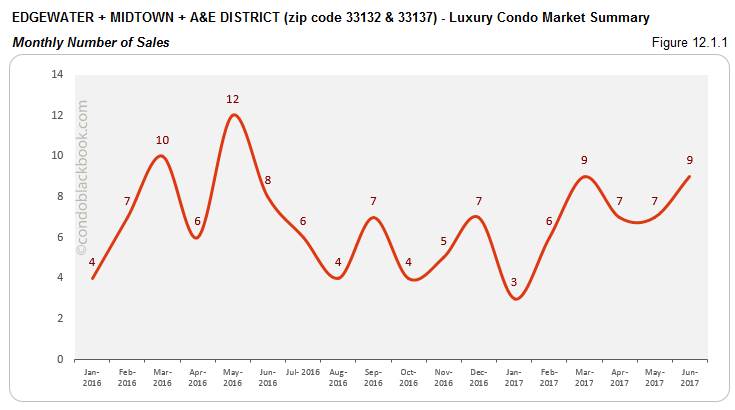
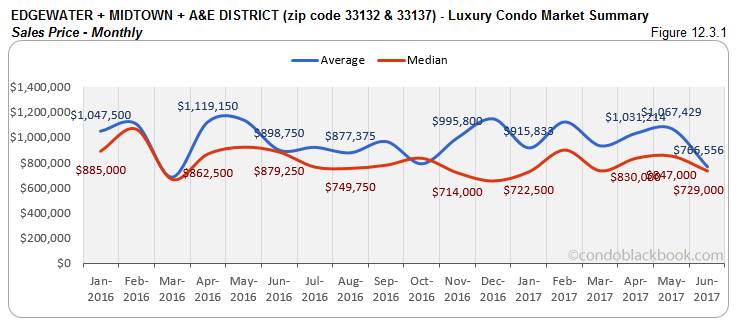
- Monthly sales increase, though other numbers not reflective of market trends. This grouping posted an increase of 29% in sales (fig. 12.1.1) this June. However, the median days on market are still very high, posting an upswing of 60% (fig. 12.2.1). Also, while the median sales price (fig. 12.3.1) dropped 14%., the median price/sq. ft. still went up 3% (fig. 12.4.1).
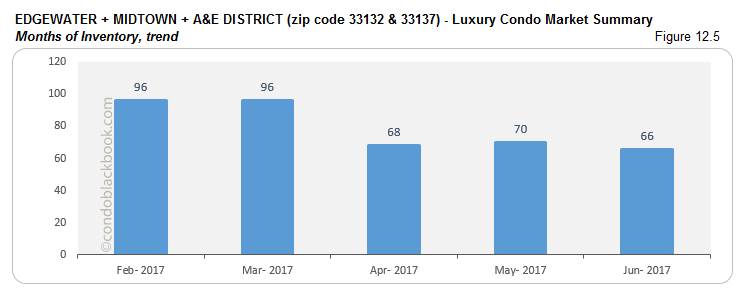
- Months of inventory drop, but buyers retain edge. June posted 428 active listings and 8 pending listings for this grouping. Considering inventory clears off at an average (last 6 months) pace of 7 deals a month, there is still 66 months of inventory waiting to get off the market (fig. 11.5). This is much higher than the 9-12 months of a normal market. Buyers can clearly take advantage of this surplus and drive negotiations. Check out the individual lifestyle and condo options in Edgewater, Midtown and Arts & Entertainment District, or search Edgewater condos for sale here.
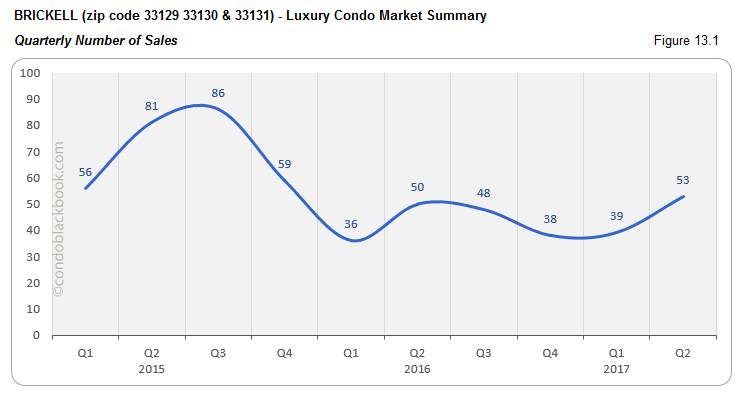
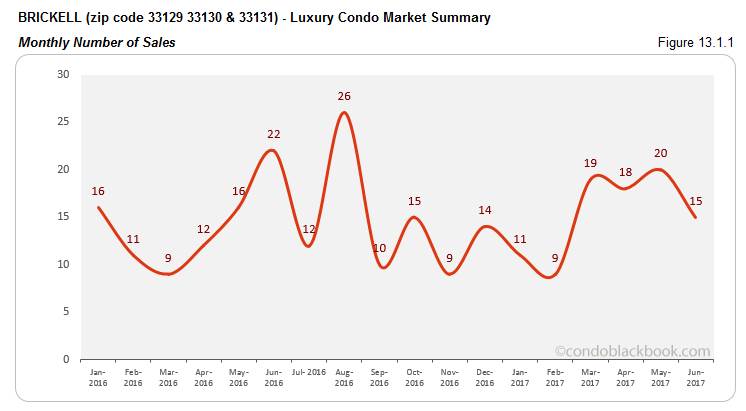
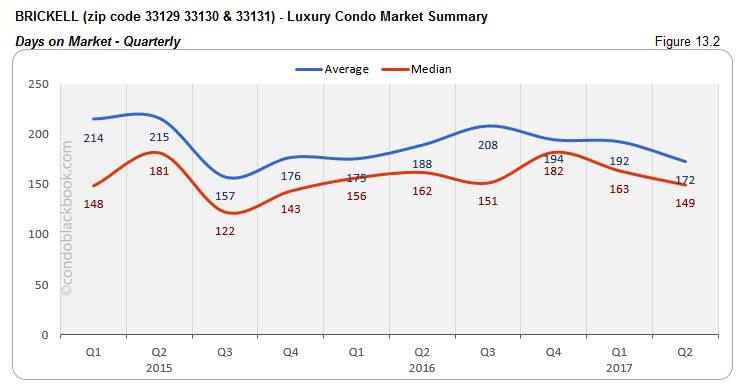
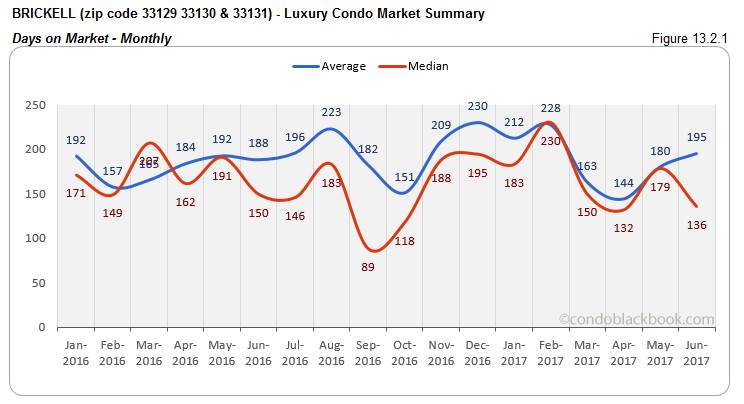
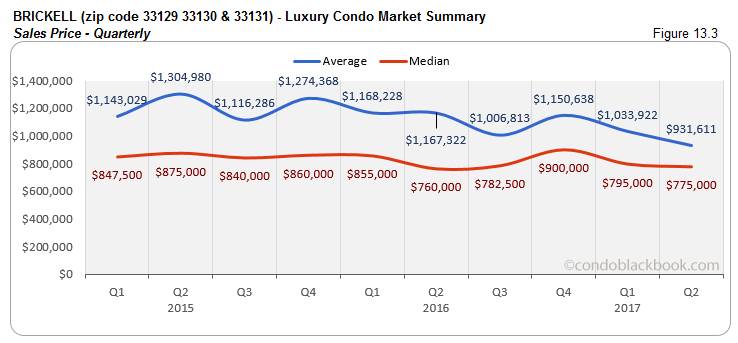
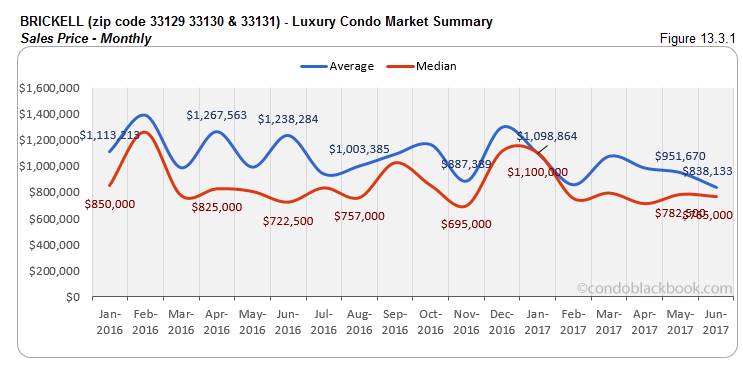
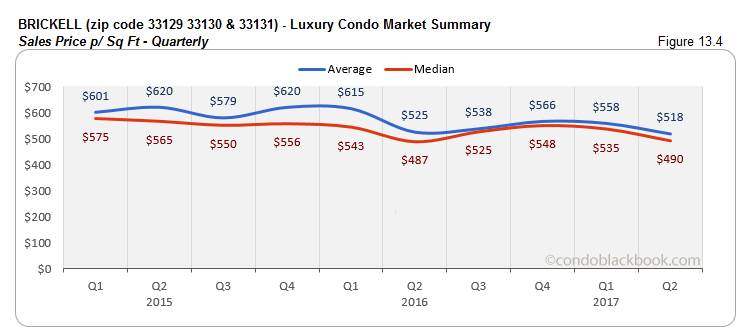
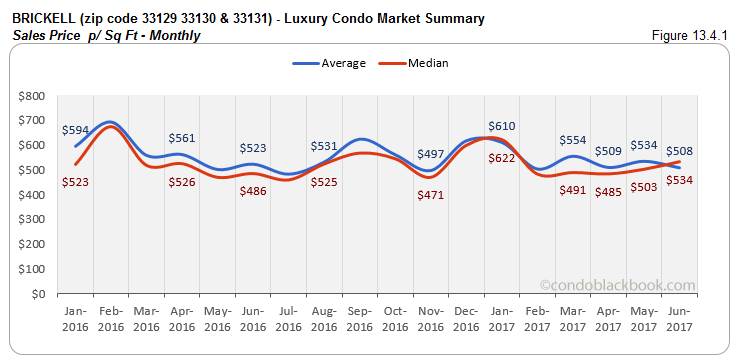
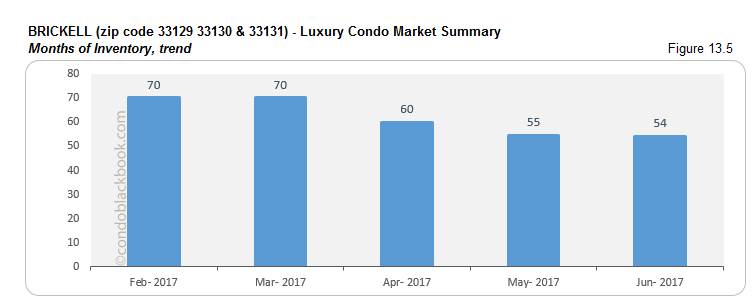
Brickell Luxury Condo Market Summary (33129, 33130, 33131 zip) back to top
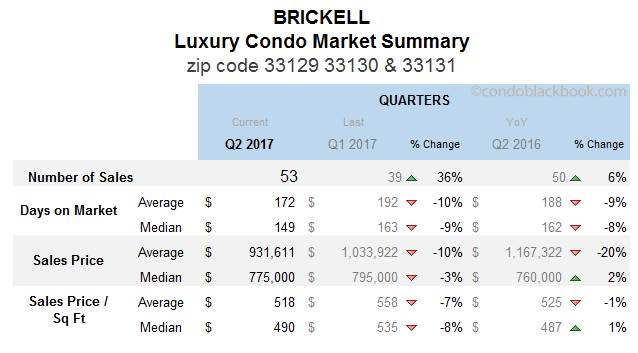
- Quarterly sales shine with lower prices and days on market. Brickell made quite the progress with a 36% hike in sales (fig. 13.1) this second quarter. Both, median sales price (fig. 13.3) and median price/sq. ft. (fig. 13.4) posted a 3% and 8% drop, respectively. This pushed down the median days on market (fig. 13.2) by 9% quarter-over-quarter and 8% year-over-year.
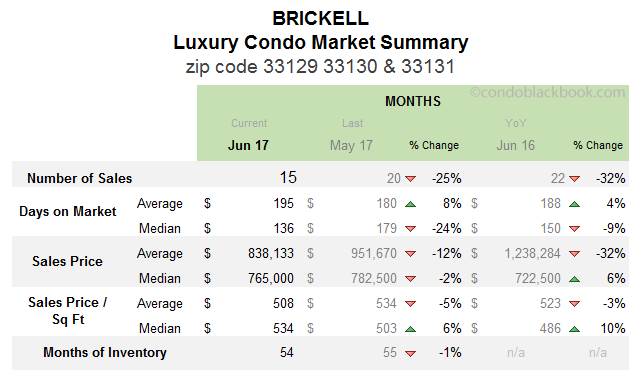
- Monthly sales slower, but days on market decline with decreasing sales price. June witnessed a decrease of 2% in the median sales price (fig. 13.3.1). This, with the progress made in previous months, reduced the median days on market by 24% (fig. 13.2.1). However, the June registered 25% lower sales than May (fig. 13.1.1).
- Months of inventory marginally down, buyers can still play. Brickell had 753 active luxury condo listings in June, with another 25 pending. Considering inventory moves at an average (last 6 months) of 14 deals a month, the financial district still has 54 months of inventory to get off the market (fig. 13.5). This is again much higher than the 9-12 months of a balanced market. This means buyers have plenty of room to drive negotiations and play. Click to dabble through Brickell’s lifestyle options or search Brickell condos for sale here.
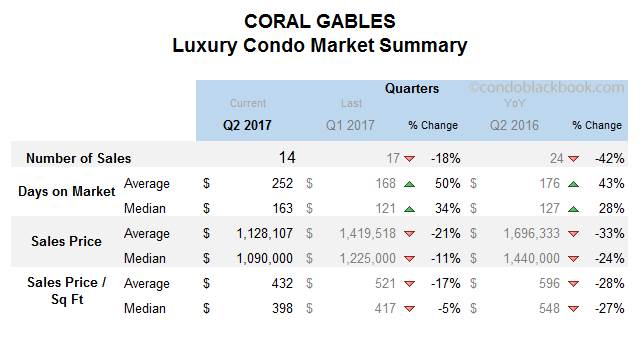
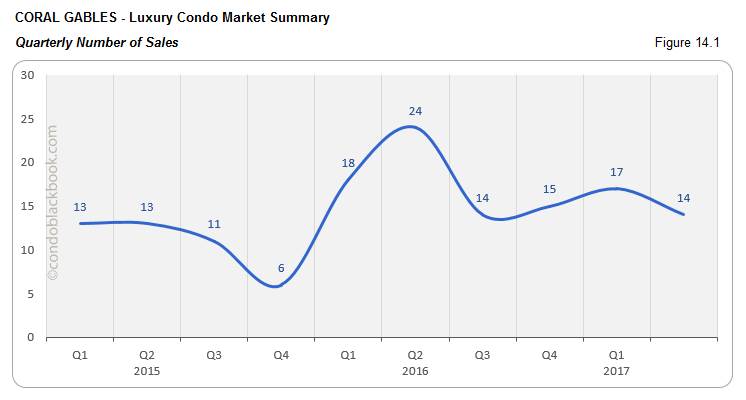
Coral Gables Luxury Condo Market Summary back to top
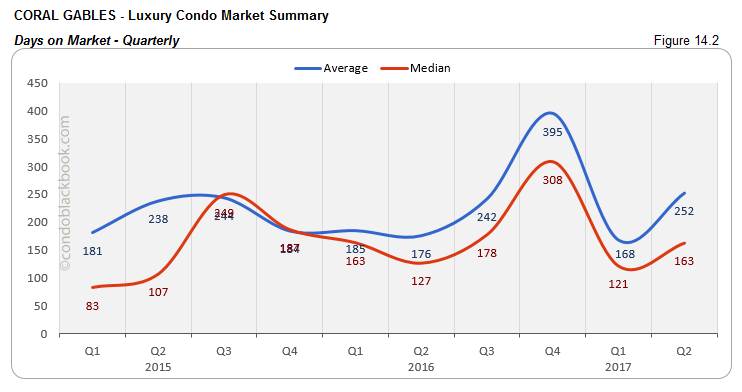
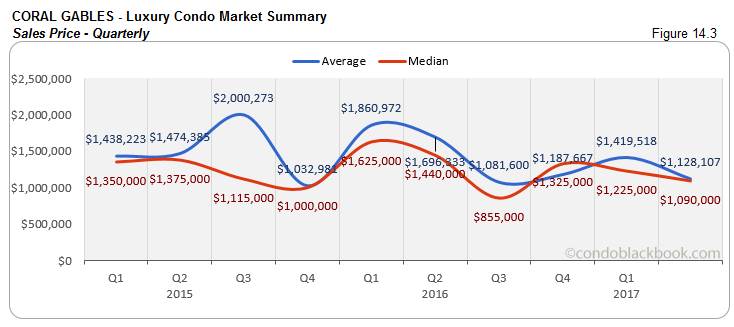
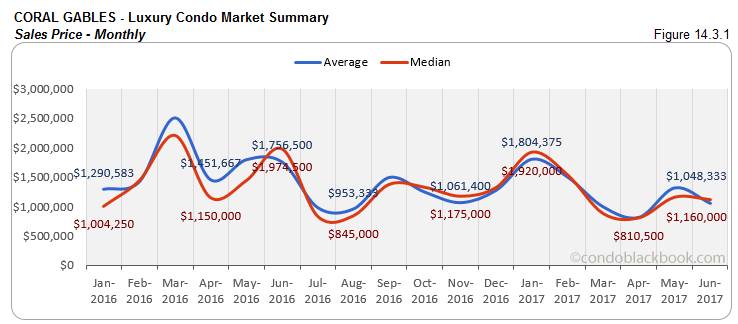
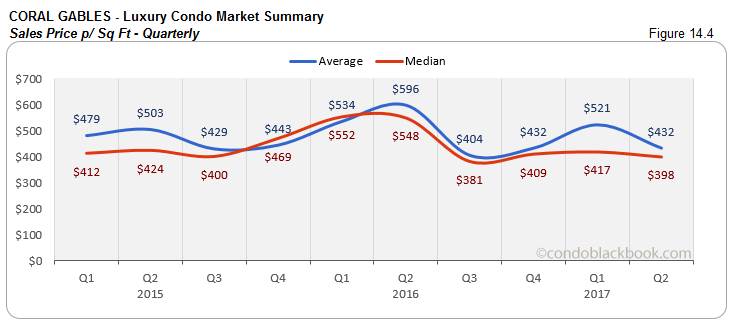
- Quarterly prices lower, other numbers not reflective of market. Coral Gables is rather quiet on the luxury condo front, which is why numbers are usually not indicative of the overall market. The sales numbers for Q2 fell 18% from Q1 (fig. 14.1), making the median days on market go up 34% (fig. 14.2). The good news for buyers here is that both the median sales price (fig. 14.3) and median price/sq. ft. (fig. 14.4) reduced 11% and 5%, respectively.
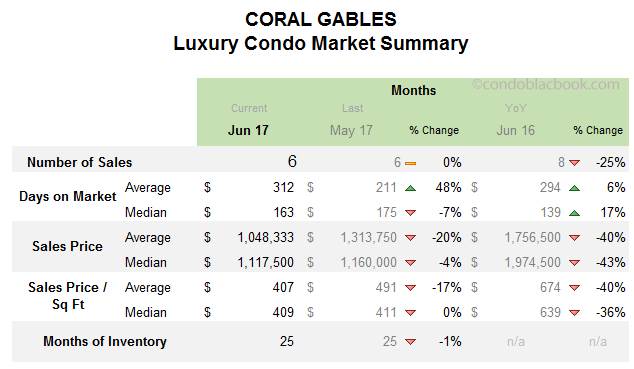
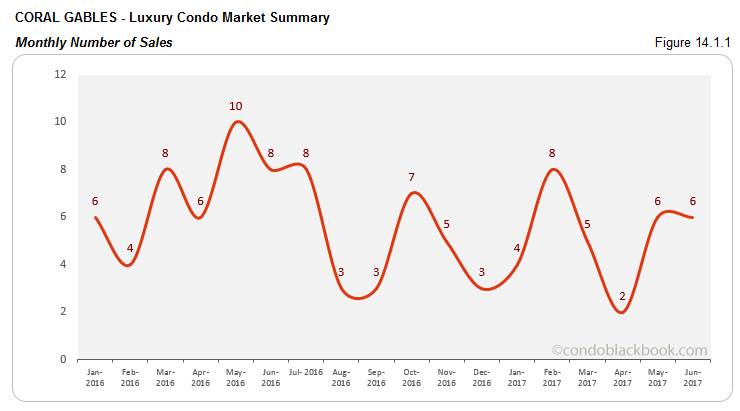
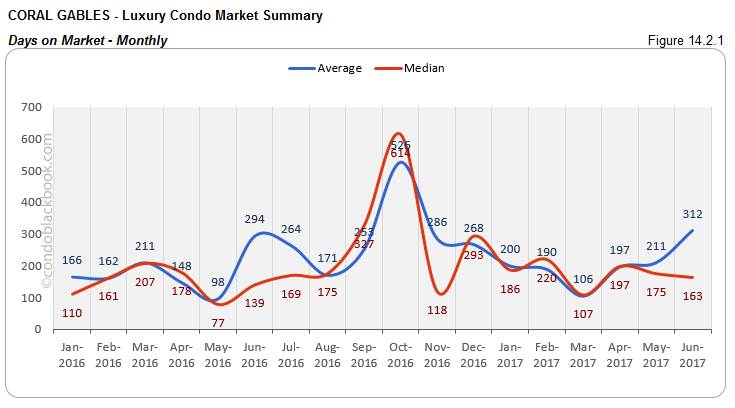
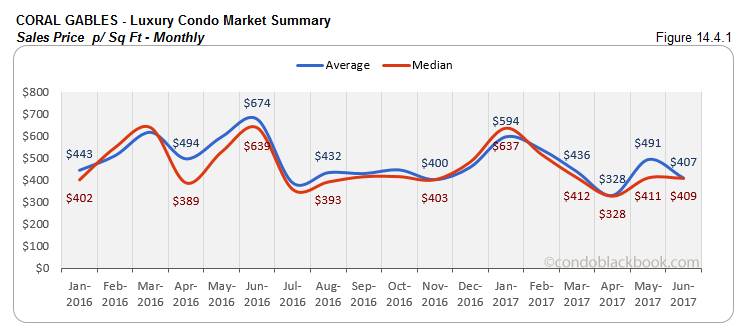
- Monthly sales flat, with days on market and prices lower. June’s sales chart stays flat by repeating May’s performance (fig. 14.1.1). The median sales price (fig. 14.3.1) went down 4%, while median price/sq. ft. (fig. 14.4.1) stayed flat. Both these factors helped the days on market recover by pushing it down 7% (fig. 14.2.1).
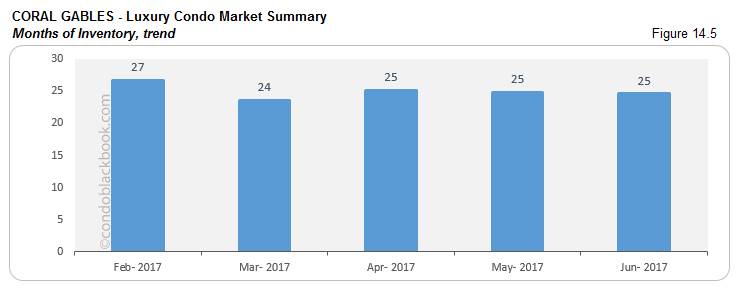
- Months of inventory decrease marginally, buyers still gain favor. June posted 109 active luxury condo listings, with another 11 pending. Taking an average (last 6 months) of 5 deals a month, there is still 25 months’ worth of inventory on the market. This is still higher than the 9-12 months of a normal market, giving buyers an edge in negotiations. Click to see what Coral Gables has to offer in lifestyle, or search Coral Gables condos for sale here.
Conclusion back to top
Market still leans in favor of buyers. The market is chipping away at heading toward a balanced market, but we are many months away from that occurring. So sellers will need to stay realistic about pricing, while buyers can continue to snag good deals.
Love what you see? Don’t forget to share our blog and subscribe (see the subscribe call-out to the right) to receive the latest market news in your inbox.
Have any questions? Or see something wrong with the stats? Please contact Sep at sniakan (at) hbroswell.com or call 305-725-0566.
Share your thoughts with us

Your Miami Condo Awaits
Recent Posts


 (305) 697-7667
 (786) 321-7233
  contact@condoblackbook.com

