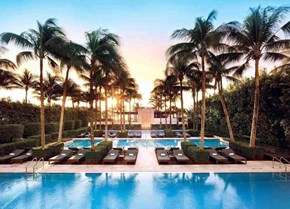
Coral Gables and Coconut Grove Luxury Condo Market Report Q4 2020

Feb 19, 2021 February 19, 2021
CondoBlackbook.com's Q4 2020 Luxury Condo Market Report for Coral Gables and Coconut Grove delivers the much-awaited signs of a market correction, and then some. With a record-breaking Q4 for Miami overall, this popular Miami neighborhood grouping claims top spot with the highest percentage growth in yearly sales in all of Miami. Owing to this remarkable momentum, the months of inventory dropped to an all-time low and the 12-month sales trendline posts a positive curve - all pointing to the likelihood of a strong opening to Q1 2021.
For a more in-depth analysis of Q4 and annual trends in 2020, read our exclusive report on the collective neighborhoods of Coral Gables and Coconut Grove below, along with a detailed comparison of sales, prices, days on market and inventory to the overall Miami market:
For the purpose of this Miami submarket luxury condo report, we've only featured condo properties priced $1 million and above.
Annual (2020) - Coral Gables and Coconut Grove Luxury Condo Market Highlights:
- Leads annual sales growth in Miami overall with 22.5% increase in year-over-year sales
- Highest total sales in a year since 2015
- Annual Price per Square Foot flat at $552/sq. ft. - lowest entry point for buyers into Miami's luxury condo market
- Annual Days on Market 24.4% higher in 2020-over-2019 analysis
- Lowest year-end inventory of all Miami neighborhoods (15 months)
- One of first few segments in Miami poised to correct from a buyer's market to balanced position in 2021
Q4 2020 - Coral Gables and Coconut Grove Luxury Condo Market Highlights:
- Q4 2020 sales jump 71.4% year-over-year, set new record in 6 years
- 12-month trendline shifts from negative in Q2 and Q3 to positive in Q4 2020, indicating prospects for growth
- Price per Square Foot up 34.3% year-over-year to $613/sq. ft.
- Sales Price up 10.1% year-over-year
- Days on Market up year-over-year, but down quarter-over-quarter
Table of Contents
- Q4 2020 Coral Gables & Coconut Grove Luxury Condo Sales Trends
- Q4 2020 Coral Gables & Coconut Grove Luxury Condo Price Trends
- Q4 2020 Coral Gables & Coconut Grove Luxury Condo Days on Market Trends
- Q4 2020 Coral Gables & Coconut Grove Luxury Condo Inventory Trends
- Q4 2020 Conclusion
Leads Annual Sales Growth in Miami Overall
Q4 2020 Coral Gables and Coconut Grove Luxury Condo Market Summary - Fig. 1
Quarters | Number of Sales | % change in Sales | Median Sale Price | % change in Median Sale Price | Median Sp/Sqft | % change in Median Sp/Sqft | Median of DOM |
Q4-2020 | 36 | 71.4% | $1,337,500 | 10.1% | $613 | 34.3% | 118 |
Q4-2019 | 21 | $1,215,000 | $456 | 110 |
2020-over-2019 Coral Gables and Coconut Grove Luxury Condo Market Summary - Fig. 1.1
Year | Number of Sales | % change in Sales | Median Sale Price | % change in Median Sale Price | Median Sp/Sqft | % change in Median Sp/Sqft | Median of DOM |
2020 | 109 | 22.5% | $1,320,000 | -7.4% | $552 | 0.3% | 112 |
2019 | 89 | $1,425,000 | $551 | 90 |
Annual Sales up 22.5% compared to 2019, also highest since 2015 with positive trendline
Posting a huge recovery from the pandemic-related slowdown mid-year (read the Q2 2020 report here), this combined neighborhood reports a 22.5% jump in annual sales compared to 2019 (Fig. 1.1). This uptick is in contrast to the trend of lower annual sales seen in the overall Miami market.
Leading the sales growth narrative of 2020, Coral Gables and Coconut Grove (combined) posts the strongest bounce back of all Miami neighborhoods in our study. The grouping also reports the highest total sales in a year seen since 2015 (Fig. 2.1).
The phenomenal recovery by the luxury condo market here is further captured in the 12-month sales trendline below (Fig. 2.3) that corrects from a negative angle in Q2 and Q3 to a positive in Q4 2020.
Backed by exceptional sales in Q3 and Q4 2020 plus a positive trendline year-end, we expect this pair of Miami's most beautiful neighborhoods to open 2021 on a strong note.
Q4 2020 sales skyrocket to set new record in 6 years
With a record-breaking 36 closed transactions, Q4 2020 reported the highest quarterly sales in over six years. Posting a 71.4% jump in year-over-year sales and a 38.5% increase in quarter-over-quarter numbers, this dynamic sub-market made a remarkable recovery from the pandemic-caused slack in Q2, and then some.
A closer look at the monthly sales chart of Fig. 2.2 details how an exceptional December (16 sales) was the strongest contributor to this year-end boost.
Coral Gables & Coconut Grove Luxury Condo Quarterly Sales 2015 - 2020 - Fig. 2.1
Coral Gables & Coconut Grove Luxury Condo Monthly Sales from Jan. 2016 to Sep. 2020 - Fig. 2.2
Coral Gables & Coconut Grove Luxury Condo 12-Month Sales with Trendline - Fig. 2.3
Luxury Condo Price per Square Flat Annually, Up YoY for Q4 2020
Annual Price per Square Foot flat at $552, Median Price down 7.4% year-over-year
Partly in line with the overall Miami trend of flat annual prices, only the Price per Square Foot stays put over 2020 in this combined neighborhood of Coral Gables and Coconut Grove. The Price per Square Foot barely shifts from $551 in 2019 to $552 in 2020.
On the other hand, the Median Price declines 7.4%, down to $1,320,000 in 2020 from $1,425,000 in 2019. (see Fig. 1.1 above)
Q4 2020 Price per Square Foot up 34.3% to $613, Median Price also up 10.1% year-over-year
In sharp contrast to the overall Miami trend of lower year-over-year prices, both the quarterly Price per Square Foot and Median Sales Price reported an increase in this grouping (Fig. 1). The Price per Square Foot increased 34.3%, up from $456 in Q4 2019 to $613 same quarter 2020. The Median Price too improved 10.1% in value from $1,215,000 in Q4 the previous year to $1,337,500 in Q4 2020.
These trends combined show that sellers continued to receive good value for their luxury condos as the market recovered from the full impact of the pandemic.
Coral Gables & Coconut Grove Luxury Condo Quarterly Price per Sq. Ft. 2016-2020 - Fig. 3
Annual Days on Market Up YoY
Annual Days on Market up by 24.4%
Going against the overall Miami market trend of lower Days on Market, luxury condos in Coral Gables and Coconut Grove took 22 more days to be sold (on a median basis) compared to 2019 (Fig. 1.1). This indicates that buyers and sellers took a while to come to a consensus in their dealings over the course of the year.
Q4 2020 Days on Market up 7.3% year-over-year
Again, deviating from the overall Miami market trend of lower Days on Market, luxury condos spent 8 more days on the market in this grouping compared to Q4 2019 (Fig. 1). However, on a quarter-over-quarter basis, luxury condos spent 11 fewer days on market in Q4 compared to Q3 2020 (Fig. 4).
Coral Gables & Coconut Grove Luxury Condo Quarterly Days on Market 2018-2020 – Fig. 4
Inventory Down to All-Time Low, Lowest in Miami
Q4 closes with all-time low of 15 months of Inventory
Continuing its winning streak from Q1 2020, the combined neighborhood of Coral Gables and Coconut Grove again has the lowest months of inventory in all of Miami. Closing the year at 15 months, this is the lowest inventory has been for the combined neighborhoods in over a year, showing exceptional progress.
It's also worth noting that the grouping reports a 21% decline quarter-over-quarter (19 to 15 months) and 44.4% decrease year-over-year (from 27 to 15 months) - much like the overall Miami trend.
Historically, this dynamic grouping has always been poised to become one of the first neighborhoods to transition from a buyer's market to a balanced one. With sales growing at an extraordinary rate over the last two quarters of the year, inventory in the Coral Gables and Coconut Grove sub-market is closer than ever to reaching the ideal 9-12-month benchmark. This is why buyers should take note to hurry, since they have a limited time only to enjoy the benefits of a favorable market as they search for Coral Gables or Coconut Grove condos for sale here.
Coral Gables & Coconut Grove Luxury Condo Months of Inventory from Mar. 2019 to Dec. 2020 - Fig. 5
A balanced market has only 9-12 months of inventory. The months of inventory are calculated as – no. of active listings + no. of pending listings divided by the average number of deals in the last 6 months.
Conclusion: Q4 2020 Coral Gables & Coconut Grove
Taking third-quarter momentum forward, it is exciting to see sales go off the charts in this collective neighborhood. On an annual basis, this suburban grouping turns out to be the biggest contributor to the (almost full) recovery we see in the overall Miami luxury condo market report for 2020. With the highest total sales in a year since 2015, the Coral Gables and Coconut Grove sub-market outperforms all other neighborhoods in our Miami report.
In Q4 2020, the grouping sets a brand-new record for quarterly sales in over 6 years – again strengthening the overall Miami trend of higher year-over-year sales. This exceptional peak also helps correct the negative-angled 12-month sales trendline from Q2 and Q3 to an impressive positive by year-end. Ending an unpredictable year on an exceptionally strong note, as real estate experts, we expect this combined neighborhood to repeat its power-packed performance in Q1 2021, or at least part of it.
In terms of the annual price analysis, the Price per Square Foot remains stable year-over-year like the overall Miami market. At $552/square foot, it still gave buyers the lowest entry point into Miami's luxury condo market.
In Q4 2020, however, the combined neighborhood breaks the overall trend of lower year-over-year prices and posts an improvement. Closing the year with a higher Price per Square Foot compared to the previous year, sellers could expect to receive better value for their luxury condos in 2021.
Both the annual as well as Q4 2020 Days on Market increase in Coral Gables and Coconut Grove, which goes against the overall Miami trend of declining numbers. This indicates that buyer-seller communication was weaker in terms of closings over the course of the year.
In terms of inventory, Coral Gables and Coconut Grove (combined) continued posting the lowest months of inventory of all Miami neighborhoods from Q1 through to Q4. As the most dynamic neighborhood of all those under our study, this grouping is poised to be one of the first to transition from a buyer's market to a balanced one in 2021. With an even shorter window of opportunity, buyers have a limited time to find the best deals in these desirable neighborhoods.
We further expect the following factors to add to the strong year-end momentum seen in this Miami district (as well as the others) going into 2021:
- Companies and individuals following big businesses and top executives moving (or planning to move) to Miami for its zero personal income tax and other tax benefits
- A continued 'Avalanche' of new residents from high-tax states of the North and Northeast such as New York and California
- People looking to migrate to a home on the beach or to enjoy a warmer climate, now getting the inspiration to follow their heart with relaxed work from home norms
- Buyers on the fence due to the uncertainty of the elections, now getting the motivation to jump into deals
Also, with fewer new luxury condo deliveries scheduled for 2021 and inventory decreasing at a higher rate, this will be the market to watch in 2021, as it eases from a long-standing, buyer-friendly position to a balanced situation.
Love what you see? Don't forget to share our blog and subscribe (see the subscribe link on the top menu) to receive the latest Miami condo market news in your inbox.
Questions or comments about the stats? Want more info on Miami condos? Contact Sep at sniakan (at) hbroswell.com or call 305-725-0566.
Cover photo by Lukas from Pexels
Share your thoughts with us
Your Miami Condo Awaits
Recent Posts
