Luxury Miami Condo Report : July 2017

Aug 22, 2017 August 22, 2017
Miami Luxury Condo Market Report: Summary
City and Neighborhood Luxury Condo Reports
Miami Beach Luxury Condo Report
South Beach Luxury Condo Report
Bal Harbour Luxury Condo Report
Sunny Isles Beach Luxury Condo Report
Greater Downtown Miami Luxury Condo Report
Edgewater / Midtown / A&E District Luxury Condo Report
Coconut Grove Luxury Condo Report
Coral Gables Luxury Condo Report
Miami Luxury Condo Market Report: Summary back to top
These past couple of months the Miami luxury condo market’s been posting an uptick in sales activity, but July’s numbers backtrack a bit. Are we losing our positive streak? Or is this just a minor hiccup. Read on below for the full report.
Statistics related to condos priced $600,000 and above only have been used for the purpose of this report.
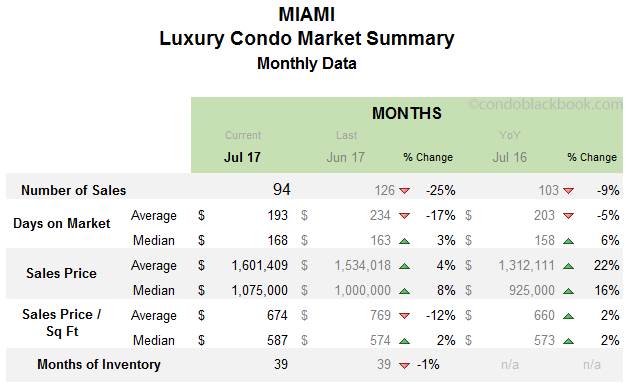
Overall Market Highlights:
- Overall monthly sales down 25%, still better than January’s low point of 77
- Miami Beach (-52%), South Beach (-57%) and Mid-Beach (-50%) take a break with biggest drop in sales
- Sunny Isles Beach and Surfside post best sales in market
- Overall median days on market retreat slowly, signal progress
- Median sales price up 8% and price/sq. ft. up 2%, oddly moving in favor of sellers in a buyers market.
- Months of inventory at 39, posts miniscule decline (FYI, inventory decline is healthy for market balance)
- Market still strongly in favor of buyers, can still dictate deals with motivated sellers
No stress over lower sales. Looking at July’s sales numbers, it’s quite tempting to say that we’ve hit a slowdown. However, that’s not necessarily the case (at least for now). Historically, the luxury condo market tends to slow down in the months of July and August.
These are the months that are the most hot and humid in Miami. Snow birds fly back to their hometowns to enjoy the summer, while many Miamians are out on vacation and not trading properties.
Also, we’ve had a great run with sales in the past couple of months and a breather is but natural.
Median days on market continue downward trek. Strong sales in the past few months have contributed to lower days on market this July. Even though July’s numbers didn’t quite match up, progress is visible in fig. 2.1 below.
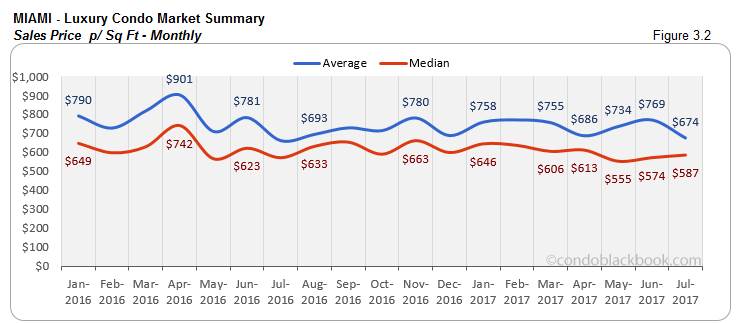
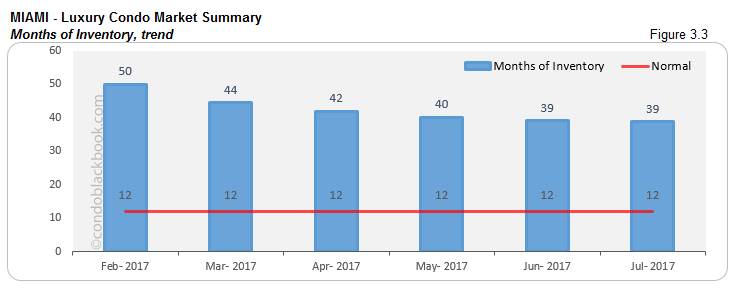
Inventory still high, yet prices move up surprisingly. Considering we’re sitting in a pretty hot buyer's market, sellers should be going easy on their pricing. But, we’ve been witnessing quite the opposite these past two months. Fig. 3.1 and 3.2 show how the median sales price and price per sq. ft. have actually gone up in June and July. In case this points to buyers and sellers finding a happy middle ground, then great! However, sellers should tread cautiously as the market is yet to recover. The inventory for July matches June, posting only a fraction of a decrease (fig. 3.3). Furthermore, 39 is a long way off from the 9-12 months of a normal market.
Overall, I’d say the market has made some progress, but it still needs to gain momentum. It’s a long road to a healthy market. Till then, buyers can afford to be picky and snap up a great deal on their first home, vacation condo or upgrade.
How Did We Land Into Pent Up Inventory And A Buyer-Driven Market, and Where Do We Go From Here?
We’ve already discussed in-depth how a strengthening U.S. dollar, strong stock market, the 2016 Zika scare, shaky start to the presidency and a desire for tax breaks by the wealthy have been holding back sales numbers in the luxury market. While Zika might be off the list, there are still plenty of factors behind Miami’s surplus of luxury condos. Until the market picks up enough pace to get rid of this backlog, buyers can enjoy their vantage position and dictate deals in the meantime.
Below is an insight into Miami’s overall and neighborhood-level luxury condo trends for July 2017:
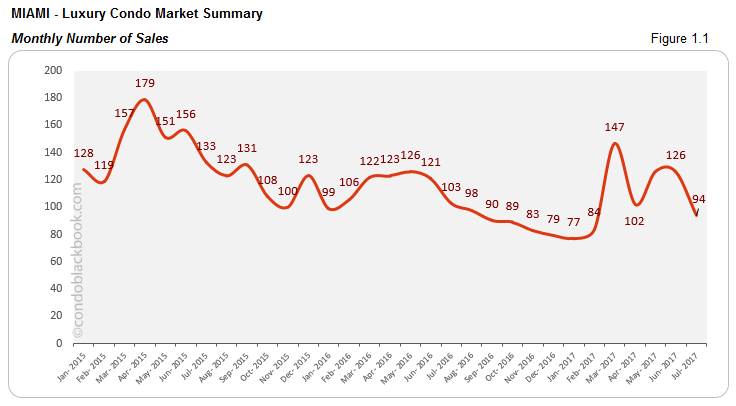
Monthly Number of Sales - Miami Luxury Condo Market Overall back to top
- Sales slacken, but still hold ground. Julys in Miami are historically a bit quiet. So, when this July posts only 94 sales overall, it doesn’t come as much of a surprise. Notice how the curve drops in fig. 1.1 at July 2016 and 2015. Plus, the previous months did see some pretty big leaps in sales. Both these factors combined, we have July sales lower by 25% compared to last month and by 9% compared to last year. So, even though the market has gained some momentum in the past couple of months, consistency holds the key to recovery.
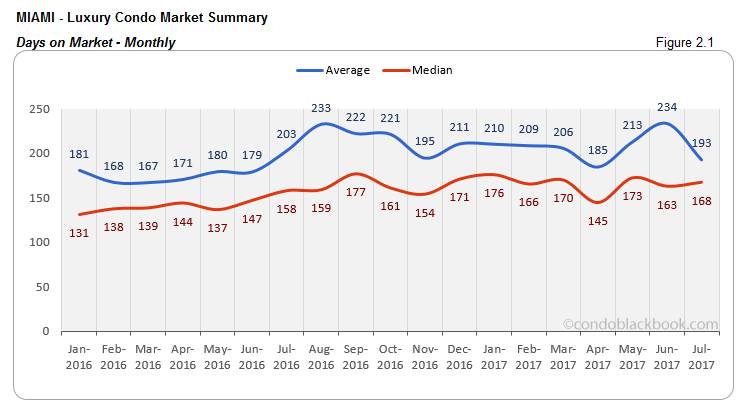
Days on Market - Miami Luxury Condo Market Overall back to top
“Days on market” are the total number of days from when a property is active to the day it goes under contract.
- Days on market recede, revealing signs of progress. Even though July went on by rather quietly, strong sales from previous months came to the rescue. Notice how both the average and median days on market have started their descent in fig. 2.1 below. The average days on market were 17% lower than June 2017 and 5% lower than July last year. However, it will still take a few more months of strong sales to keep the trend going.
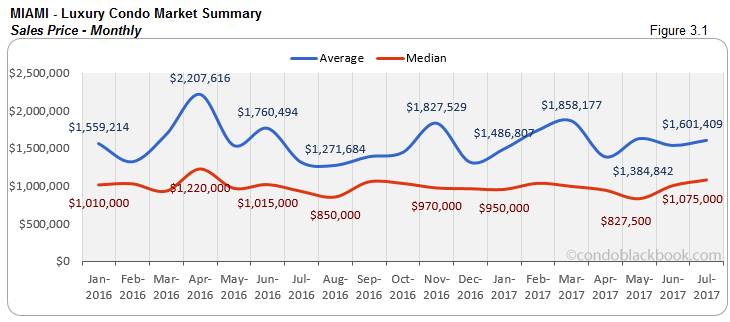
Sales Price Trends - Miami Luxury Condo Market Overall back to top
- Prices push up, buyers and sellers (perhaps) find happy middle ground. A decrease in sales price (and price /sq. ft.) has been the main fuel behind climbing sales these past few months. However, looking at how the prices are climbing back up since June (fig. 3.1), it seems that the market’s going against what’s expected. Or better still, perhaps sellers and buyers have found an agreeable middle ground, keeping prices on a healthy trajectory. So, while the median prices have ascended 8% since June, they’re also 16% higher than July last year. Same goes for the median price per sq. ft. (fig. 3.2), which is 2% higher month-on-month as well as year-over-year. We haven’t dug too deeply, but we suspect this is just a blip.
Inventory Trends - Miami Luxury Condo Market Overall back to top
A balanced market will only have 9-12 months of inventory.
- 39 months of inventory. In July, there were 3.8k active luxury condo listings on the market overall, with another 157 pending. Considering inventory moves at an average (last 6 months) of 102 deals a month, there is still 39 months of inventory to get through.
- Buyers can still seize the moment. While the previous months had been posting a steady inventory decline, June and July practically share the same months of inventory (with only a small percentile of difference). With so much inventory on hand, buyers can still take advantage of the market and drive negotiations.
City and Neighborhood Market Reports back to top
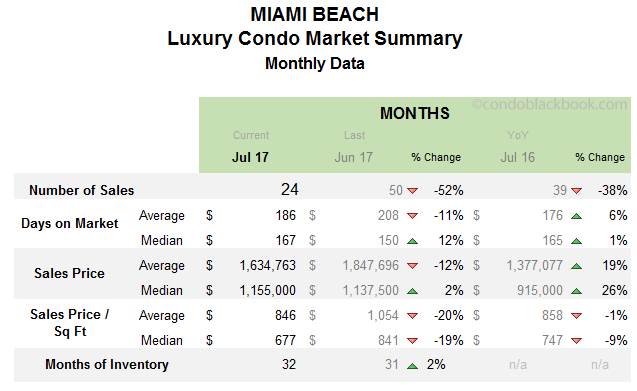
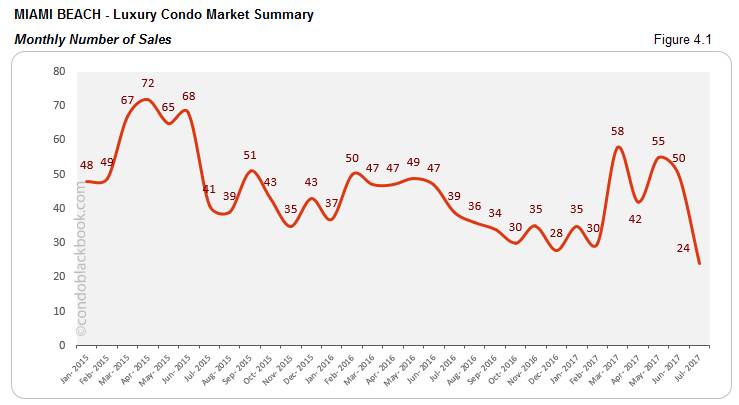
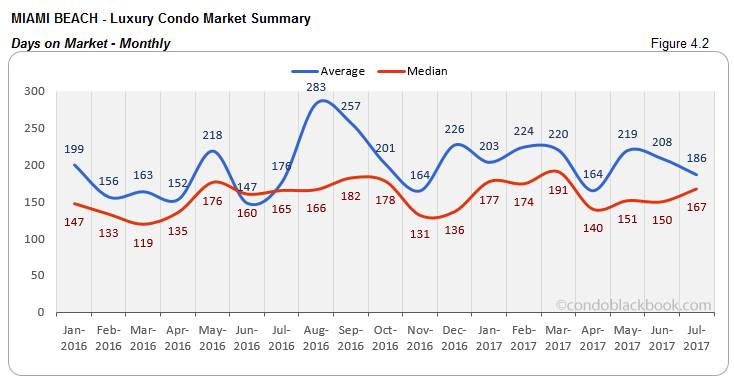
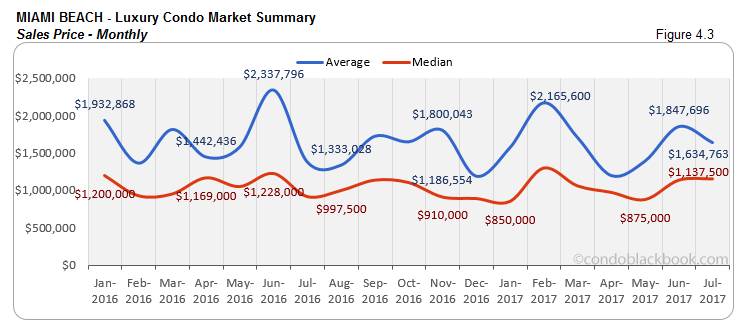
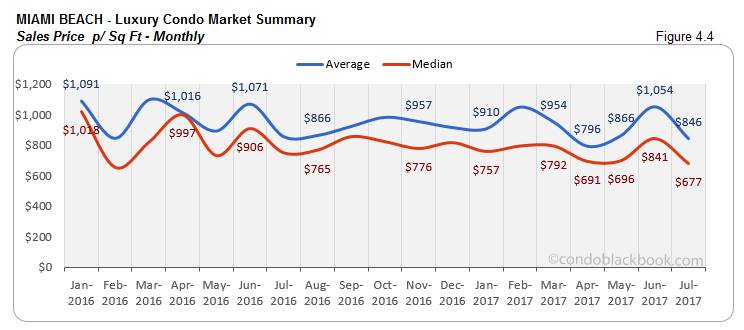
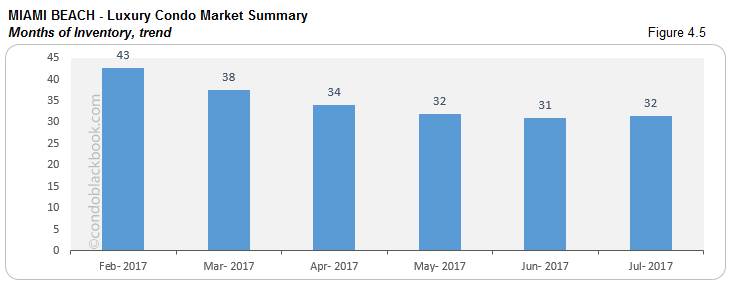
Miami Beach Luxury Condo Market Summary back to top
- 52% drop in sales due to seasonal adjustment. After many months of good sales, it seems Miami Beach’s luxury condo market is taking a break to regroup. Considering Julys are a bit slow generally (see 2016 and 2015 patterns in fig. 4.1), this drop in sales should not be reason for alarm (yet).
- Days on market inch lower, and so does price per sq. ft. We see a steady decline in the days on market (fig. 4.2) due to good sales in previous months. While prices for the overall market are inching up, the median price per sq. ft. (fig. 4.4) in Miami Beach posts a 19% drop since June. We can also see the average sales price (fig. 4.3) correcting -12% month-on-month.
- 32 months of inventory, buyers have the upper hand. Miami Beach had 1201 active listings on the market in July, plus another 50 pending. Considering inventory moves at an average (last 6 months) pace of 40 deals a month, there is still 32 months of inventory on the market. This is much higher than the 9-12 months of a balanced market (fig. 4.5). With plenty of listings and a buyer-friendly market, this is the right time to go shopping for Miami Beach condos here.
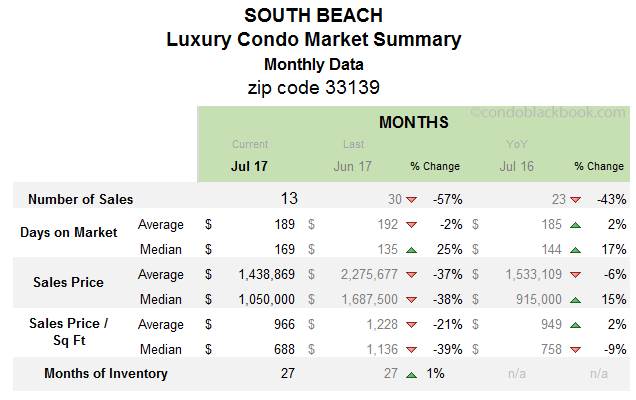
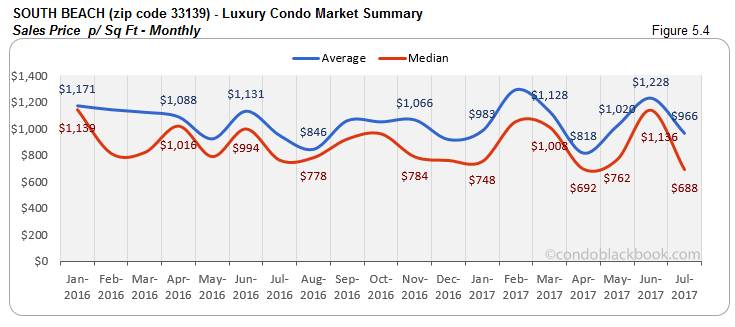
South Beach Luxury Condo Market Summary back to top
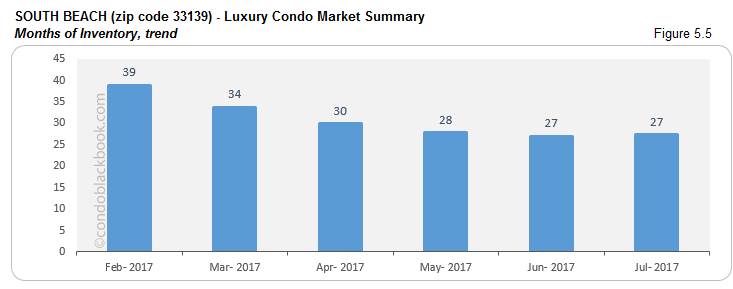
- 27 months of inventory. July posted 647 active luxury condo listings, with another 18 pending. Considering inventory moves at an average (last 6 months) of 24 deals a month, there is still 27 months of inventory on the market. This is again higher than the 9-12 months of a normal market. With almost the same amount of pending inventory as June (fig. 5.5), buyers definitely hold the advantage.
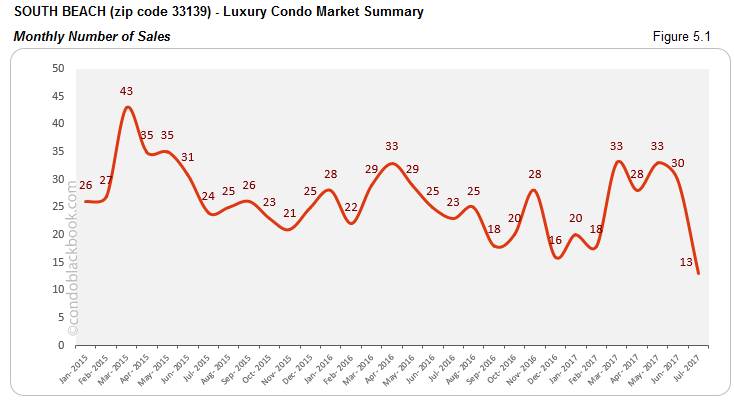
- Significant sales drop, seasonal side effect. South Beach posts the biggest monthly plunge in sales at 57%. The market seems to be taking a break to regroup here as well after its long streak of good sales. Also notice that the pattern is not new to July, as you will see the same trend in 2015 and 2016 (fig. 5.1).
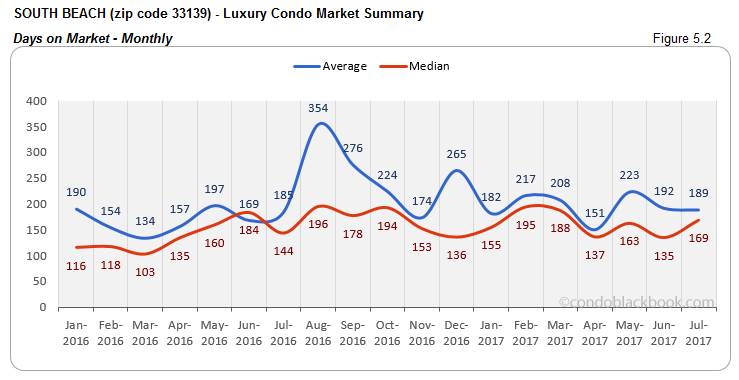
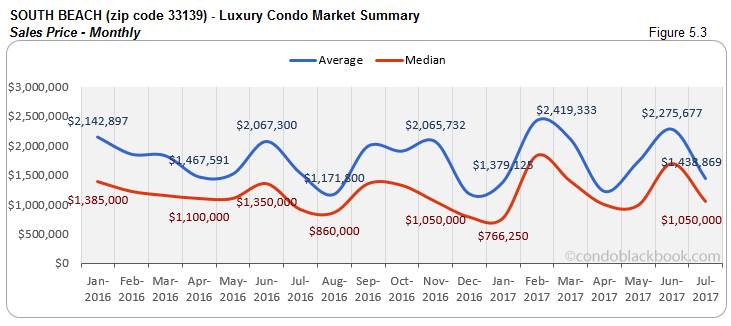
- Median days on market still high. We see good sales from previous months impacting the average days on market by pushing them down 2%. However, the median days actually inched up 25% (fig. 5.2), while the price per sq. ft. (fig. 5.4) has dropped 9% since last year.
With high inventory and lower prices, buyers should search South Beach condos for sale here.
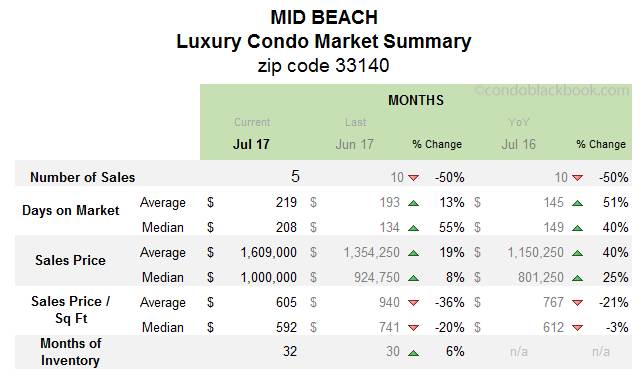
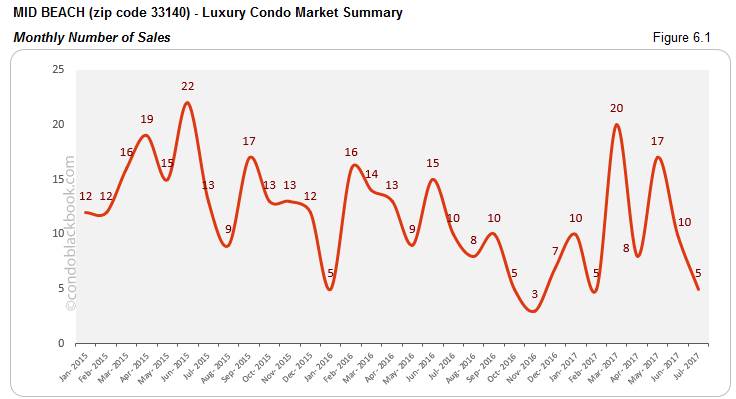
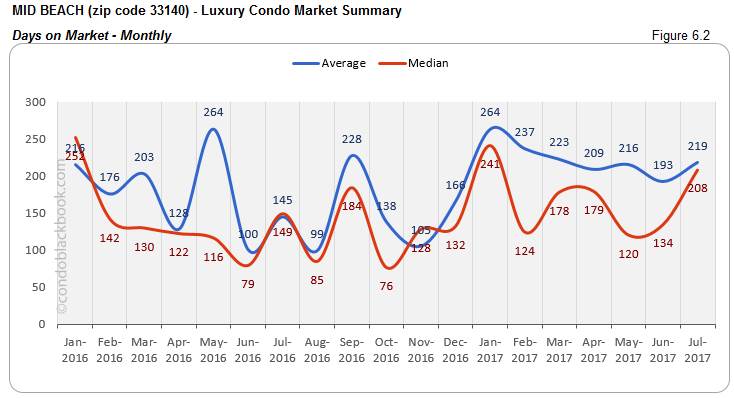
Mid-Beach Luxury Condo Market Summary (33140 zip) back to top
- Sales plunge typical of July. The luxury condo market in Mid-Beach experienced a 50% decline in monthly sales. While this is a big dip for the neighborhood, it is not uncommon to see such trends in previous years (fig. 6.1). The market here too seems to be regrouping after a good streak in the past few months.
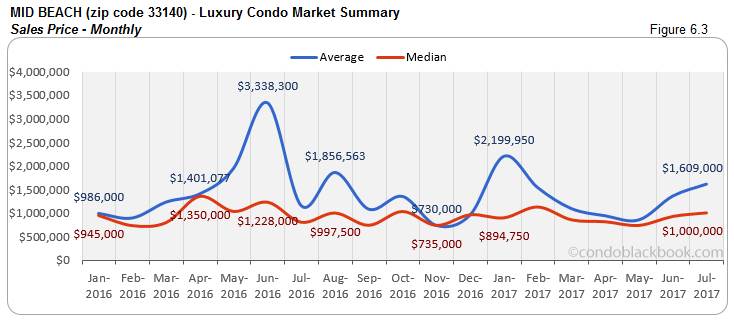
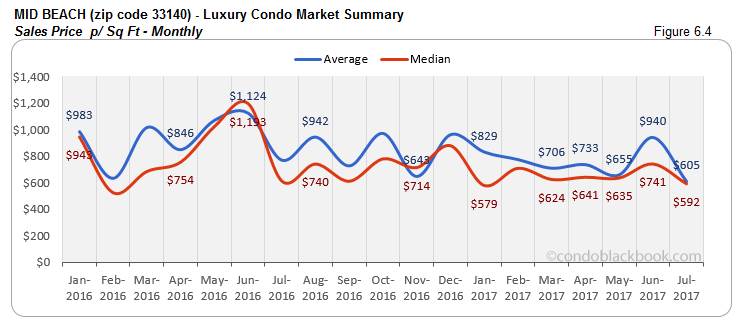
- Days on market and prices show volatility. Considering Mid-Beach has a rather modest luxury condo market, this sudden dip in sales has brought volatility to our charts for this neighborhood. For one, we see a 55% increase in the median days on market (6.2) in spite of good sales in previous months. We also see an 8% increase in the median sales price (fig. 6.3), however, the median price/sq. ft. drops 20% month-over-month (fig. 6.4). Looking closely at the charts though (fig. 6.3), you will notice that the sales price has generally reduced if we take an average of the last 4 months.
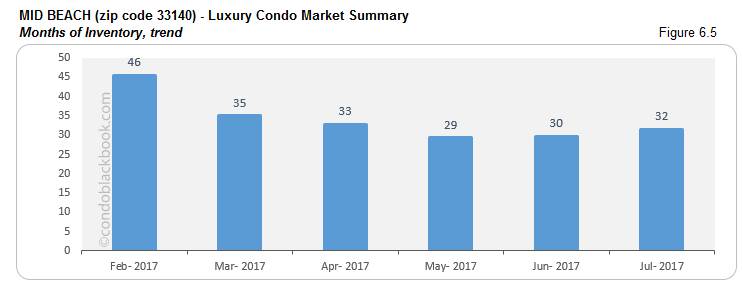
- 32 months of inventory and a buyer-friendly market. July posted 282 active condo listings in Mid-Beach, with another 16 pending. Considering inventory moves at an average (last 6 months) pace of 9 deals a month, there is still 32 months of inventory on the market. This is way off the 9-12 months typical of a balanced market. With a 6% higher surplus than June (fig. 6.5), the market clearly leans in favor of buyers. This is the right time to search and learn more about Mid-Beach condos on sale and neighborhood.
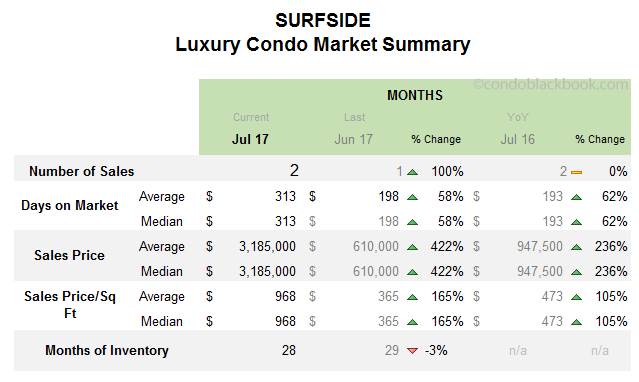
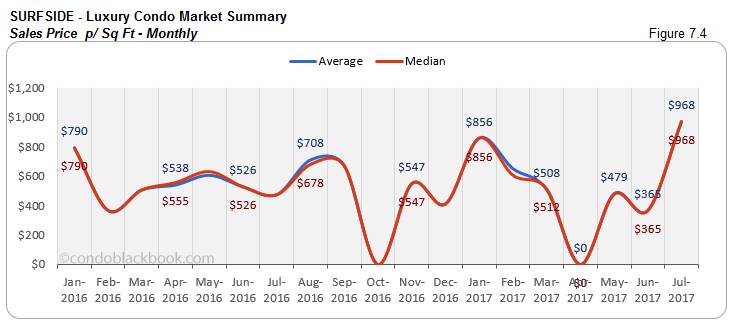
Surfside Luxury Condo Market Summary back to top
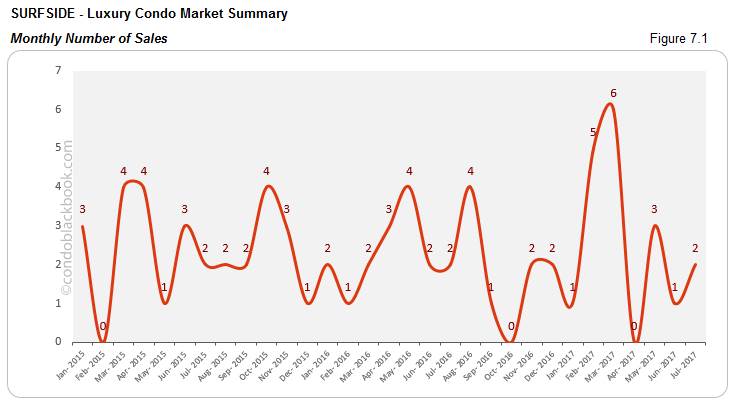
- Sales numbers not reflective of market. Surfside’s luxury condo market is quite small, so even a single sale can make a huge impact, which is exactly what happened in July. Although Surfside posts a 100% uptick in sales (fig. 7.1), looking closely it only made one extra sale this month.
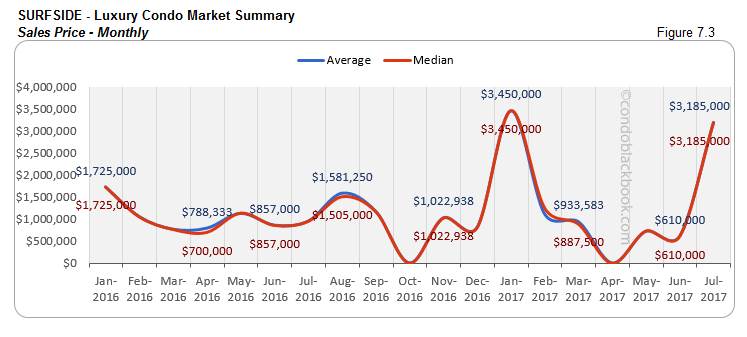
- Single expensive sale skews metrics. Again, since Surfside is a modest market, a single expensive sale can make metrics jump all over the place. This is what happened in July too. A luxury condo that had been sitting for 200 days on the market, finally closed at $5.7 million. However, this was much lower than its list price of $7.2 million. So, while the market should be showing a decrease in sales price and price/sq. ft., we rather see an uptick of 422% (fig. 7.3) and 165% (fig. 7.4), respectively.
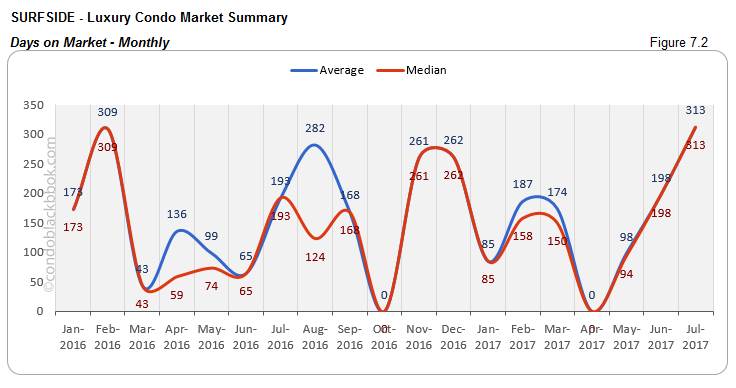
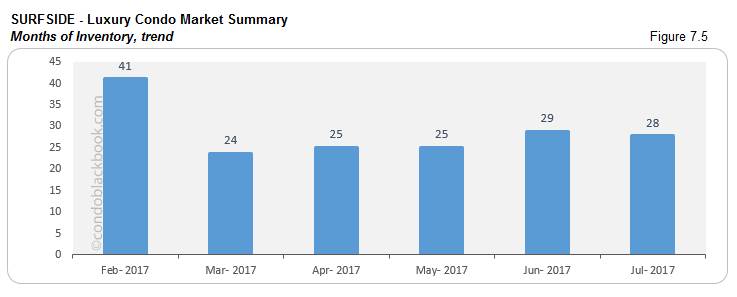
- Months of inventory still high, buyers get upper hand. In July, Surfside had 65 active luxury condo listings, with another 3 pending. Considering inventory here moves at an average (last 6 months) of 2 deals a month, the beach community still has 28 months of pending inventory (fig. 7.5). This is significantly higher than the 9-12 months of a normal market. With so many choices at hand, buyers will have the upper hand in negotiations. Search a Surfside condo for sale or learn the Surfside lifestyle here.
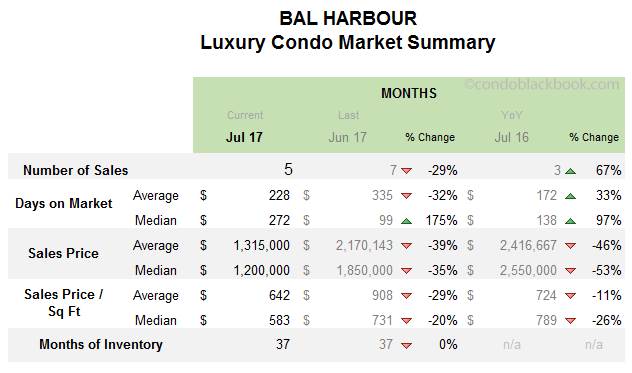
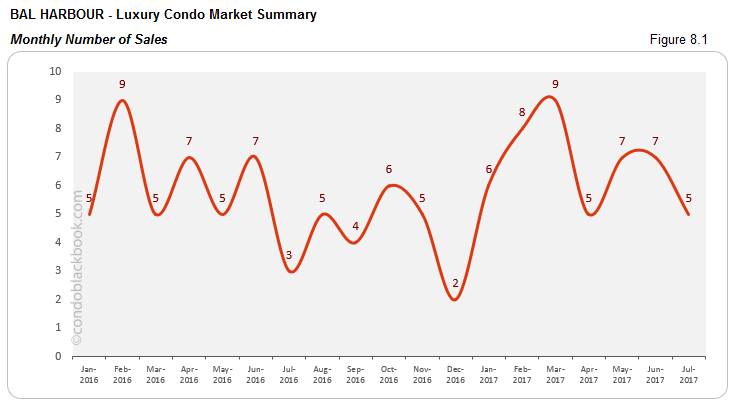
Bal Harbour Luxury Condo Market Summary back to top
- Sales drop, but still consistent. Another small market for luxury condos, Bal Harbour shows a 29% drop in sales compared to June. However, if you look at previous numbers in fig. 8.1, it’s easy to see that the market’s holding on to its consistency by hovering around 5-7 sales a month.
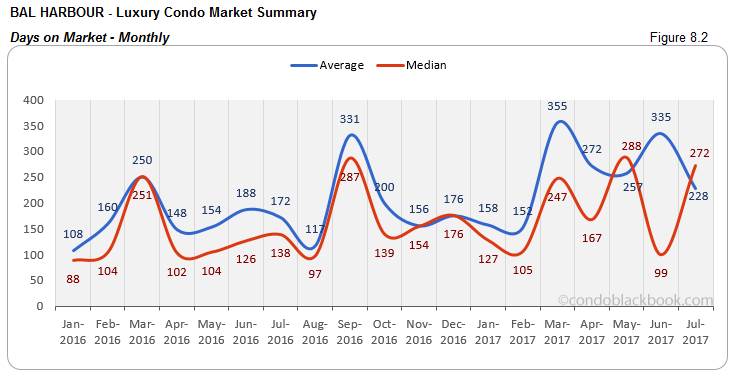
- Days on market not reflective of market. The days on market numbers are all over the place in chart 8.2. This is simply because Bal Harbour is a small market and any sudden drops or spikes can easily influence stats.
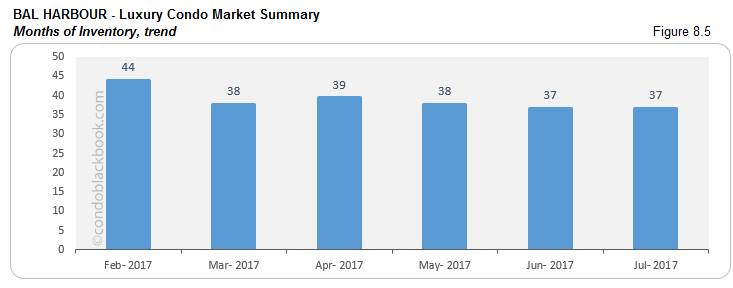
- 37 months of inventory. For July, the neighborhood saw 209 active listings on the market, and another 11 pending. With inventory moving at an average (last 6 months) pace of 6 deals a month, there is still 37 months of inventory to get through. This is again much higher than the 9-12 months typical of a balanced market.
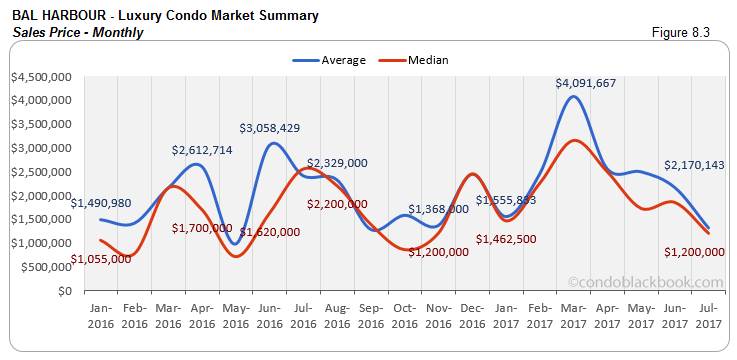
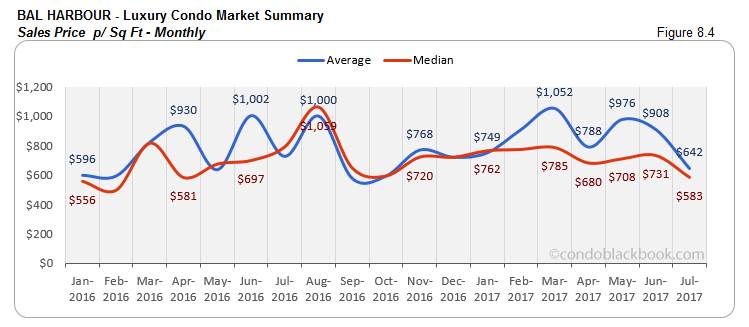
- Price and price/sq. ft. decline, buyers can play. We can take the decline in prices in charts 8.3 and 8.4 below on face value, as the trend has been consistent over the past few months. With no change in inventory to report (fig. 8.5) and lower prices, buyers can easily dictate deals and make the most of the market by searching Bal Harbour condos for sale or check out the Bal Harbour neighborhood here.
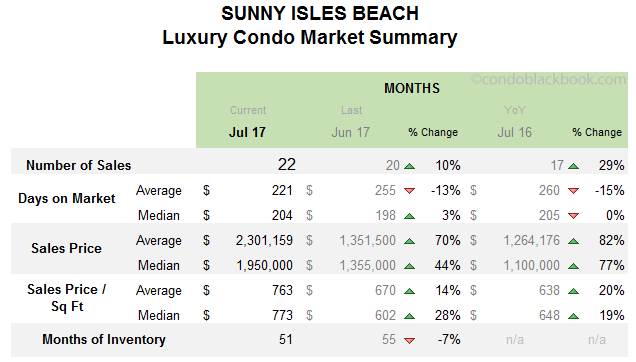
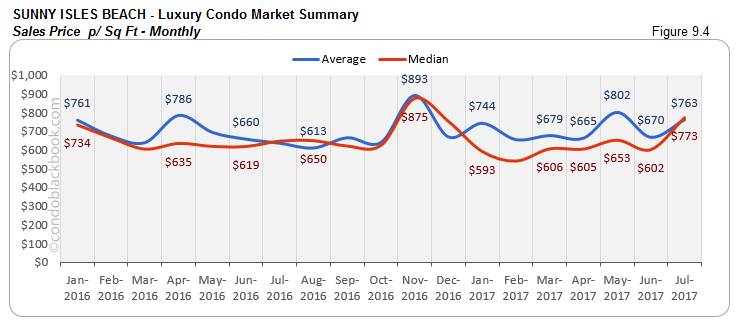
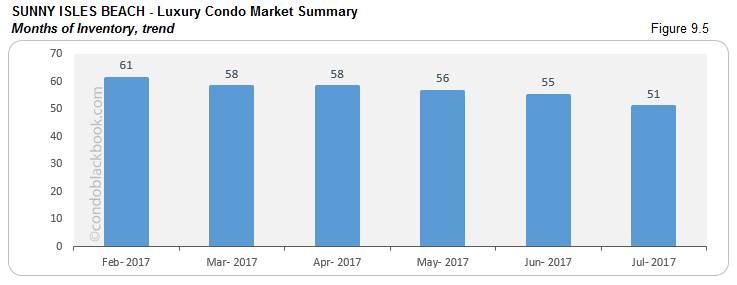
Sunny Isles Beach Luxury Condo Market Summary back to top
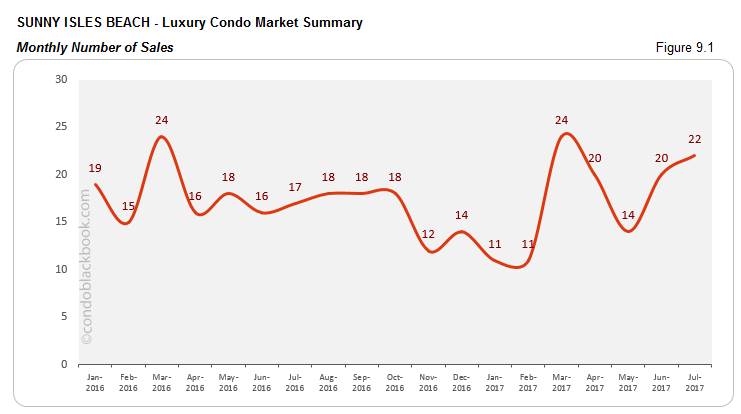
- 10% uptick in sales. Unlike other neighborhoods above and the overall market (fig. 1.1), Sunny Isles Beach has managed to maintain its positive record with 22 sales in July (fig. 9.1).
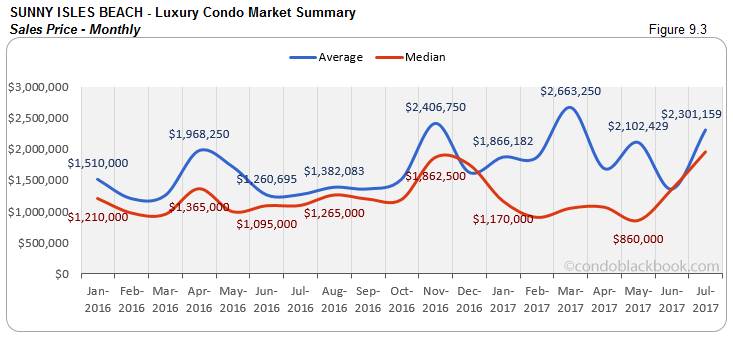
- Prices post an uptick. Prices have been on the rise for this beach town these past two months. The median sales price has increased 44% (fig. 9.3), while the median price per sq. ft. is up 28% to $773/sq. ft. With plenty of branded buildings hitting the neighborhood, this price hike seems like a by-product.
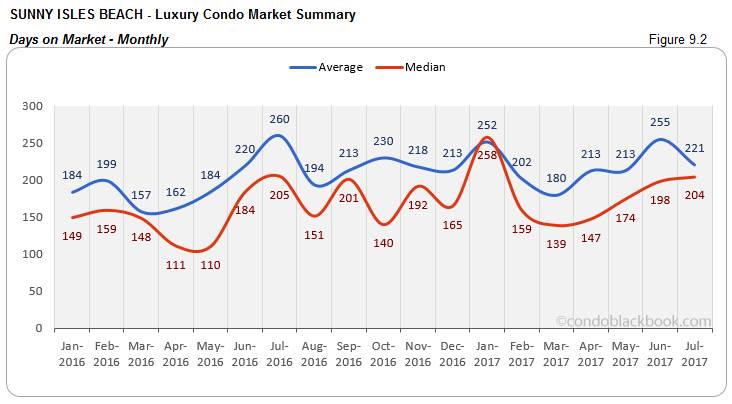
- Months of inventory and days on market still high. In July, there were 812 active luxury condo listings, with another 25 pending. Considering inventory moves at an average (last 6 months) pace of 16 deals a month, Sunny Isles Beach still has 51 months of inventory on the market. Down 7% from June (fig. 9.5), it’s still a long road to go before getting to the 9-12 months of a balanced market. The median days on market (fig. 9.2) posted a 3% increase as well. With such high levels of inventory moving at a mediocre pace, buyers can use this to their advantage by searching Sunny Isles Beach condos for sale and neighborhood info here.
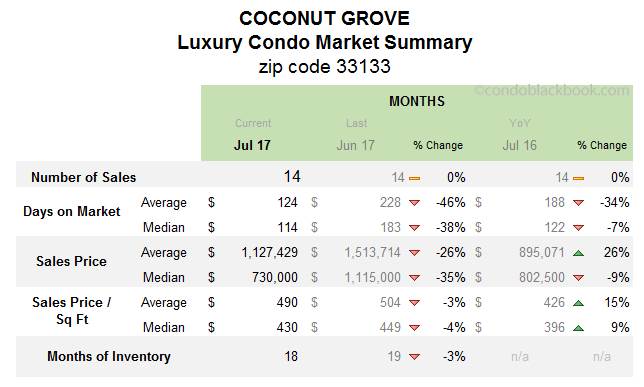
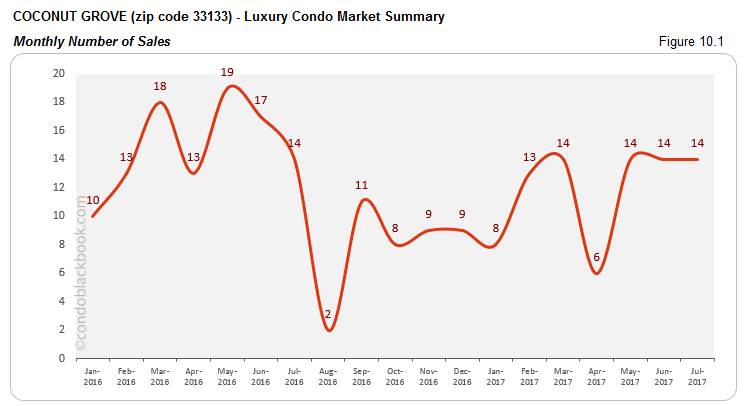
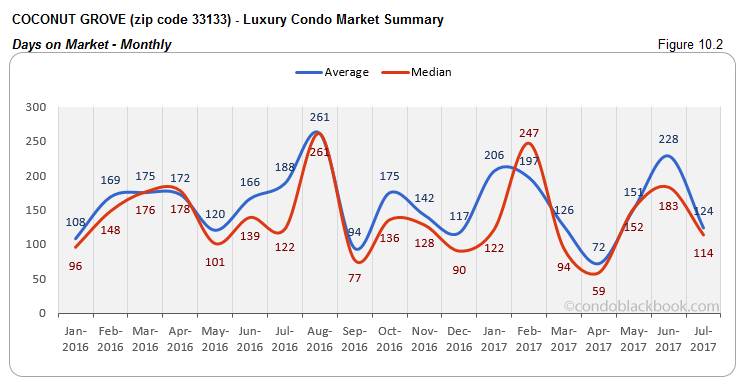
Coconut Grove Luxury Condo Market Summary (33133 zip) back to top
- Consistent sales push down days on market. Coconut Grove has kept up its positive sales for the past three months (fig. 10.1). This resulted in a good 38% decrease in the median days on market. The neighborhood has also been showing signs of recovery earlier than the rest of the market.
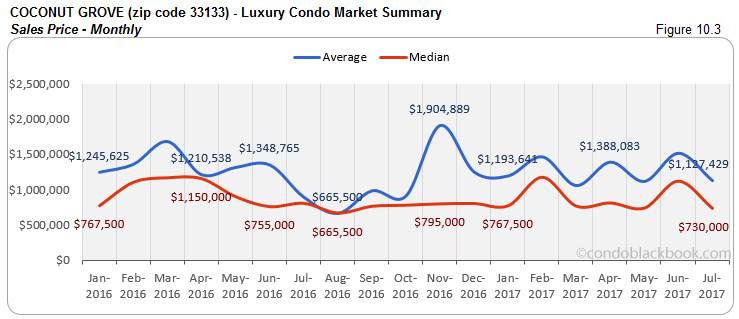
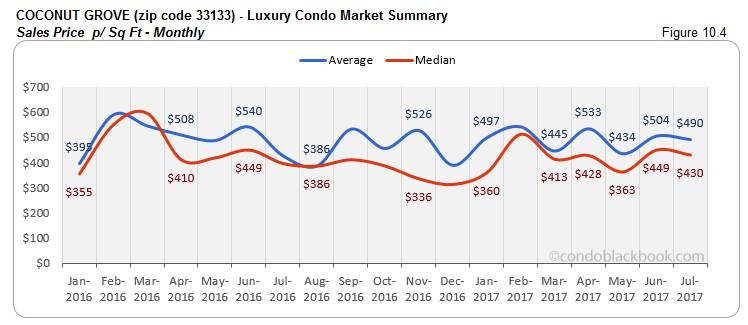
- Sales prices lower. With such a great market response, sellers seem to be adjusting their prices to appeal better to buyers. This is why the vibrant neighborhood sees a 35% decline in its median sales price (fig. 10.3) and a 4% drop in its median price/sq. ft., which is now $430/sq. ft. (fig. 10.4).
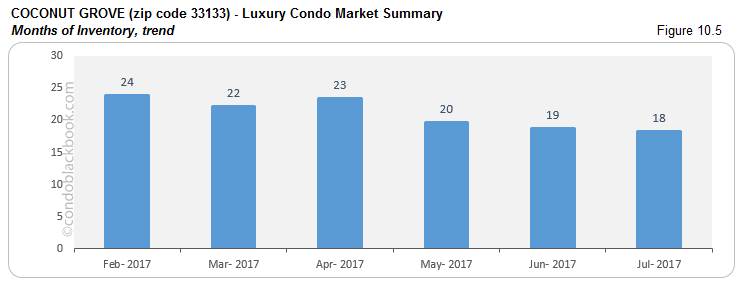
- 3% decrease in months of inventory. July saw 189 active luxury condo listings and 16 more pending on the market. As inventory moves at an average (last 6 months) pace of 11 deals a month, there is only 18 months of inventory left on the market. There is definitely some dynamic here, making it the only neighborhood under analysis with less than 20 months of inventory. Since a balanced market will have only 9-12 months of inventory, buyers still hold the advantage and have time to learn about Coconut Grove or search Coconut Grove condos for sale here.
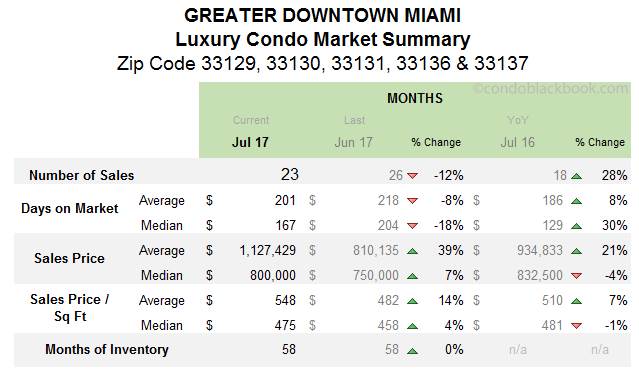
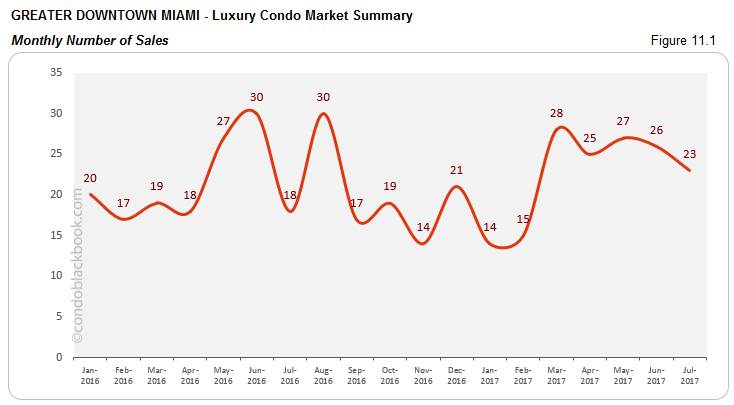
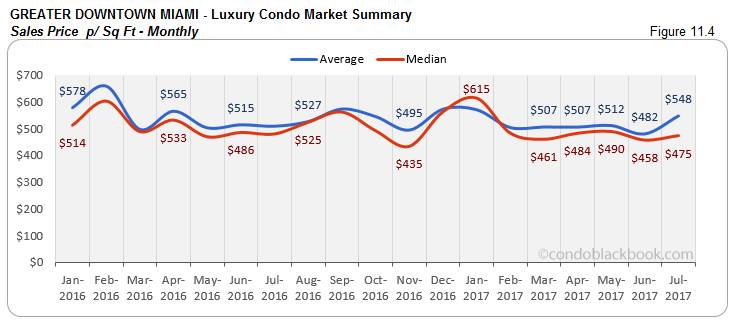
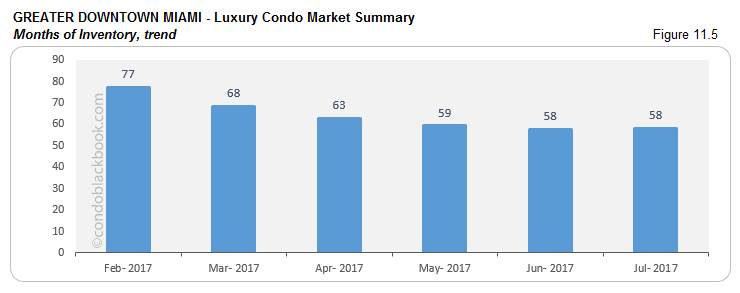
Greater Downtown Miami Luxury Condo Market Summary (33129, 33130, 33131, 33136, 33137 zips) back to top
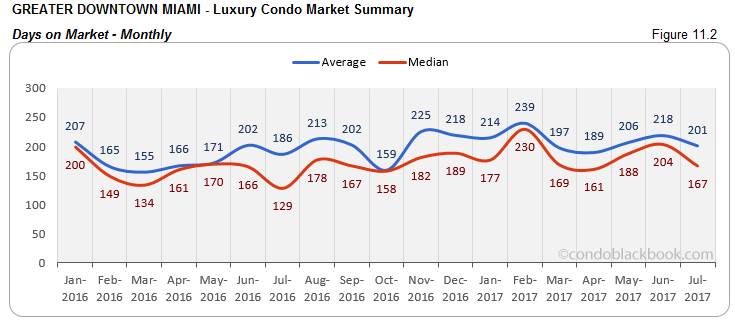
- Consistent sales push down days on market. The Greater Downtown Miami area reports a 12% decline in its monthly sales this July. However, looking closely at fig. 11.1, you’ll notice that the area has managed to keep its sales consistently above 20 for the past five months. This has helped reduce the median days on market by a good 18% (fig. 11.2).
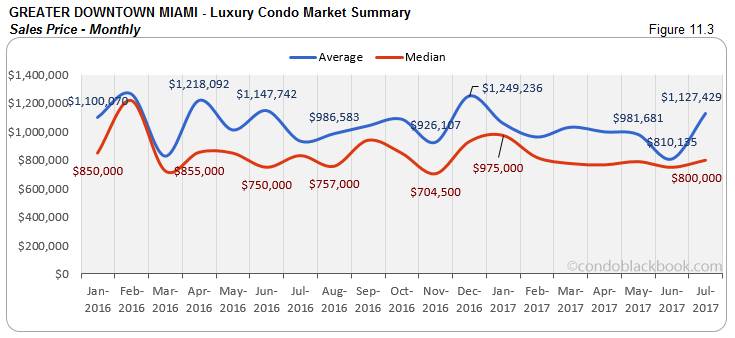
- Inventory stays put, as prices push up in buyers market. In July, there were 1212 active listings on the market, plus another 34 pending. With inventory moving out at an average (last 6 months) of 21 deals a month, GDM is still left with 58 months of inventory (fig. 11.5). On the other hand, median prices for the area are up 7% (fig. 11.3) and the median price/sq. ft. is up 4% at $475/sq. ft. (fig. 11.4). Given that the surplus of inventory is way off the 9-12 months mark of a normal market, buyers can easily find deals and explore their options in the Greater Downtown Miami area here.
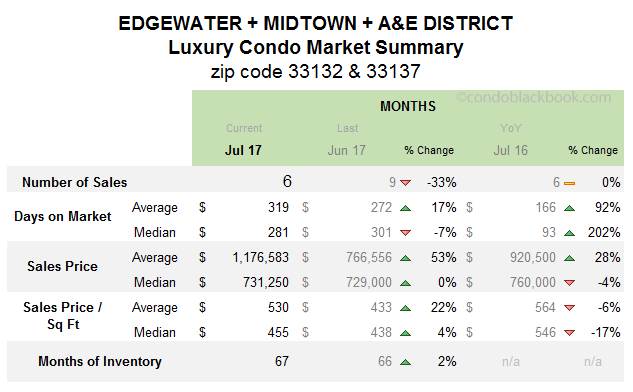
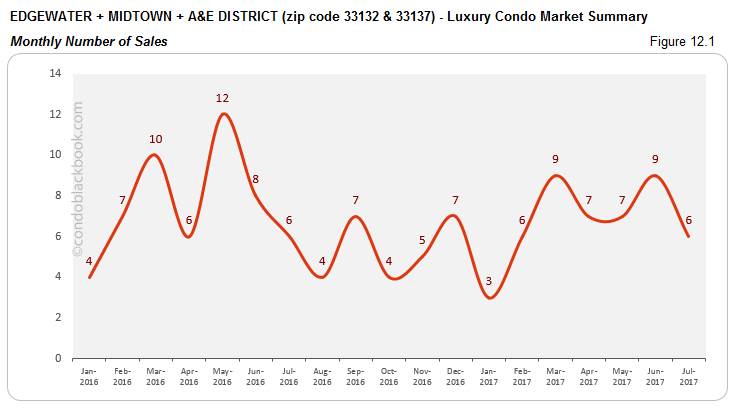
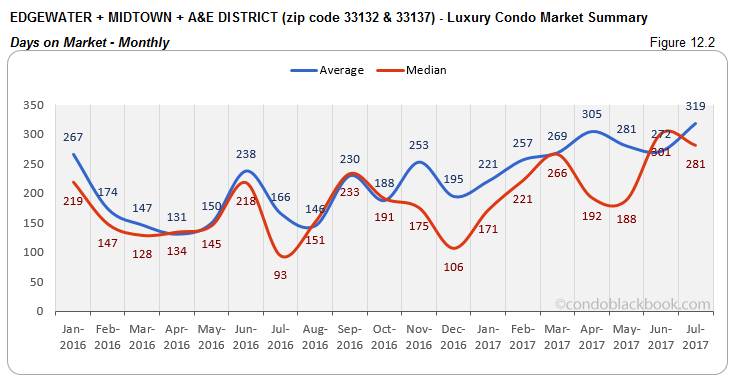
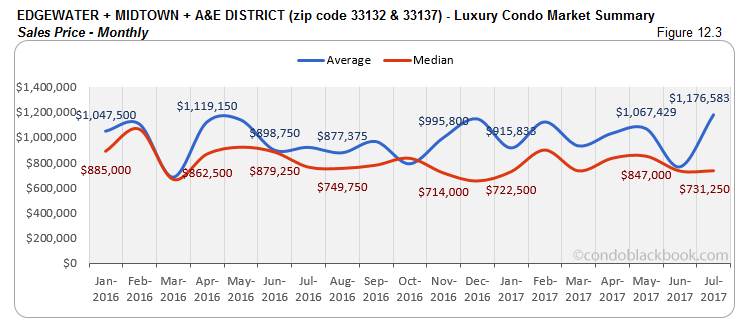
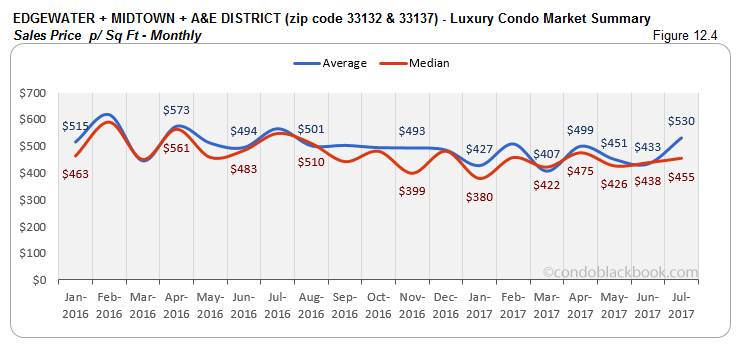
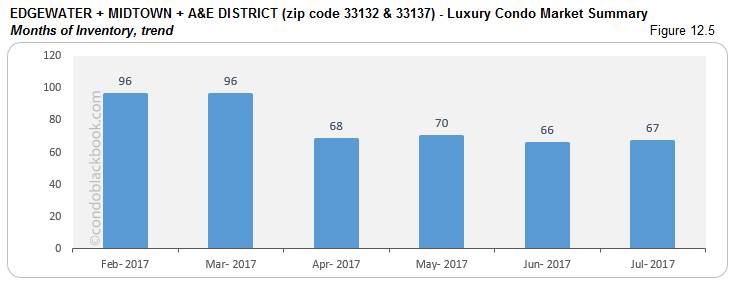
Edgewater + Midtown + A&E District Luxury Condo Market Summary (33132 + 33137 zip) back to top
- Slow sales and high days on market. Fig. 12.1 shows a 33% drop in monthly sales for this grouping. We also see a drop of 7% in the median days on market (fig. 12.2); however, the grouping still has a long way to go before condos start moving off the market fast.
- Prices inch up slightly, but lower year-over-year. There’s a minute upward shift in the price charts in fig. 12.3 and 12.4 for the month of July. However, the grouping reports a year-over-year decline of 4% in sales price and 17% in price per sq. ft. The prices will still be considered lower here, even if you take an average of the last 4 months.
- Months of inventory jump 2%, buyers have control. For July, the grouping posted 433 active listings, with another 6 pending. Considering inventory moves at an average (last 6 months) of 7 deals a month, there is still 67 months’ worth of inventory sitting on the market. This is significantly higher than the 9-12 months of a balanced market. Fig. 12.5 also shows an increase in inventory since last month. With such high days on market and inventory, buyers can easily steer transactions in their favor. Check out the individual lifestyle and condo options in Edgewater, Midtown and Arts & Entertainment District.
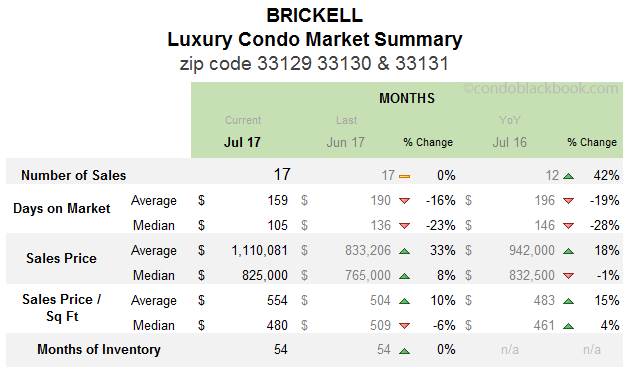
Brickell Luxury Condo Market Summary (33129, 33130, 33131 zip) back to top
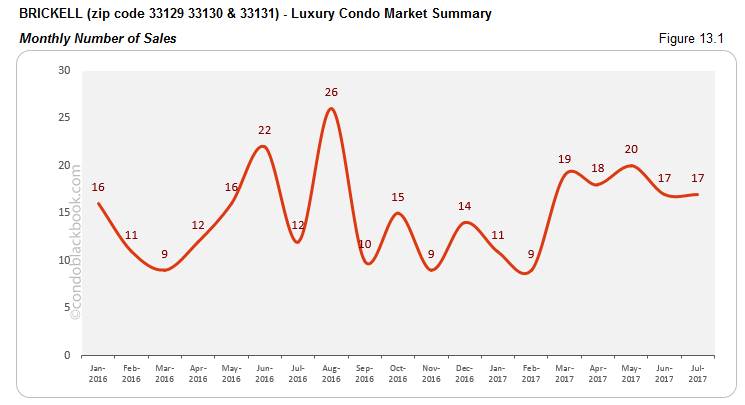
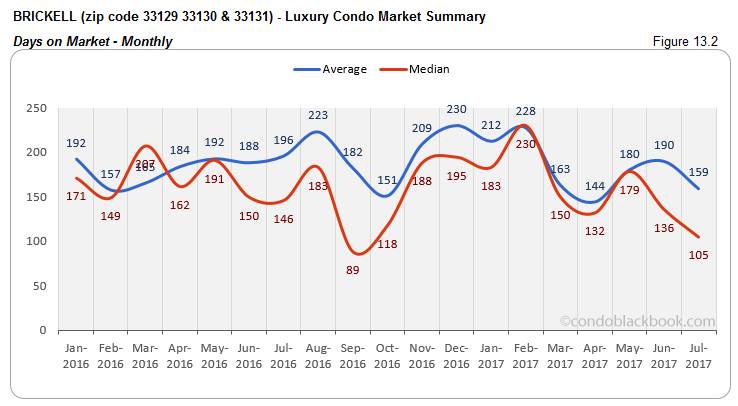
- No change in sales, but consistent enough to pull down days on market. There’s much to cheer about in Brickell. The neighborhood has had a great run these past 5 months, with sales hovering around 20 a month (fig. 13.1). Though there is no change in July’s numbers, this consistency has brought down the median days on market significantly (23%), as can be seen in fig. 13.2.
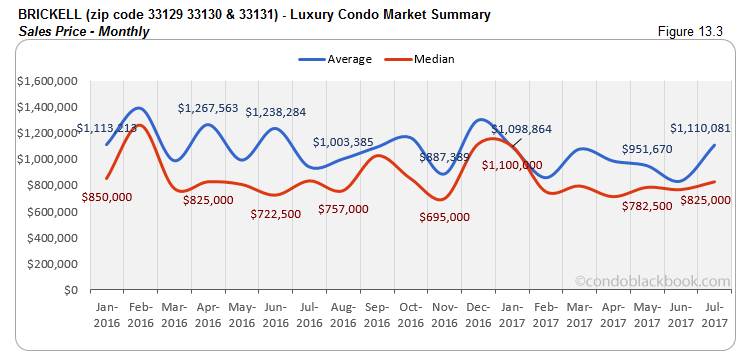
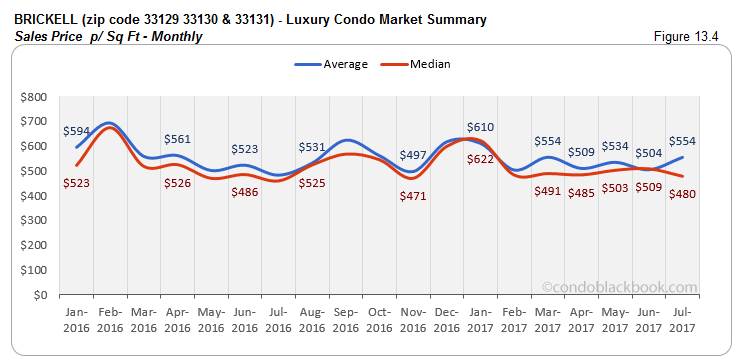
- Even prices. Prices in Brickell can more or less be considered even. While the median sales price moved up 8% (fig. 13.3), the price per sq. ft. settled at $480 (fig. 13.4), that’s 6% lower as compared to June.
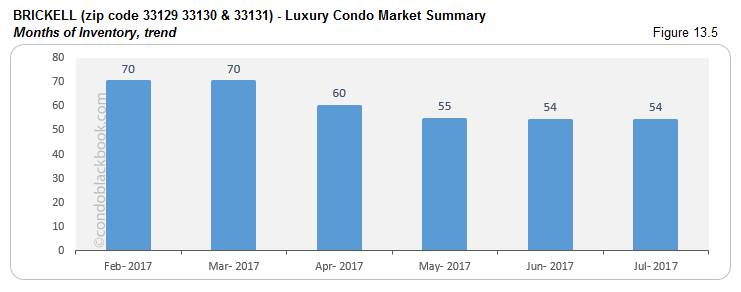
- 54 months of inventory, buyers retain edge. In July, Brickell saw 779 active listings, with another 28 pending. Considering inventory moves at an average (last 6 months) of 15 deals a month, the financial hub still has 54 months of inventory to deal with (fig. 13.5). This is again way higher than the 9-12 months of a balanced market. Such high inventory means buyers have plenty of room to play with negotiations. Click to see Brickell’s lifestyle and condo options here.
Coral Gables Luxury Condo Market Summary back to top
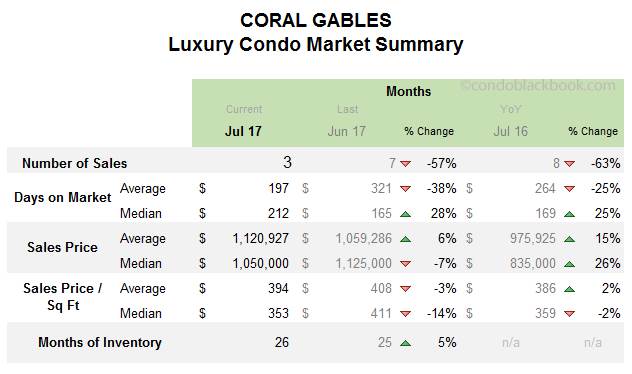
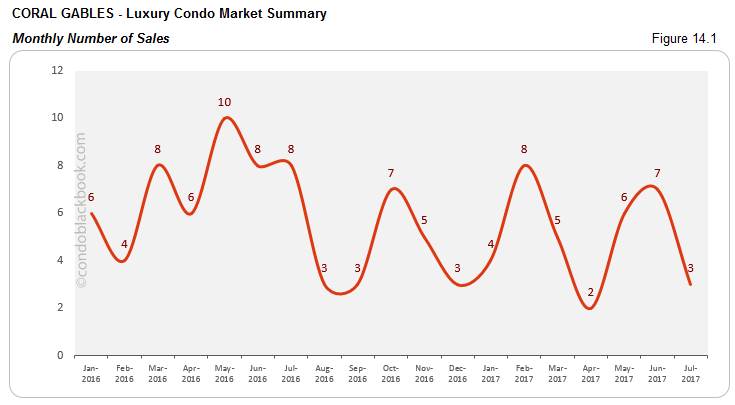
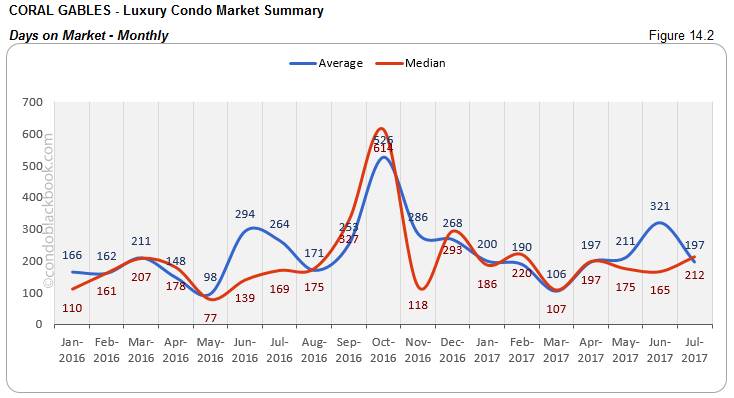
- Sales drop causes rumble in metrics for modest market. Coral Gables has a rather small luxury condo market. So, a sudden drop in sales to the tune of 57% month-on-month (fig. 14.1), has translated into a sudden spike of 28% in the median days on market (fig. 14.2).
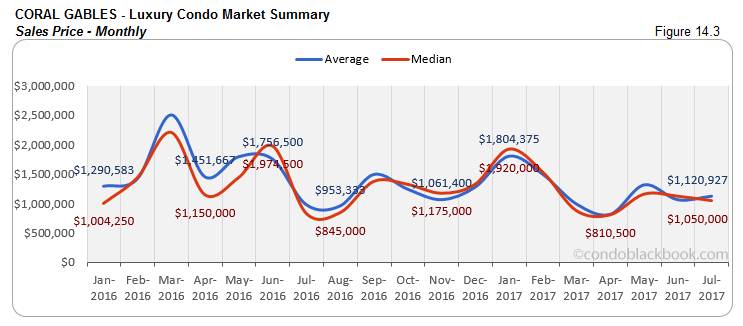
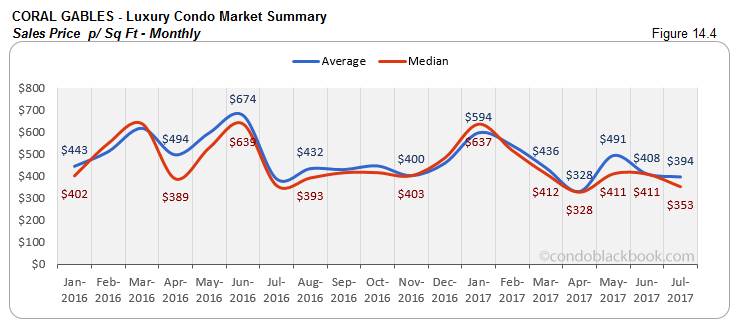
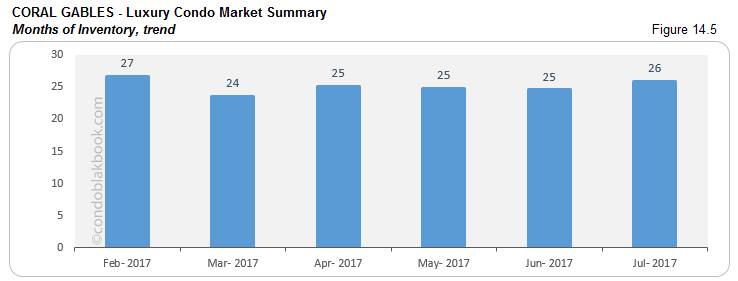
- Buyer can rejoice with higher months of inventory and lower prices. Again, this drop in sales has caused volatility in the months of inventory, pushing it up 5% (fig. 14.5). For the month of July, Coral Gables posted 109 active luxury condo listings, and another 15 pending. With inventory moving at an average (last 6 months) pace of 5 deals a month, there is still 26 months of inventory on the market (fig. 14.5). This is again higher than the 9-12 months of a balanced market. On the other hand, the median sales price posted a 7% drop (fig. 14.3), with the median price/sq. ft. adjusting -14% (fig. 14.4). This again puts the advantage in the hands of the buyer. Click to see lifestyle and condo options in Coral Gables.
Conclusion back to top
Buyers market prevails. As the market yo-yos between good sales and average, buyers clearly hold the advantage. There’s still plenty of surplus to get through. While prices might be pushing to get to the higher side, buyers definitely have the upper hand and can freely go shopping.
Love what you see? Don’t forget to share our blog and subscribe (see the subscribe link on the top menu) to receive the latest market news in your inbox.
Have any questions? Or see something wrong with the stats? Please contact Sep at sniakan (at) hbroswell.com or call 305-725-0566.
Share your thoughts with us

Your Miami Condo Awaits
Recent Posts


 (305) 697-7667
 (786) 321-7233
  contact@condoblackbook.com

