Luxury Miami Condo Report : Nov 2017
Dec 24, 2017 December 24, 2017
City and Neighborhood Luxury Condo Reports
Miami Beach Luxury Condo Report
South Beach Luxury Condo Report
Bal Harbour Luxury Condo Report
Sunny Isles Beach Luxury Condo Report
Greater Downtown Miami Luxury Condo Report
Edgewater / Midtown / A&E District Luxury Condo Report
Coconut Grove Luxury Condo Report
Coral Gables Luxury Condo Report
Miami Luxury Condo Market Report: Summary
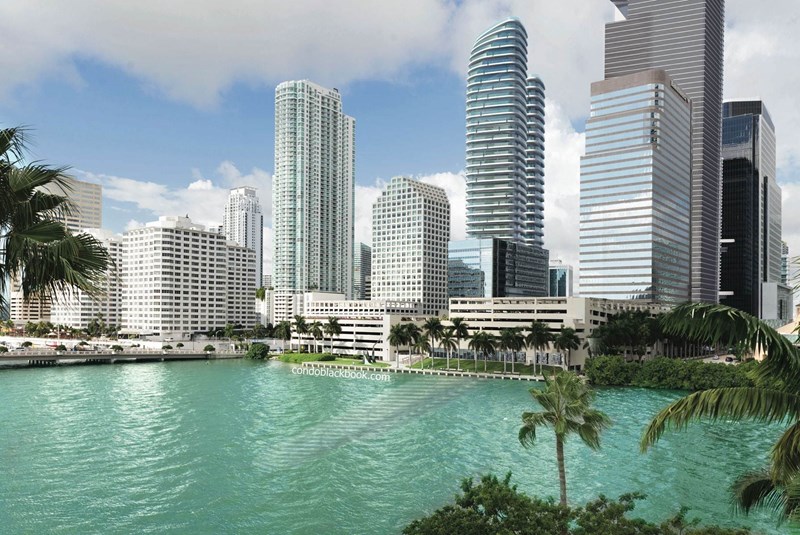
November marks the beginning of the Holiday season and shopping trips. However, for Miami’s real estate, buyers seemed to be a bit pre-occupied to go condo shopping. Nonetheless, Art Basel month is in full swing and we expect a strong, sunny winter to warm up the market.
Read on for a closer look into the Miami’s luxury condo market this November.
For the purpose of this luxury condo report, we have only considered properties priced $600,000 and above.
Overall Market Highlights:
- Overall sales go sideways as some neighborhoods struggle and other post an uptick
- Overall median days on market decline, a good signal for sales momentum
- Lower ultra-luxury sales lead to low average sales prices overall
- More listings and slower sales keep inventory high
- Buyers still control the market, though a strong winter could initiate a change
Sales go sideways, but require stronger momentum. We’ve had a mixed bag of sales numbers this November. While some neighborhoods like Miami Beach posted a decline, others like Coral Gables and Bal Harbour posted some pretty strong numbers. This has the overall sales hovering, as seen in fig. 1.1 below. However, with a strong winter expected, we are looking forward to an impactful closing on 2017 and robust start on 2018.
Days on market finally decline. Lower days on market means properties are moving faster, which is a good sign for sales momentum. Most neighborhoods in our study have reported a decrease in their median days on market for November. This has helped lower the overall trend to get in sync with last year’s number. If sales pick up this winter as expected, we hope to look at an even lower days on market in the future.
Lower ultra-luxury sales bring down prices. While October showed some very inflated prices, this month we see a correction in the charts. With fewer ultra-luxury sales (above $2 million) for most neighborhoods, it’s easy to see how the price charts have adjusted lower to reflect the true price range of the typical luxury segment and how sellers have been adjusting to the current market weather that favors buyers.
Inventory moves up again. The upward shift in inventory last month was mainly due to more listings added to the market in anticipation of the sales high season which starts during the holidays. If the upcoming months deliver as expected, this rush should be cleared soon enough.
Overall, we see a market that still has ways to go before finding its footing. If this winter plays out as expected, we could be looking at a positive turn of events.
Where Does the Market Go From Here? back to top
In previous reports, we’ve discussed at length how a strengthening U.S. dollar, strong stock market and shaky start to the presidency have been holding back sales numbers and brought the current condo market to favor buyers.
However, we expect the following to change this trend and bring the market back in balance:
- Tax cuts in the pipeline. We already have an idea of the kind of tax cuts the wealthy are about to receive. As these going into effect in 2018, we can expect more of the elite to come shopping for second homes in Florida, as well as the wealthy in the SALT tax states (New York, New Jersey, Massachussettes, California, etc) looking to establish residency in income-tax-free Florida.
- Art enthusiasts have arrived. We are in Art Basel month at the time of this writing and our shores are already brimming with the who’s who of the art world. As more vacationers and collectors decide to spend Christmas on the beach, we could end up seeing our expected boost in sales, as happens in most years.
- Sellers should continue being flexible. With a lot of neighborhoods posting less ultra-luxury sales (above $2 million) this month, we see a drop in prices to reflect the true mindset of the average luxury segment. As sellers continue being flexible, they can be in a good position to sell their properties during the strong winter we expect.
Below is an insight into Miami’s overall and neighborhood-level luxury condo trends for the month of November 2017:
Monthly Number of Sales - Miami Luxury Condo Market Overall back to top
- Sales go sideways, though expecting a strong winter. Looking at fig. 1.1 below, we notice how November’s sales mark is only slightly lower in comparison to October (-4%) and same month last year (-2%). Now, even as sales hover closer to last year, they are quite low in comparison to November 2015, which was a far better year for the market. Nonetheless, we are hoping and expecting a stronger closing on 2018 with Art Basel and Christmas on the beach bringing back globetrotters.
- Trend line tips downward. The overall luxury condo sales may have dipped only slightly, but the slack has left its mark (as is visible below). We see the 12-month trend line tip downward for the first time since we started tracing the trend in August.
Days on Market - Miami Luxury Condo Market Overall back to top
“Days on market” are the total number of days from when a property is active to the day it goes under contract.
- Days on market decline to match historic figures. After an unusual bump up in September and October, we finally see the days on market move down and closer to last year’s numbers (see fig. 2.1). The median days for November are just 6% higher than last year and a good 20% lower than last month.
Sales Price Trends - Miami Luxury Condo Market Overall back to top
- Overall prices deflate with lower ultra-luxury sales. For the past few months, we’ve pointed out the disparity between the luxury segment’s actual (modest) pricing and the charts reporting higher rates. This month we see a correction with lower ultra-luxury sales (above $2 million). November reports only 13 ultra-luxury sales, against September’s 17 and October’s 20 overall. This brings down the monthly median price by 24% and the price per sq ft by 7%. (See fig. 3.1 and 3.2 below.)
Inventory Trends - Miami Luxury Condo Market Overall back to top
A balanced market will only have 9-12 months of inventory.
- Inventory inches higher for second consecutive month, buyers retain edge. We now have the months of inventory increasing two months in a row. Fig. 3.3 puts the months of inventory at 43 (4000 active listings + 175 pending listings divided by an average of 98 deals a month). Our analysis shows that the rush of inventory brought in last month needs a higher sales average to clear out. With a likely strong winter, we expect this increase of inventory to ease out by the first quarter of 2018. Till then buyers can definitely take advantage of the situation to drive deals in their favor.
City and Neighborhood Market Reports back to top
Miami Beach Luxury Condo Market Summary back to top
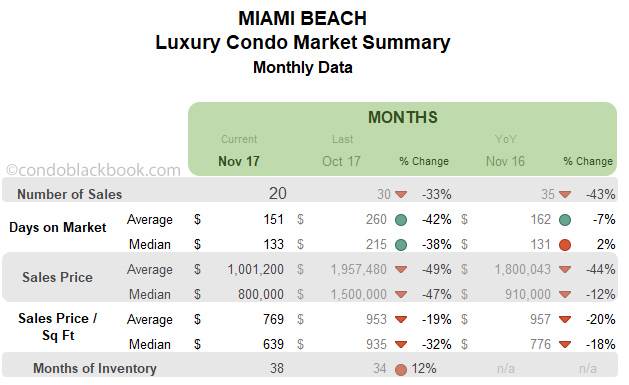
- Expected dip in sales and trend line. After last month’s uptick, Miami Beach condos have lower sales to report for November. This decline is quite expected during the last quarter. We have November closing with 33% lower sales than last month and 43% below the same month last year (fig. 4.1). Even the 12-month trend line echoes this downward trend (fig. 4.1.1). But, with the arrival of Art Basel crowd and snowbirds spending winter on the beach, we expect a strong closing to 2018.
- Days on market drop down to match historic levels. After an unusual escalation in September and October, we see the days on market settle down this month. The monthly median has dropped 38%, while it is only 2% higher than last year. (See fig. 4.2)
- Prices deflate with fewer ultra-luxury sales. Miami Beach has no ultra-luxury condo sales (above $2 million) to report for November, whereas September and October had 4 and 6 respectively. This brings down the average price by 47% and price per sq. ft. by 32% from last month. The median condo price and price per sq. ft. have also dropped 12% and 18% respectively, compared to last year. (See fig. 4.3 and 4.4 below.)
- Inventory nudges up 12%. Miami Beach reports 38 months of condo inventory in November below (1245 active listings + 71 pending divided by an average of 34 deals a month). This metric has again moved further away from the 9-12 months of a normal market, giving buyers greater power while shopping for Miami Beach condos for sale here.
South Beach Luxury Condo Market Summary (33139 zip) back to top
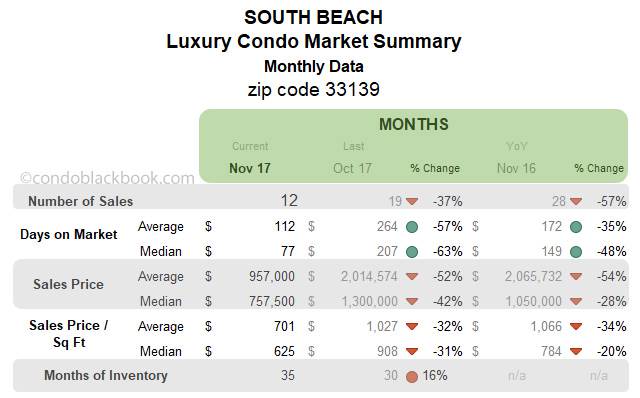
- Sales and trend line take a dive. Sales are expected to be quiet in the last quarter each year, which becomes quite evident in the chart below (fig. 5.1). This time South Beach takes a bigger blow with sales closing at 37% below last month and 57% below same month last year. This also affects the trend line heavily (fig. 5.1.1), making it dip further in November. However, with Art Basel folk and snowbirds flocking it’s sunny shores, we are looking forward to a strong recovery.
- Days on market post sharp decline. Luxury condos seemed to be moving off the market more quickly as sellers generally have clarity as to the prices buyers are willing to pay. The days on market make a nose dive in the chart below. The median days now stand 63% lower compared to October and 48% lower compared to the same time last year.
- No ultra-luxury condo sales correct inflation from previous months. We see a drastic drop in the prices in South Beach condos this month, owing to zero ultra-luxury sales (above $2 million). There were 3 such high-priced sales in September and 4 in October that kept pushing charts upward. However, this month we have the median price come down 42% month-on-month and 28% year-over-year. Also, the monthly median price per sq. ft. has dropped 31% to $625/sq ft. (See fig. 5.3 and 5.4 below)
- Inventory climbs higher. Fig. 5.5 below shows a higher months of inventory at 35 (691 active listings + 31 pending listings divided by an average of 20 deals a month). This is 16% higher than last month and way off the 9-12 month mark of a balanced market. With inventory statistics and prices clearly favoring condo buyers, folks should go shopping for South Beach condos for sale here, or begin by checking out this vacation hotspot here.
Mid-Beach Luxury Condo Market Summary (33140 zip) back to top
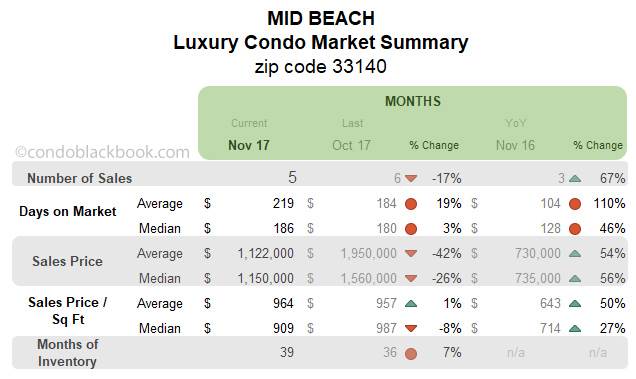
- Sales slide slightly along with trend line, but improve year-over-year. We see a slight decline of 17% in the sales numbers this November. However, Mid-Beach posts an increase of 67% year-over-year. Still, this does not stop the trend line from tipping downward in fig. 6.1.1 below. Hopefully, a strong winter will give this family-friendly neighborhood the push it needs.
- Price charts correct with fewer ultra-luxury sales. We’ve seen the prices inflate in Mid-Beach over the past few months owing to ultra-luxury sales (typically above $2 million). However, the median price drops 26% and price per sq ft declines 8% this month, both moving closer to the prices set by the luxury segment. (See fig. 6.3 and 6.4 below.)
- Months of inventory continue upward trek. November posts 39 months of inventory in the chart below (287 active listings + 21 pending listings divided by an average of 8 deals a month). This is 7% higher than October, and way off the 9-12 months mark of a balanced market. Buyers should take a cue, since they do have
the pick of the litter, and scout for deals on Mid-Beach condos on sale here or take a tour around this casual neighborhood here.
Surfside Luxury Condo Market Summary back to top
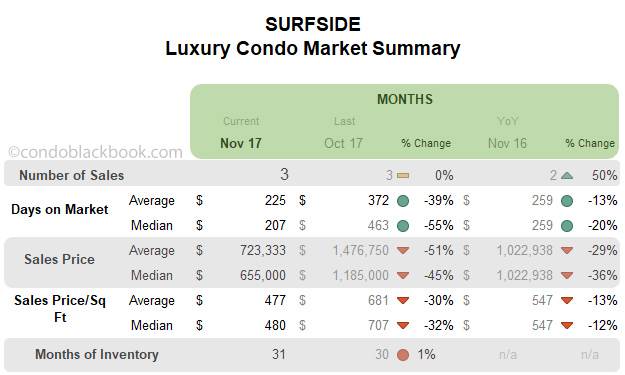
- No change in sales, trend line hovers. Condo sales in November match last month, posting zero changes for Surfside. We also see a 50% increase year-over-year. However, we still notice the trend line tip slightly this month (fig. 7.1.1). Considering Surfside is a small market for luxury condos, high volatility is expected of the metrics.
- Days on market drop. There is a 55% drop in the median days on market over the previous month. A closer look at fig. 7.2 below also reveals a decline of 20% compared to November last year.
- Prices post a sharp decline. We see a drastic drop in prices for this neighborhood. The median price is down 45% month-on-month and 36% year-over-year. Even the price per sq. ft. is 32% lower compared to October and 12% less year-over-year. (See fig. 7.3 and 7.4 below.) Again, since Surfside is such a small market, a few condo sales on the lower end of luxury or ultra-luxury can sway the numbers drastically one way or the other.
- Inventory stays high, buyers set to gain. Fig. 7.5 reports the months of inventory to be at 31 (69 active listings + 1 pending divided by an average of 2 deals a month). With inventory way off the 9-12 month mark of a balanced market and prices dropping lower, buyers should take a cue and search a Surfside condo for sale here, or see what lifestyle makes up the community of Surfside.
Bal Harbour Luxury Condo Market Summary back to top
- Sales post uptick with positive trend line. Bal Harbour is one of the few neighborhoods in our study to report positive sales this month. The numbers are 40% higher compared to last month and same time last year. This helps the trend line in fig. 8.1.1 maintain its positive stance.
- Days on market pull down. Like most neighborhoods in our study, we notice a change for the better in the days on market. The median is 85% lower compared to last month and 66% lower compared to November last year.
- Ultra-luxury deals fuel price boost. We again see a major uptick in the prices for Bal Harbour. This time, we have 5 out of the 7 sales being ultra-luxury (above $3 million). This brings the monthly median price up by 72%, and 275% higher year-over-year. The price per sq. ft. is also up 75% since October and 123% compared to same month last year. (See fig. 8.3 and 8.4 below.)
- Months of inventory nudge up. Fig. 8.5 puts the months of inventory at 38 (232 active listings + 11 pending divided by an average of 6 deals a month). This is way off the 9-12 months of a normal market. With plenty of choices on the market, buyers should look into striking a good deal by searching for Bal Harbour condos for sale here or check out this upscale neighborhood here.
Sunny Isles Beach Luxury Condo Market Summary back to top
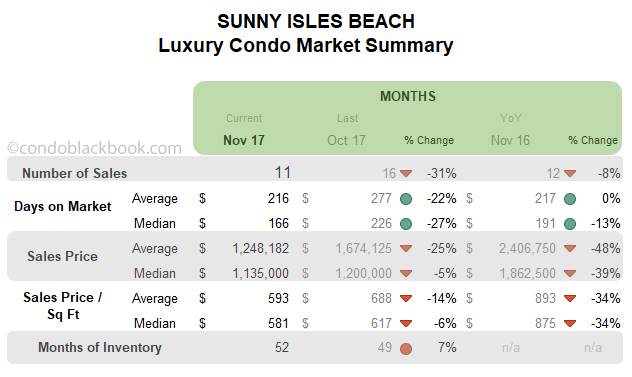
- Sales drop, but trend line stays positive. We see the sales figures declining 31% month-on-month and 8% year-over-year in Sunny Isles Beach. However, a positive trend line in fig. 9.1.1 shows that progress isn’t lost in this beach town.
- Days on market recede. Another positive sign for the neighborhood, we have the median days on market decline 27% month-on-month and 13% year-over-year.
- Prices adjust lower. Even though Sunny Isles Beach had a single ultra-luxury sale (above $2 million) to report this month, we see the prices decline. The median price is down 5% since October and the price per sq. ft. is also down 6%. (See fig. 9.3 and 9.4 below.)
- Months of inventory up 7%. Fig. 9.5 reports 52 months of inventory for the neighborhood (850 active listings + 23 pending divided by an average of 17 deals a month). This is one of the highest inventory levels in our study, and way off the 9-12 month mark of a balanced market. This means buyers still have the leverage to strike good deals by searching Sunny Isles Beach condos for sale here, or can explore the lifestyle of this branded condo corridor here.
Coconut Grove Luxury Condo Market Summary (33133 zip) back to top
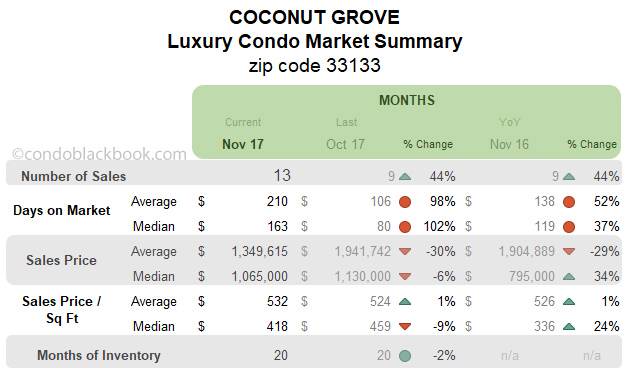
- Sales and trend line soar higher. One of the few neighborhoods to report an increase, we see 44% higher sales compared to last month and last year. Knowing that we had the usual 30% of ultra-luxury sales this month too, this boost can be attributed to the luxury segment (between $600,000 and $2 million). This uptick has further helped maintain the positive trend line in fig. 10.1.1. Coconut Grove has previously been the early bird of recovery in our studies; perhaps this month’s numbers echo the same.
- More luxury segment sales deflate prices. We see the median price and price per sq. ft. drop 6% and 9% respectively compared to last month. As mentioned above, since the number of ultra-luxury sales remains the same, we see the charts moving towards the price range of the luxury segment. (See fig. 10.3 and 10.4 below.)
- Months of inventory decline 2%. Being the fastest selling district on our study, a decline in months of inventory comes as no surprise. Fig. 10.5 shows 20 months of inventory on the market (215 active listings + 19 pending divided by an average of 12 deals a month). The decline comes in spite of active listings increasing from last month’s 211. This vibrant neighborhood is also the closest to reaching its ideal 9-12 months of inventory. You can see what’s new by searching Coconut Grove condos for sale here, or check out what lifestyle makes this the fastest selling neighborhood here.
Greater Downtown Miami Luxury Condo Market Summary (33129, 33130, 33131, 33136, 33137 zips) back to top
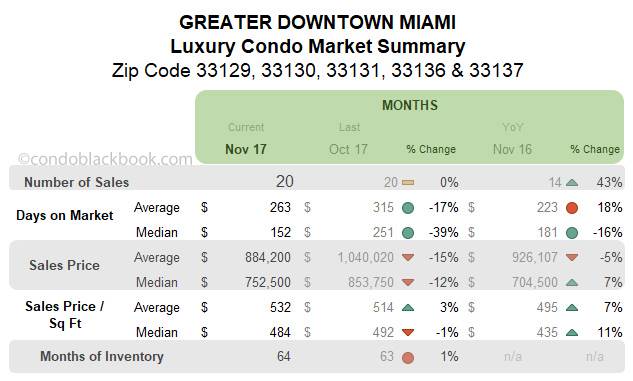
- Sales improve year-over-year with a positive trend line. The Greater Downtown Miami area reports a positive sales scenario this November. While there is no change in the monthly numbers, we see a 43% increase over last year. We also see a positive trend line in fig. 11.1.1 below, which shows that this dynamic neighborhood is keeping the progress it has made so far.
- Days on market dip for the better. Another positive trend, we see the median days on market decline 39% month-on-month and 16% year-over-year.
- Prices drop slightly. We have the median price drop 12% over last month and price per sq. ft. is also down 1%. The median price per sq. ft. was down to $484 for November. (See fig. 11.3 and 11.4)
- Months of inventory inch up again. Fig. 11.5 shows a higher months of inventory sitting at 64 (1325 active listings + 33 pending divided by an average of 21 deals a month). This is one of the highest inventories in our study and way off the 9-12 months normal. This opens up a big window for buyers to look into the Greater Downtown Miami area here for deals.
Edgewater + Midtown + A&E District Luxury Condo Market Summary (33132 + 33137 zip) back to top
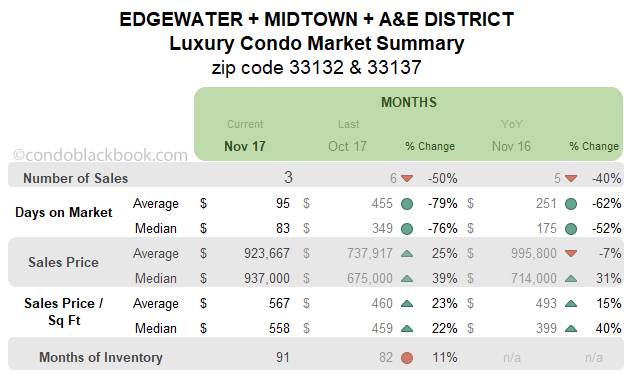
- Sales, trend line and days on market decline. From a spike last month, this grouping has gone to reporting lower numbers in November. The sales are down 50% since last month and 40% lower compared to last year. This impacts the trend line in fig. 12.1.1, making it tip lower. However, the days on market have reduced to report a positive. We see a 76% decline in the monthly median days and 52% decline year-over-year in fig. 12.2 below.
- Prices post an uptick. The price range for this grouping has inched higher. We see a 39% increase in the median price over last month and a 31% increase over last year. Even the median price per sq. ft. is 22% higher than last month and 40% more than last year. (See fig. 12.3 and 12.4 below.)
- Months of inventory leap up 11%. After months of inventory hovering around the 70s, we see inventory matching the highs at the beginning of this year. Fig. 12.5 puts the months of inventory at 91 (459 active listings + 11 pending divided by an average of 5 deals a month). Not only is this way off the 9-12 month mark of a balanced market, this also becomes the slowest moving district in our study. However, buyers have quite the opportunity as they search for Edgewater condos for sale here or see the individual lifestyle and condo options in Edgewater, Midtown and Arts & Entertainment District.
Brickell Luxury Condo Market Summary (33129, 33130, 33131 zip)back to top
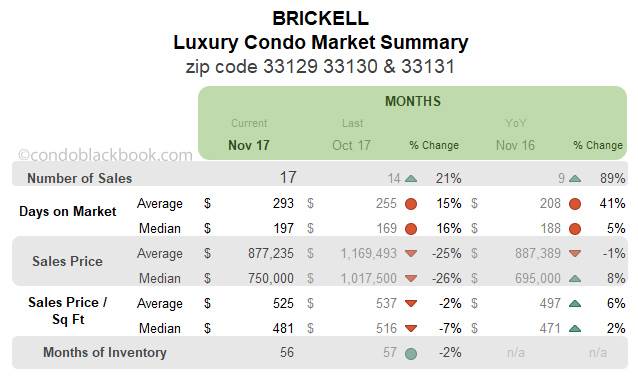
- Sales pick up pace and so does the trend line. November closes 21% higher than October and 89% higher compared to the same month last year. This a great sign for the financial district. Even the trend line in fig. 13.1.1 soars higher. Again, this boost is owing to sales mostly in the luxury segment ($600,000 to $2 million), since ultra-luxury sales (above $2 million) remained limited here.
- Prices adjust lower. Again, more luxury sales bring the charts closer to the segment’s practical pricing. We see a 26% drop in the monthly median price, and 7% decline in the price per sq. ft. (See fig. 13.3 and 13.4 below.)
- Months of inventory decrease 2%. Fig. 13.5 reports lower months of inventory at 56 (866 active listings + 22 pending listings divided by an average of 16 deals a month). This is still much higher than the 9-12 months of a balanced market. With ample choices on hand, buyers should take a look at Brickell’s lifestyle options or directly search Brickell condos for sale here
Coral Gables Luxury Condo Market Summary back to top
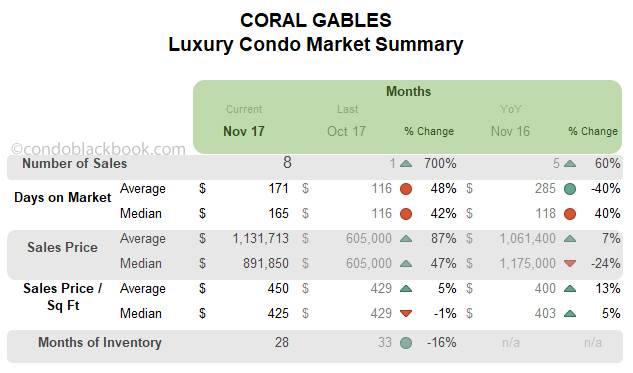
- Record sales post uptick, but trend line descends. For the first time since February, Coral Gables has reported such a strong sales number. It is not only higher than last month, but also same time last year. Since this is a rather small and volatile market, the metrics above show drastic changes in percentage. However, November’s fantastic performance still could not save the trend line from tipping downward in fig. 14.1.1.
- Months of inventory drop 16%. Fig. 14.5 reports 28 months of inventory in Coral Gables (108 active listings + 18 pending, divided by an average of 5 deals a month). This is again off the 9-12 month mark of a balanced market. With ample variety sitting on the market, buyers could gain by checking out the lifestyle options in Coral Gables, or directly search Coral Gables condos for sale here.
Conclusion back to top
Buyers should make haste, as a strong winter is expected. While some neighborhoods struggled, some posted an uptick in sales this November. Inventory levels are still high, so we have a market largely favoring buyers. However, with winter approaching, we expect pent up demand, snowbirds and the Art Basel crowd to fuel a full-scale recovery. If such is the scenario, buyers would want to use their edge while they have it.
Love what you see? Don’t forget to share our blog and subscribe (see the subscribe link on the top menu) to receive the latest market news in your inbox.
Have any questions? Or see something wrong with the stats? Please contact Sep at sniakan (at) hbroswell.com or call 305-725-0566.
Share your thoughts with us

Your Miami Condo Awaits
Recent Posts


 (305) 697-7667
 (786) 321-7233
  contact@condoblackbook.com

