Luxury Miami Condo Report : Oct 2017

Nov 26, 2017 November 26, 2017
Miami Luxury Condo Report Overall Market Summary
City and Neighborhood Luxury Condo Reports
Miami Beach Luxury Condo Report
South Beach Luxury Condo Report
Bal Harbour Luxury Condo Report
Sunny Isles Beach Luxury Condo Report
Greater Downtown Miami Luxury Condo Report
Edgewater / Midtown / A&E District Luxury Condo Report
Coconut Grove Luxury Condo Report
Coral Gables Luxury Condo Report
Miami Luxury Condo Market Report: Summary back to top
The month of Halloween reports some non-scary numbers for our market. And, with ‘winter on the beach’ plus Art Basel approaching, we expect more vacationers (read prospects) to turn up on our warm, sunny shores. Read on for more insights and predictions in our October report for Miami’s luxury condo market.
For the purpose of this luxury condo report, we have only considered properties priced $600,000 and above.
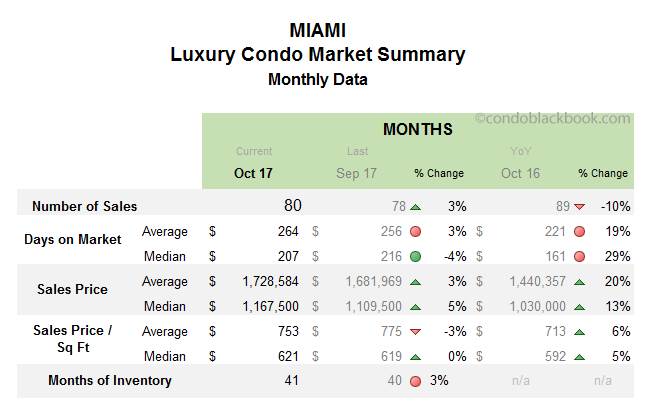
Overall Market Highlights:
- Most neighborhoods and overall sales post an increase, hinting on a strong winter
- Overall median days on market decline 4%, but 29% higher than last year
- Overall luxury prices lower, but ultra-luxury sales (above $2 million) keep numbers inflated
- Most neighborhoods report an increase in months of inventory
- Buyers still control the market, though a strong winter could initiate a change of trends
Increase in sales posts a peek into days ahead. Like we had mentioned in our September report, we are expecting a strong late fall and winter to pick up the luxury condo market. Subtle signs of this pick up are visible in October’s numbers, as most neighborhoods have reported an increase in sales activity. We expect this momentum to carry through this last quarter and really show up strong by the first quarter of 2018.
Days on market continue upward trend. Most neighborhoods in our study report an increase in the median days on market. This trend started in August and has continued through to October. If sales pick up as expected, we hope to look at a reversal of this trend.
Lower prices on luxury condos not reflected in charts. We have been noticing that the luxury condo segment (below $2 million) has lowered its prices to realistic levels. However, most charts below report an increase in prices. This contrast is mainly due to a handful of ultra-luxury sales (above $2 million) in each neighborhood inflating numbers. Irrespective, we do expect the prices to further decline and accommodate the buyer’s market.
Inventory shifts up a notch to accommodate new listings. This month, we see most of the neighborhoods posting an increase in their months of inventory. However, a deeper analysis reveals that this uptick is not due to a lack of sales, but rather a sudden influx of new listings. A strong winter could definitely help clear this rush sooner.
Overall, we see a market that’s finding its footing. If this winter plays out as expected, we could be in for a turn of events.
Where Does the Market Go From Here? back to top
In previous reports, we’ve discussed at length how a strengthening U.S. dollar, strong stock market, the 2016 Zika scare, shaky start to the presidency and a desire for tax breaks by the wealthy have been holding back sales numbers and brought the current condo market to favor buyers.
However, we expect the following to change this trend and bring the market back in balance:
- Art collectors stop to shop for more. Art Basel is just around the corner and so are the Holidays. It is that time of year when the global elite and vacationer’s spotlight will be turned on Miami. So, it is quite expected that people who come to buy art or spend Christmas on the beach could end up sticking around to pick up a second home.
- Tax breaks. President Trump has already announced that tax breaks are on the horizon. However, how many of these come to benefit the real estate community will have a major impact on how the market fares.
- Pent up demand from Irma returns. We are still looking forward to the deals and prospects to come through that were affected by Irma’s sudden outburst. With the weather moving towards pleasant respite, we expect this positivity to rub off on the numbers next month.
- Sellers continue being flexible. While the charts in our study tell a different story due to ultra-luxury sales, we have noticed that the luxury segment (below $2 million) has kept its pricing realistic. If sellers continue being flexible, they can really gain during the strong winter we expect.
Below is an insight into Miami’s overall and neighborhood-level luxury condo trends for the month of October 2017:
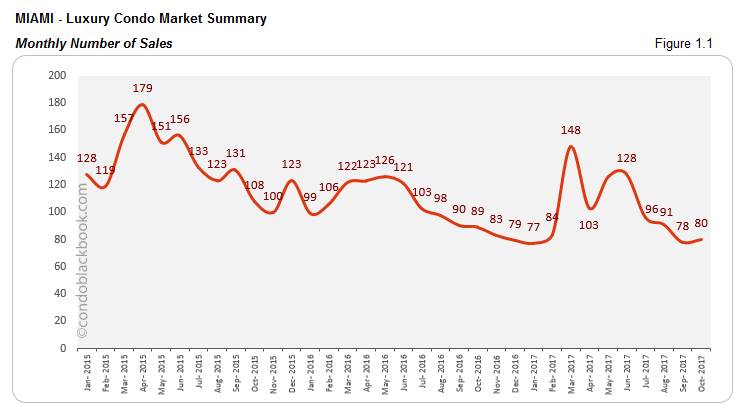
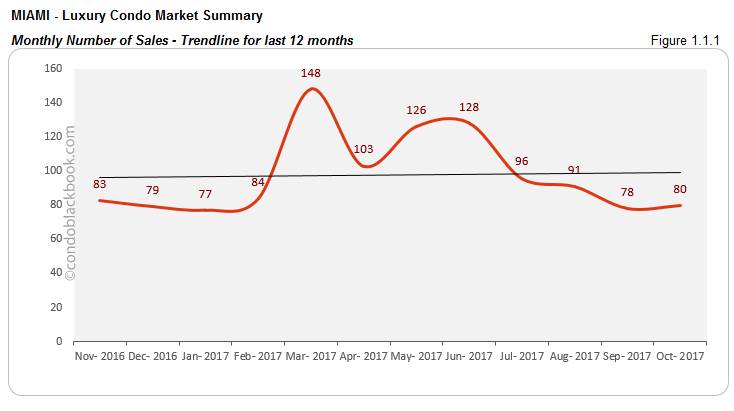
Monthly Number of Sales - Miami Luxury Condo Market Overall back to top
- Slight uptick in sales, early signs of a strong winter. Fig. 1.1 shows how the overall luxury condo market is trying to get back on its feet. The market’s posted a 3% improvement in sales since September. However, numbers are 10% short of sales compared to October last year. Considering there is still pending demand from Irma’s unexpected hit and winter on the beach drawing back globetrotters, the market is looking forward to an early recovery this year.
- Trend line keeps upward trend. With most neighborhoods posting an uptick in sales this October, we see that the overall trend line (fig. 1.1.1) has managed to sustain its positive curve. This suggests that even though sales have yo-yoed over the last 12 months, the market is not as bleak as some would imagine.
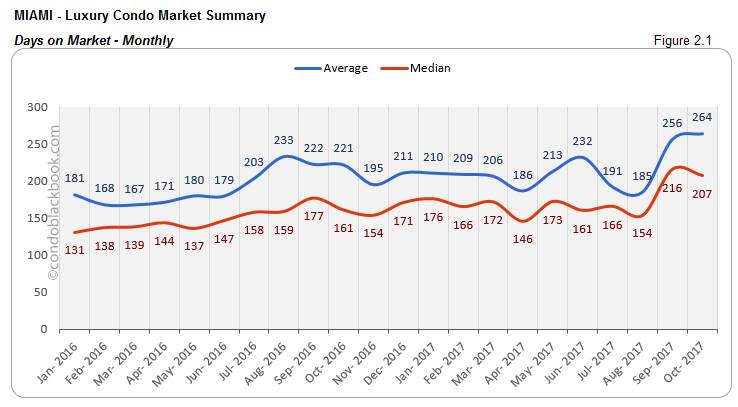
Days on Market - Miami Luxury Condo Market Overall back to top
“Days on market” are the total number of days from when a property is active to the day it goes under contract.
- Median days on market decline, suggest market positivity. In fig. 2.1, we see the median days on market decline 4% compared to September. This again is a positive sign, which means that buyers are still shopping and properties are getting off the market. However, looking into October last year, there is a lag of 29% suggesting the need for enhanced buyer motivation.
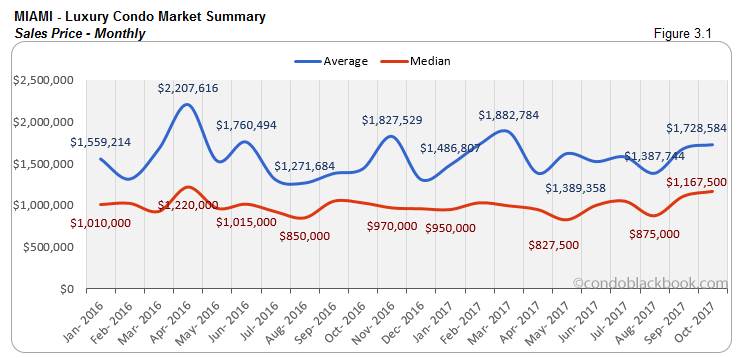
Sales Price Trends - Miami Luxury Condo Market Overall back to top
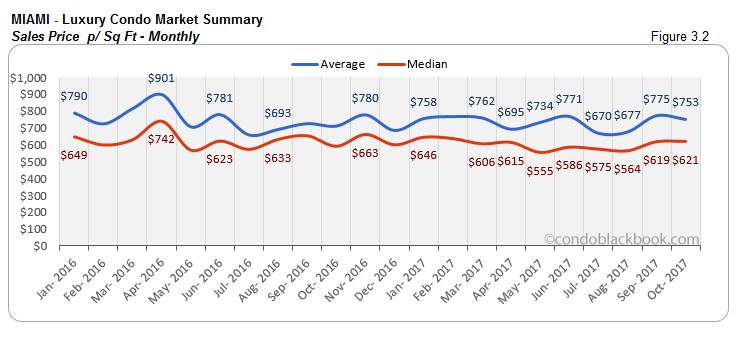
- Overall prices hold ground as luxury segment rolls back. We see the overall sales price (fig. 3.1) and price per sq. ft. (fig. 3.2) hover in October. We have prices being fairly consistent, with the median up only 5% since September and 13% year-over-year. Also, there is just a 5% year-over-year increase in the price per sq. ft. However, what’s essential to note here is that ultra-luxury sales (above $2 million) are the key reason behind this uptick in prices and not the luxury segment. On the contrary, the luxury segment has kept pricing realistic, also lowering them to keep buyers coming.
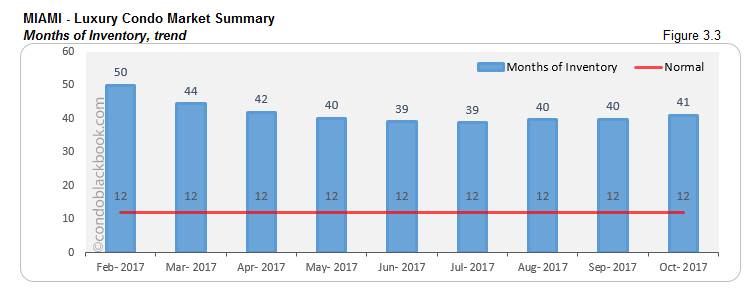
Inventory Trends - Miami Luxury Condo Market Overall back to top
A balanced market will only have 9-12 months of inventory.
- Months of inventory inch up with influx of listings, buyers should take note. Fig. 3.3 shows the months of inventory at 41 (3936 active listings + 160 pending listings divided by last six months’ average sales of 100). This is 3% higher than September and much higher than the 9-12 months of a balanced market. However, what’s important to note here is that this increase is not because the average sales have dropped, but actually thanks to an influx of luxury condos. (In fact, September averaged at 99 deals a month, while October is registering a higher average of 100.) While it may take a while for the market to regain its balance, buyers can definitely have their pick of the litter in the meantime.
City and Neighborhood Market Reports back to top
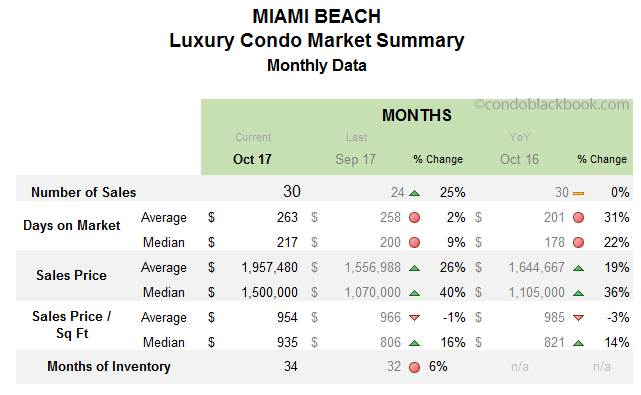
Miami Beach Luxury Condo Market Summary back to top
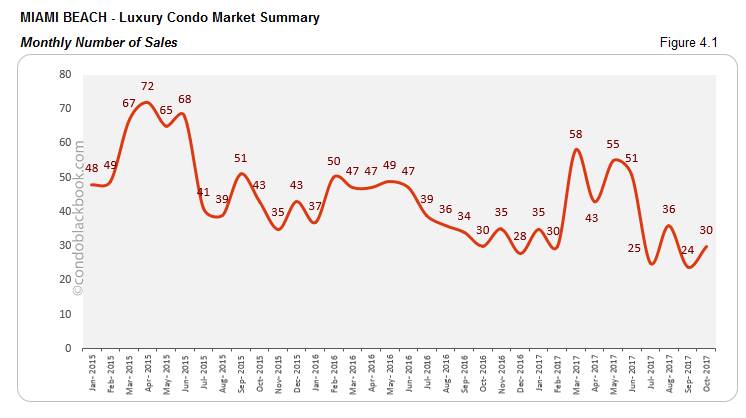
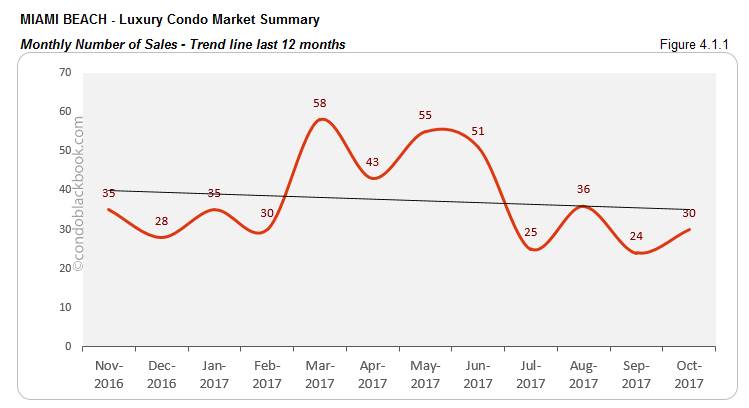
- Sales post increase, though trend line dips. As expected, the market is catching up after Irma’s hiatus, posting a 25% increase over September and matching last year’s numbers. However, with the last couple of months lagging, we see a slight dip on the 12-month trend line (fig. 4.1.1). But, we do hope for a quicker recovery as winter sets in and Art Basel crowd takes over the neighborhood.
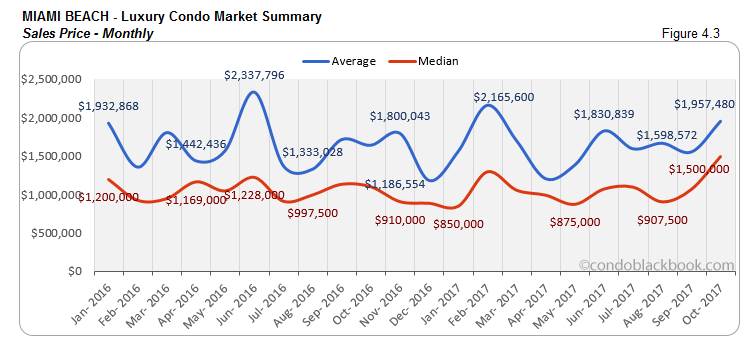
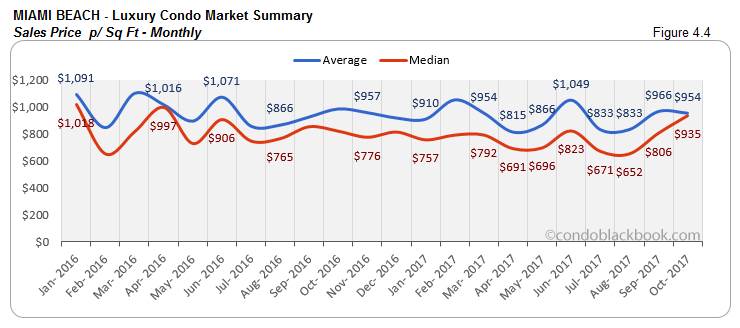
- Prices push up with ultra-luxury deals. In spite of noticing a decline in prices in the luxury condo market, we see fig. 4.1 posting a 36% year-over-year increase in the median sales price and a 14% year-over-year increase in the price per sq ft (fig. 4.4). The fact that 10 out of 30 sales in Miami Beach were ultra-luxury (above $2 million) is what’s pushing up prices, even though luxury condos are being priced modestly.
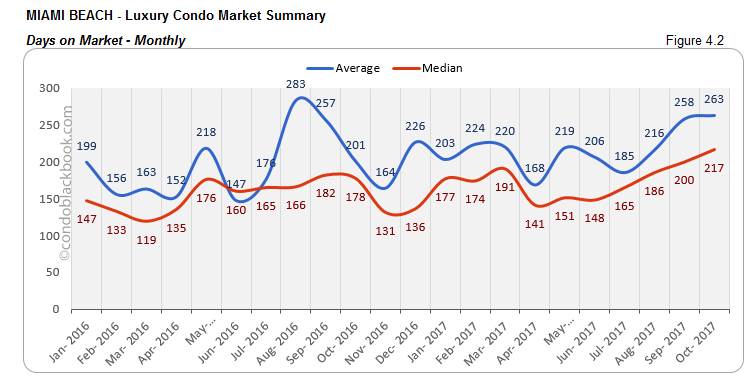
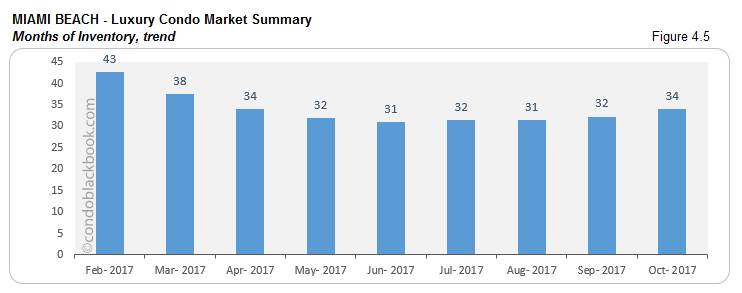
- Months of inventory hit minor setback with 6% increase. Miami Beach posts 34 months of inventory for October in fig. 4.5 (1195 active listings + 60 pending divided by an average of 37 deals a month). While this is just 6% higher than September, it is much higher than the 9-12 months of a normal market scenario. We even see an increase in the median days on market (fig. 4.2). This makes it easier for buyers to shop for their choice of Miami Beach condos for sale here.
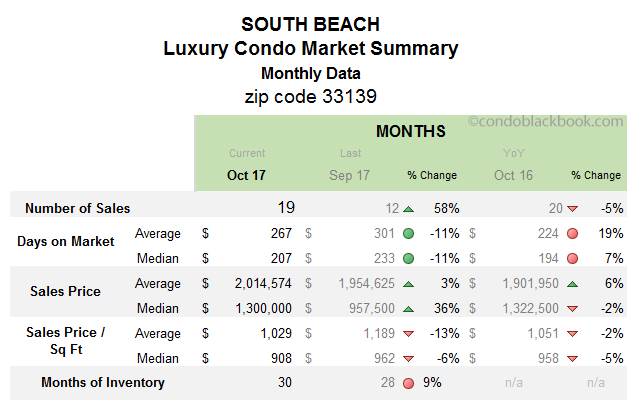
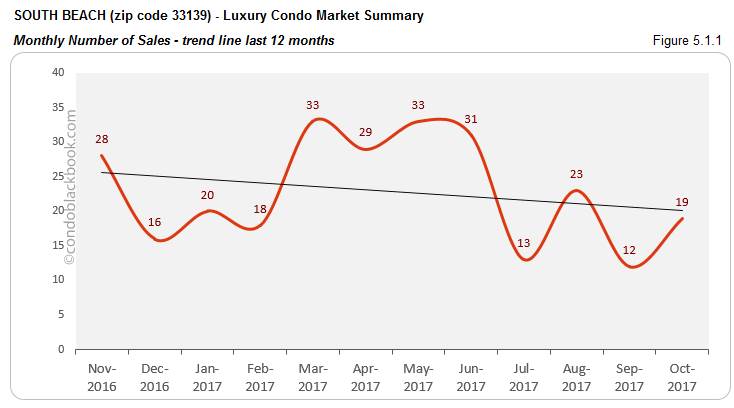
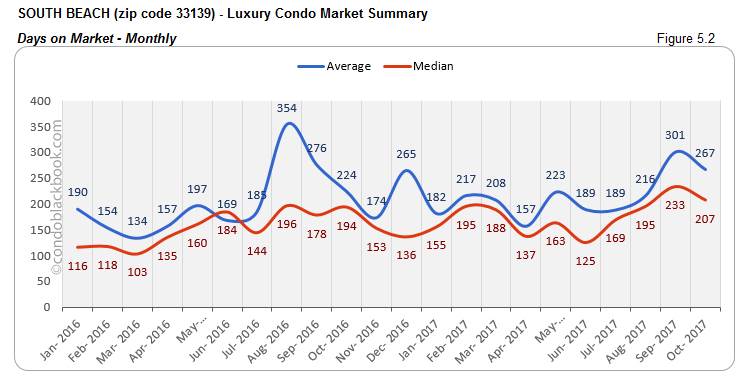
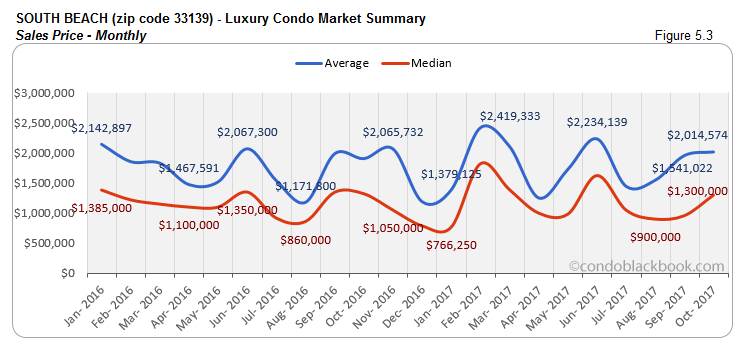
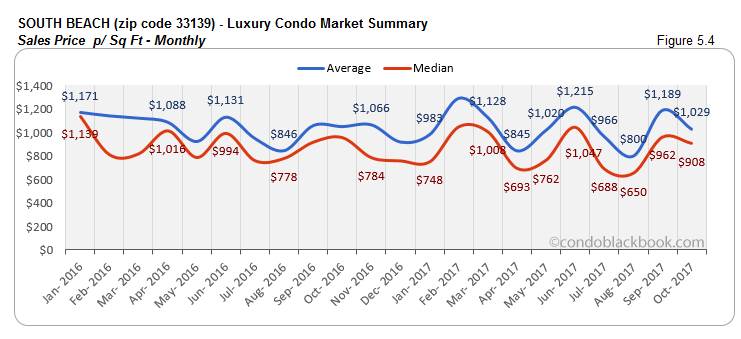
South Beach Luxury Condo Market Summary (33139 zip) back to top
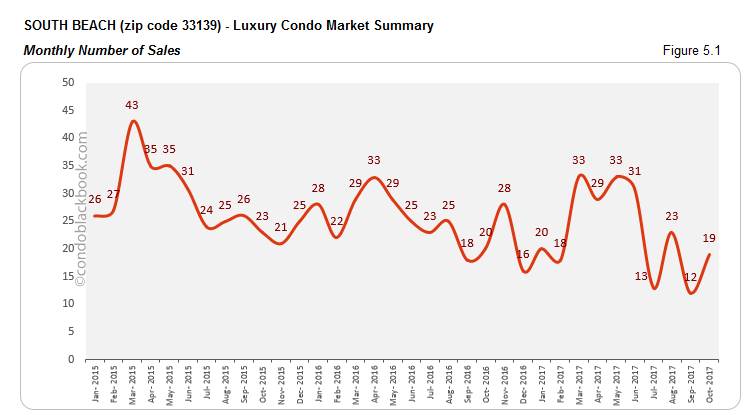
- Sales make a swift comeback, but not enough to keep trend line up. After seeing a sharp decline in last month’s sales, South Beach is back with a 58% increase this month (fig. 5.1). But, this vacationer’s paradise still struggled to keep up with last year’s performance, posting a 5% decline year-over-year. This becomes even more evident with the trend line (fig. 5.1.1) dipping downward. However, we expect an earlier recovery with Art Basel bringing in global elite and snowbirds to the neighborhood’s sunny shores.
- Price per sq. ft. down 6%. Although the sales price may have posted an uptick (fig. 5.3) this month, we do see a 2% decline year-over-year. Also, the median price per sq. ft. (fig. 5.4) has come down to $908/sq ft. This is 6% lower than last month and 5% lower year-over-year. This makes a great incentive for buyers to search for South Beach condos for sale here, or at least check out the popular beach destination here.
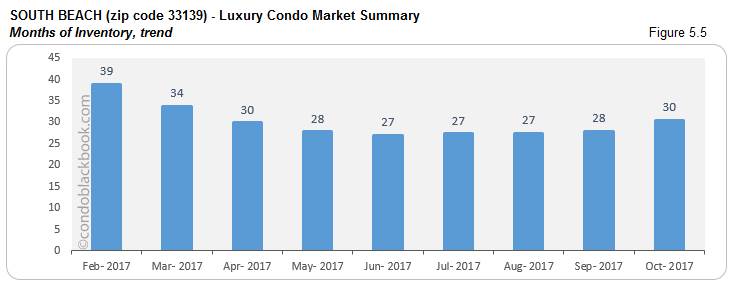
- Months of inventory nudge higher. We see the months of inventory nudge up 9% in fig. 5.5 to reach 30 (640 active listings + 24 pending divided by an average of 22 deals a month). This is again far off from the 9-12 months of a balanced market. Although we cannot rule out the signs of movement, as the days on market have come down 11% since September (fig.5.2).
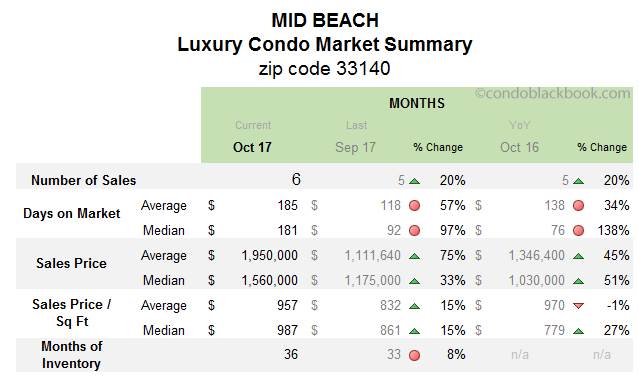
Mid-Beach Luxury Condo Market Summary (33140 zip) back to top
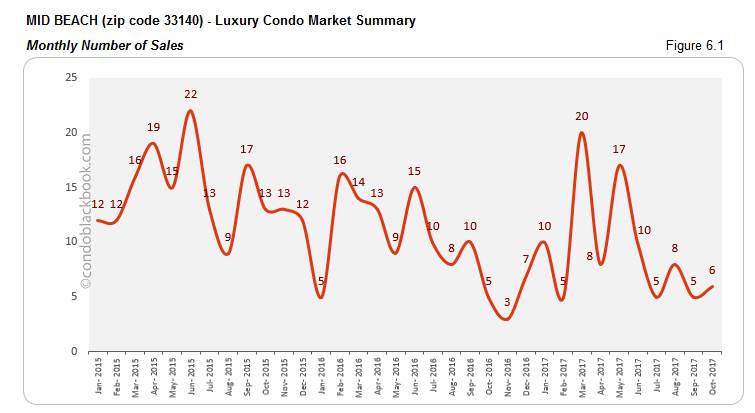
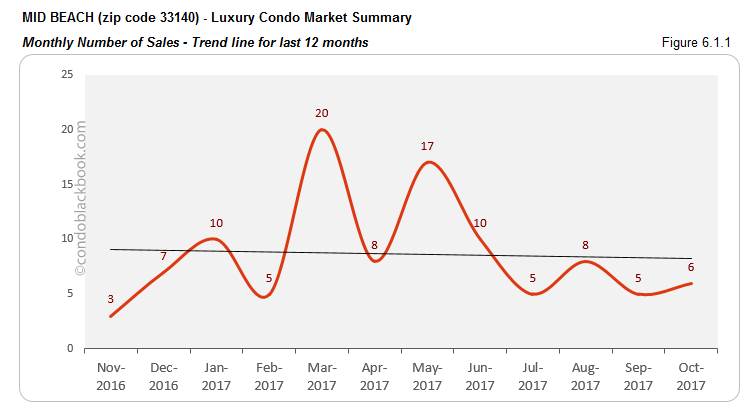
- Sales improve year-over-year. The scene is pretty upbeat in Mid-Beach with the neighborhood posting a 20% increase in both monthly and yearly sales figures this October (fig. 6.1). However, the trend line (fig. 6.1.1) does post a decline owing to sluggish sales these past couple of months. A strong winter should turn things around soon enough.
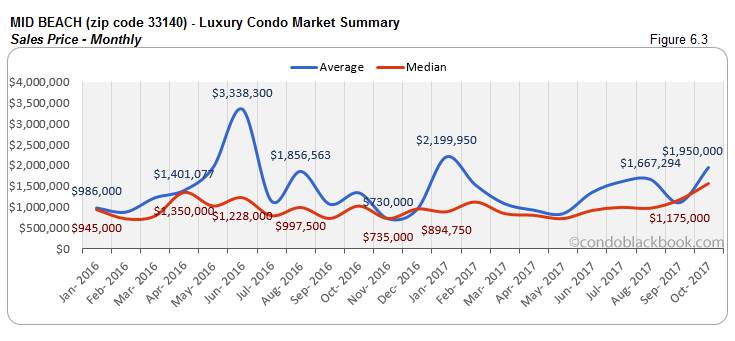
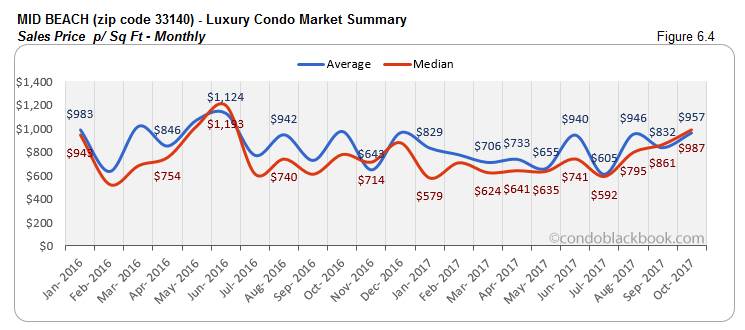
- Prices hike to accommodate ultra-luxury deals. Ultra-luxury sales have fueled the market in Mid-Beach since July. This is now showing up with the median sales price leaping 51% year-over-year and 33% month-on-month (fig. 6.3). We also have the price per sq ft rise 27% from last year to reach $987/sq ft (6.4). Again, like most neighborhoods in our study, the prices for luxury condos have come down, but ultra-luxury sales (above $2 million) keep up inflation.
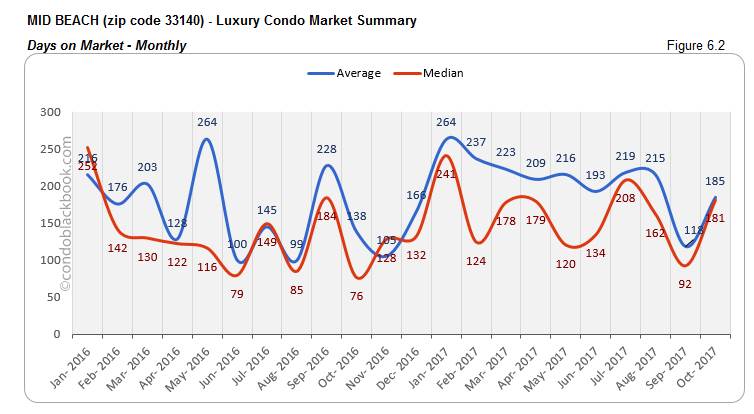
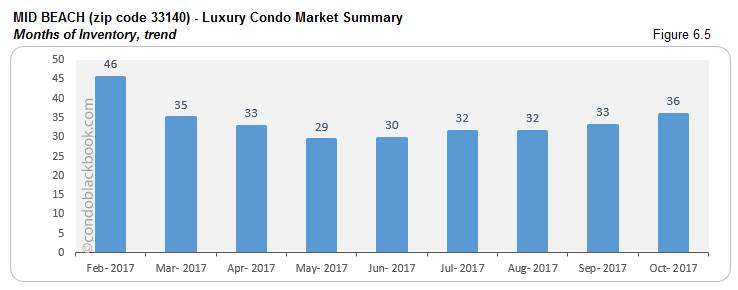
- Months of inventory creep higher. We see the months of inventory for October sitting at 36 (287 active listings + 18 pending divided by an average of 9 deals a month). This is definitely higher than May’s low of 29 months (fig. 6.5), and way off the 9-12 months mark of a balanced market. We also see the days on market hike up 97% (fig. 6.2). With newer condos adding to inventory and older listings moving out slowly, buyers should take a cue and scout for great deals on Mid-Beach condos on sale here or take a tour around this casual neighborhood here.
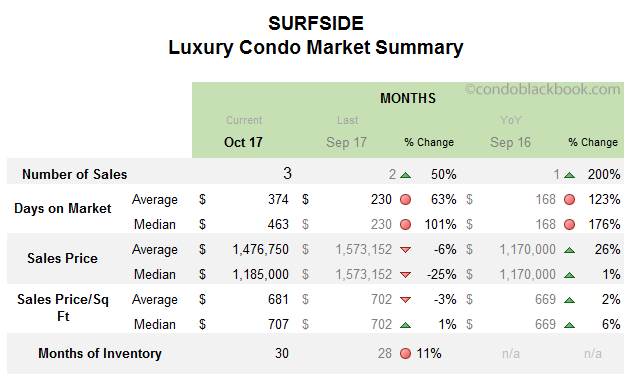
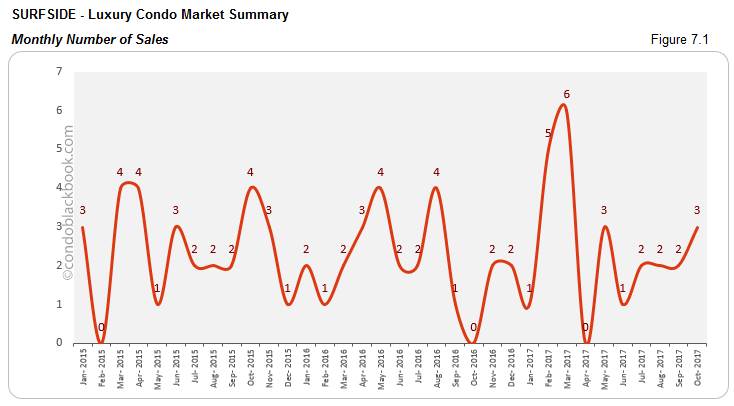
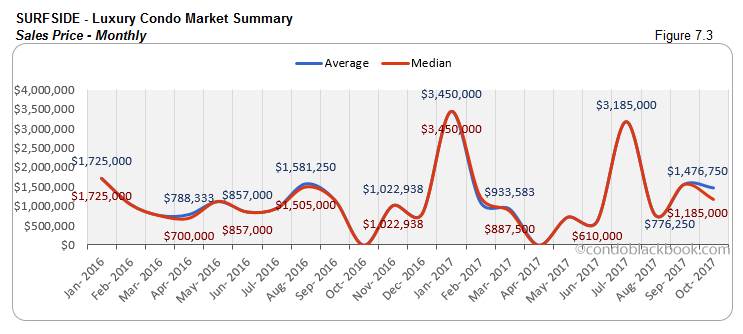
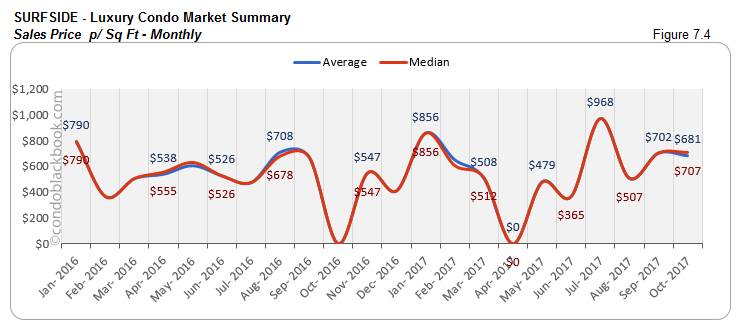
Surfside Luxury Condo Market Summary back to top
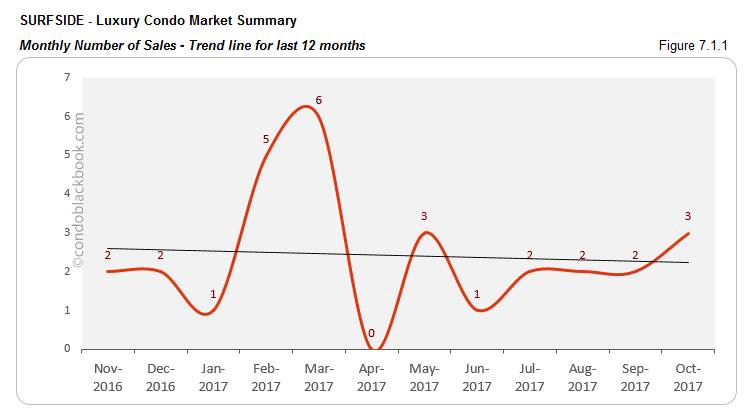
- Sales inch up, though trend line declines. The numbers look pretty impressive in Surfside as we have a 50% increase from last month and 200% increase to report year-over-year (fig. 7.1). However, a closer look reveals that an extra sale or two is all it takes to post such an astounding increase. You will also notice how the trend line dips (fig. 7.1.1), showing slower progress for the year. Since Surfside is a modest luxury condo market, such volatility in metrics is quite expected.
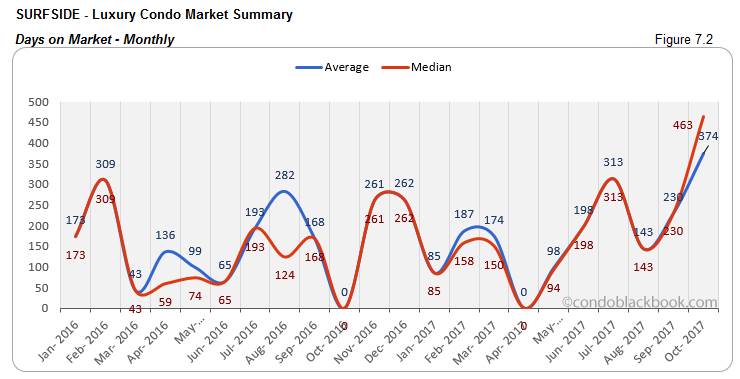
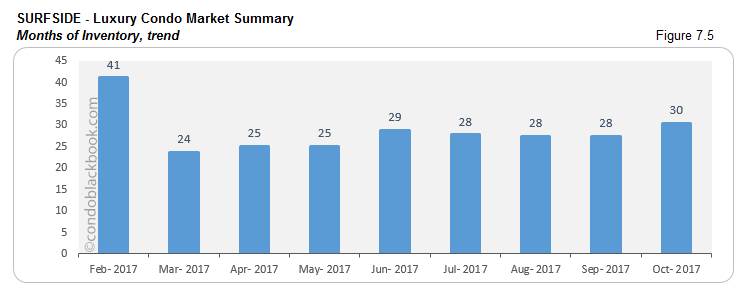
- Prices hover historically, inventory goes up, buyers should keep an eye out. Although Surfside posts a decline in its monthly prices, they are being consistent year-over-year. The price is just 1% higher compared to last October (fig. 7.3), while the price per sq ft is up only 6% (fig. 7.4). The months of inventory is currently at 30 (63 active listings + 3 pending divided by an average of 2 deals a month). This is 11% higher than last month and way off the 9-12 months of a normal market (fig. 7.5). Low prices coupled with high inventory should add to buyer confidence. You can search a Surfside condo for sale here, or see what lifestyle makes up the community of Surfside for an informed decision.
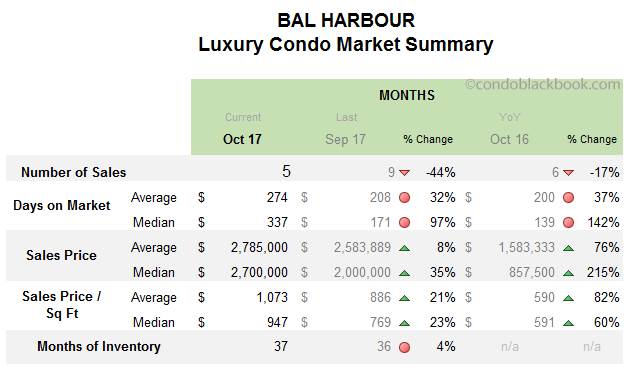
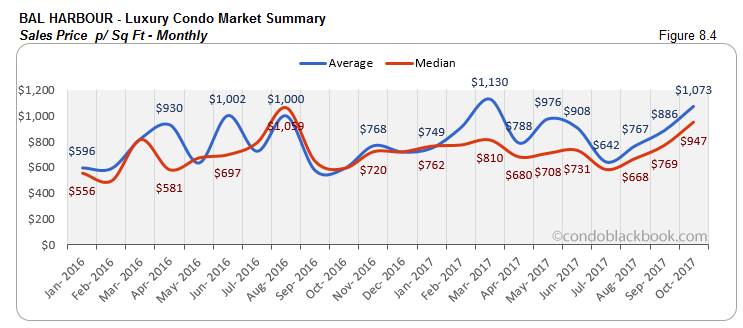
Bal Harbour Luxury Condo Market Summary back to top
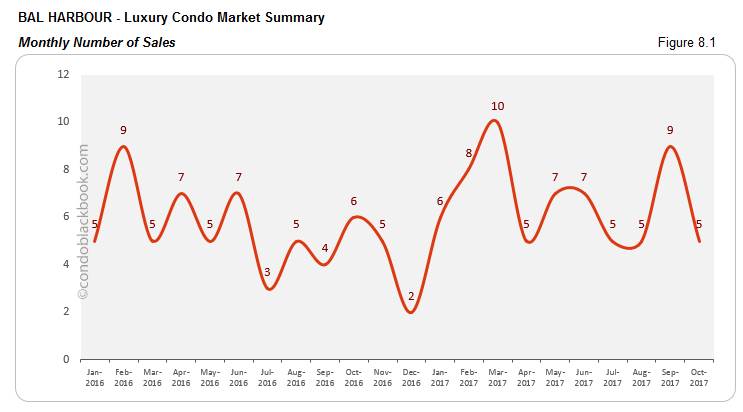
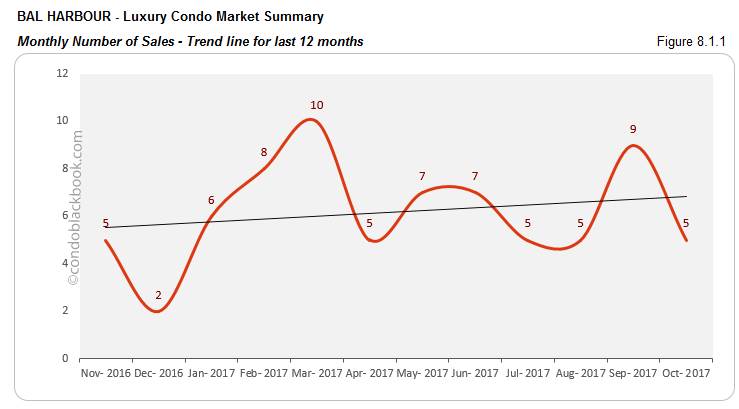
- Sales lag, but trend line unaffected. Bal Harbour is one of the few neighborhoods in our study to report negative sales. The sales not only lagged 44% compared to last month, but dropped 17% year-over-year (fig. 8.1). Thankfully, the momentum from previous months has been enough to keep up the trend line (fig. 8.1.1), reporting a positive for this ultra-chic neighborhood.
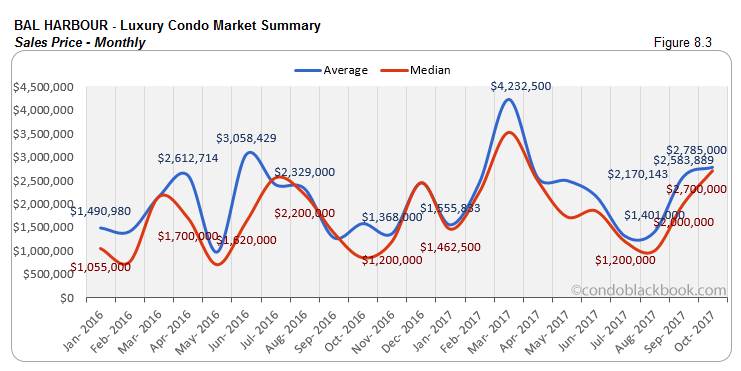
- Ultra-luxury deals make prices soar. We see a drastic uptick in sales prices for Bal Harbour this October. There is a 35% increase in the monthly median and a whopping 215% year-over-year increase (fig. 8.3). Even the price per sq ft is up 60% from last year, reaching $947/sq ft (fig. 8.4). This jump can solely be attributed to ultra-luxury sales (above $2 million). October and September posted 2 ultra-luxury sales each. Such high-priced sales are adding to the inflation we see in the charts, since the luxury segment is keeping its prices low.
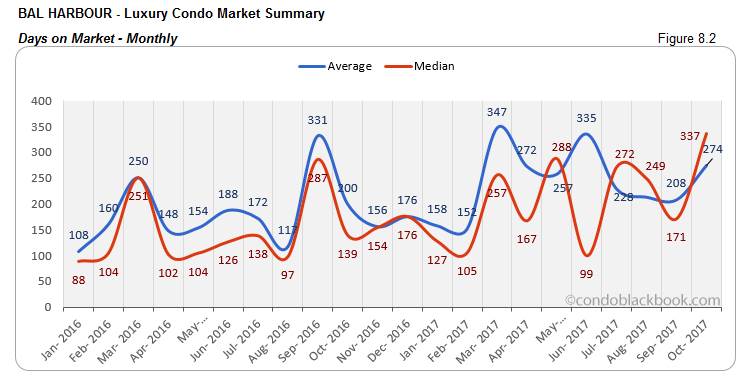
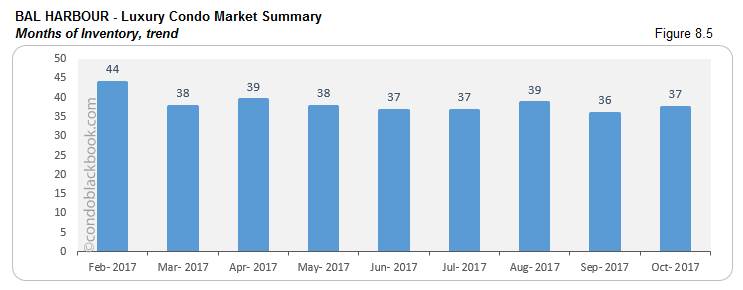
- Months of inventory and days on market move higher. The neighborhood sees a small setback with the months of inventory escalating 4% this October. Fig. 8.5 shows 37 months of inventory (228 active listings + 9 pending divided by an average of 5 deals a month). This is way off the 9-12 months of a normal market. Even the median days on market have increased by 97% over September. With plenty of condos waiting to get off the market, buyers should look into striking a good deal by searching for Bal Harbour condos for sale here or check out the upscale neighborhood here.
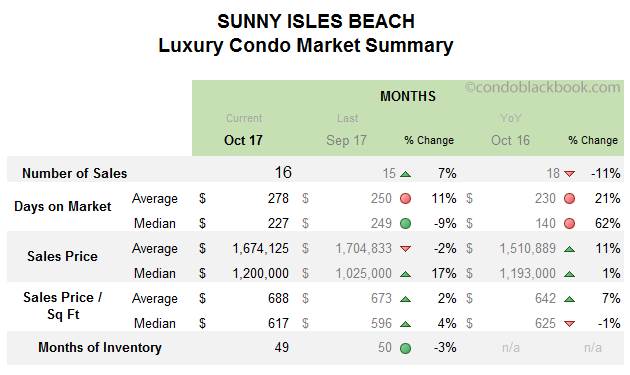
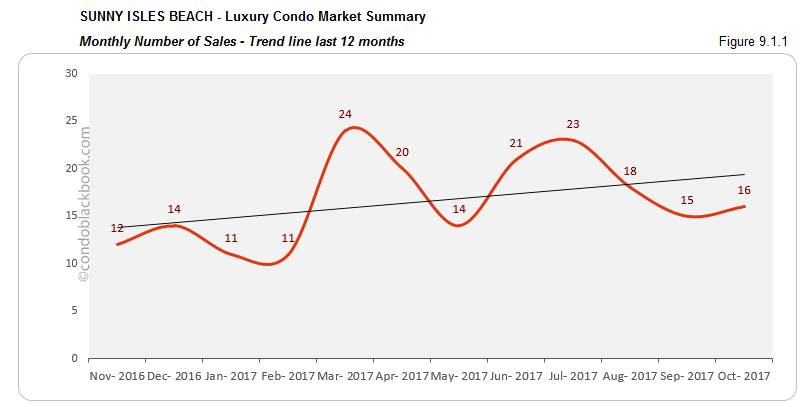
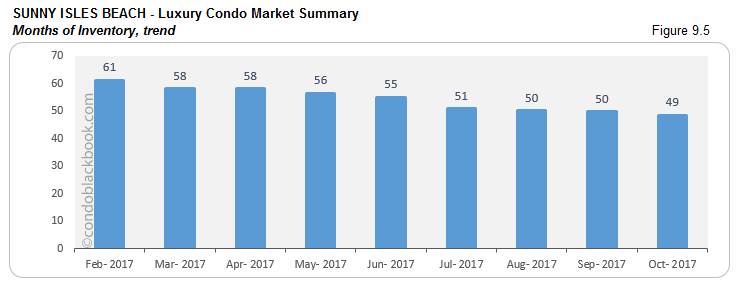
Sunny Isles Beach Luxury Condo Market Summary back to top
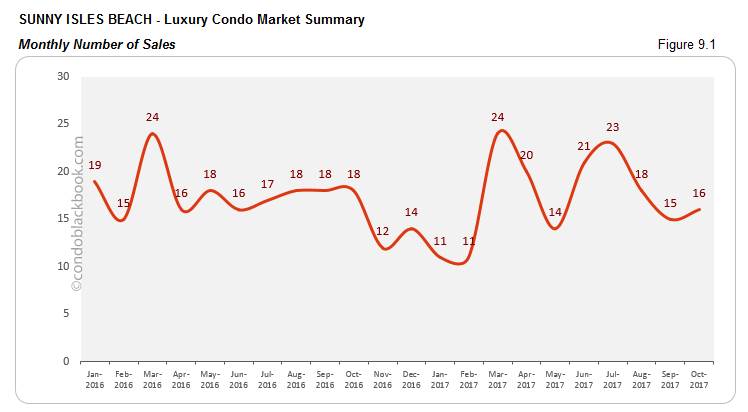
- Sales improve to keep trend line positive. After reporting a dip for two months, sales have picked up pace in Sunny Isles Beach. The brand corridor posted a 7% increase in monthly sales, but numbers still lagged 11% year-over-year (fig. 9.1). Nonetheless, the 12-month trend line is keeping its head up, showing that progress isn’t lost in this beach town (fig. 9.1.1).
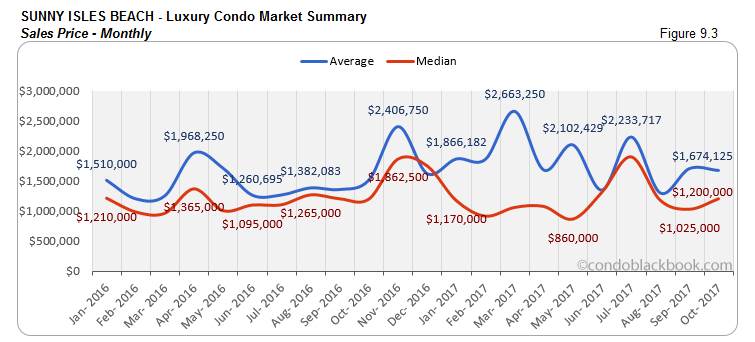
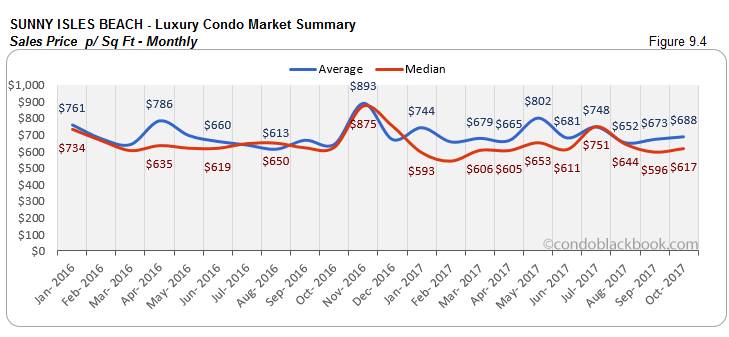
- Ultra-luxury sales cause inflation. We again see an increase in prices for Sunny Isles Beach, in spite of the luxury segment being conservative. Consistent ultra-luxury sales (above $2 million) over the past couple of months have pushed up the monthly median by 17% (fig. 9.3) and price per sq ft by 4% (fig. 9.4).
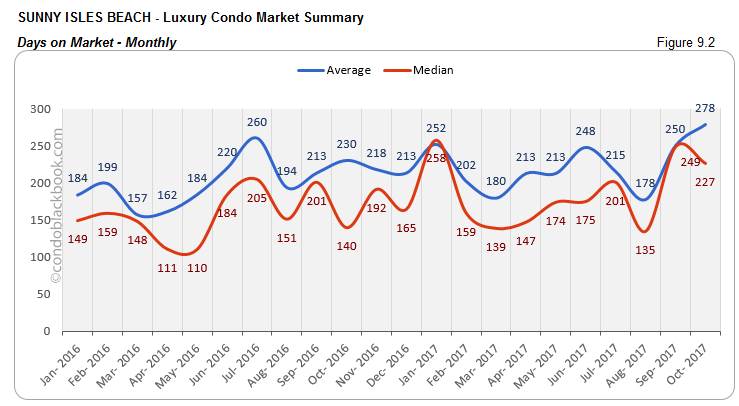
- Months of inventory down 3%. Another positive sign for the neighborhood, we see the months of inventory come down to 49 (845 active listings + 20 pending divided by an average of 18 deals a month). While this is an improvement, the figures are still off the 9-12 month mark of a normal market (fig. 9.5). This means buyers still have the margin to strike some great deals by searching Sunny Isles Beach condos for sale here, or exploring the lifestyle of this branded condo corridor here.
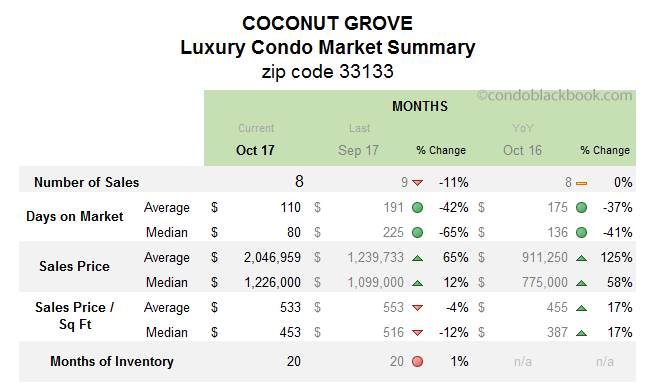
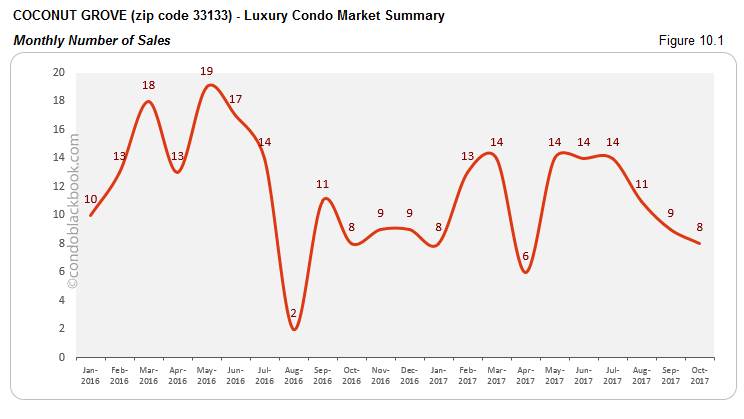
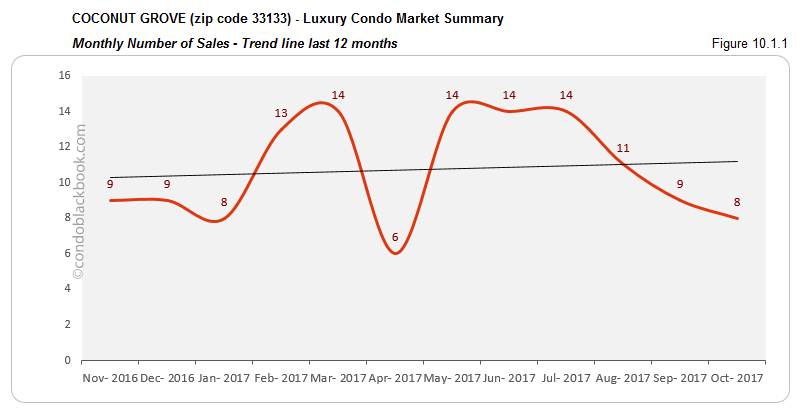
Coconut Grove Luxury Condo Market Summary (33133 zip) back to top
- Sales dip marginally, but trend line maintains incline. Fig. 10.1 reveals how the sales may have dipped a notch in Coconut Grove; however, they still match last year’s figures. This historic positivity has helped carry forward the uptick in the 12-month trend line (fig. 10.1.1).
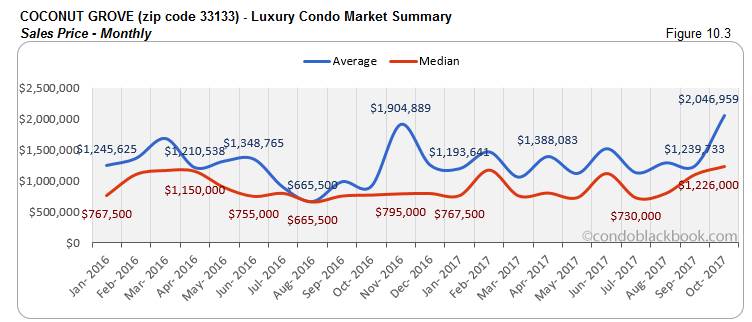
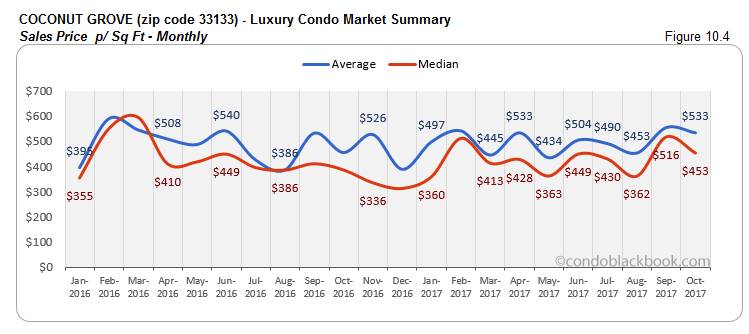
- Ultra-luxury sales push up prices. Just like most neighborhoods in our study, a couple of ultra-luxury sales (above $2 million) in the past few months have pushed up prices here as well. The median sales price has increased by 12% month-on-month and 58% year-over-year (fig. 10.3). Even the median price per sq ft is up 17% since last year (fig. 10.4). The marginal drop of 12% we see in the monthly median price per sq ft could be due to the luxury segment (below $2 million) bringing down prices to favor the buyer’s market.
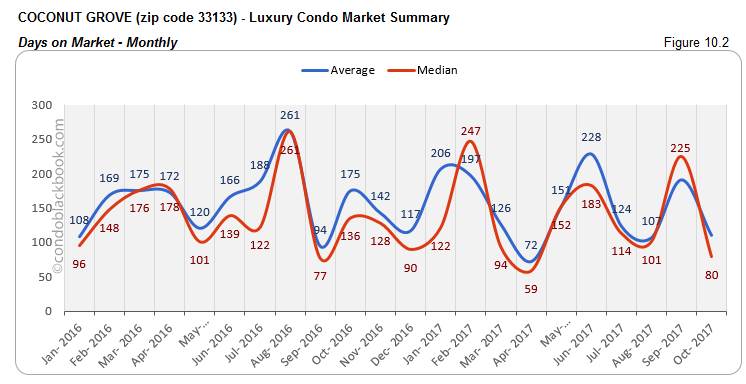
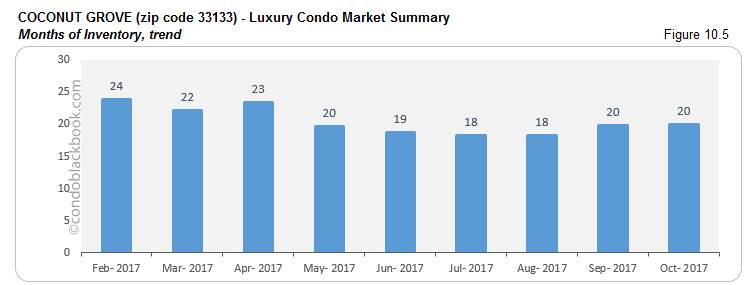
- Days on market drop, though new properties inflate months of inventory. Coconut Grove is one of the few neighborhoods in our study to report a decrease in days on market. There is a sharp 65% decline in the month-over-month median days (fig. 10.2). However, on the other hand, we have an influx of new luxury condo listings slightly pushing up months of inventory (fig. 10.5). The metric now stands at 20 months (211 active listings + 22 pending divided by an average of 12 deals a month). This vibrant neighborhood is the closest to reaching the ideal 9-12 months of inventory mark. You can see what’s new by searching Coconut Grove condos for sale here, or check out what lifestyle makes this the fastest selling neighborhood here.
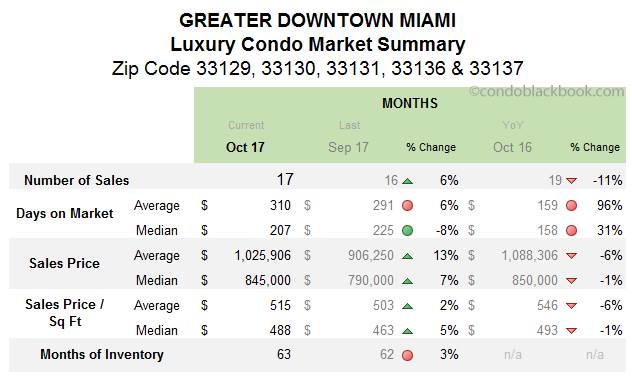
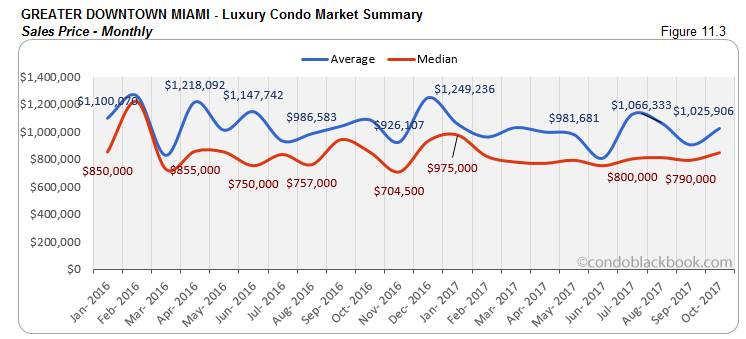
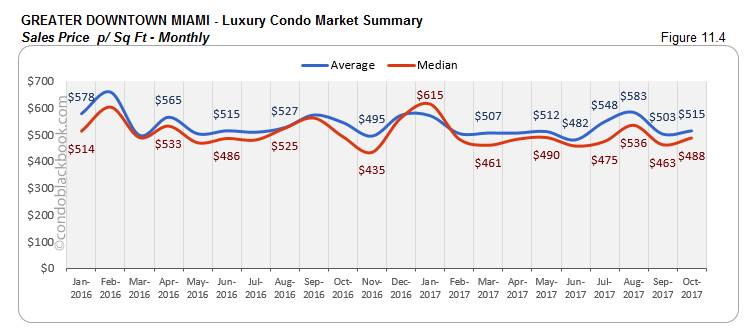
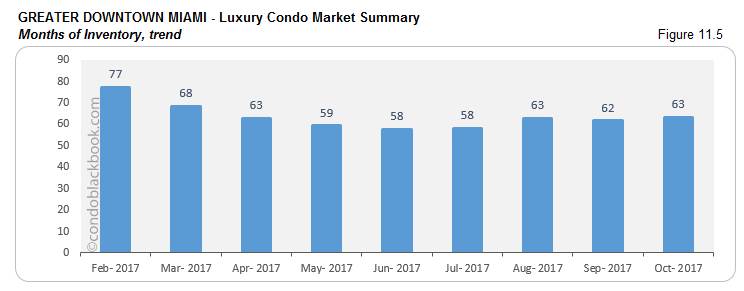
Greater Downtown Miami Luxury Condo Market Summary (33129, 33130, 33131, 33136, 33137 zips) back to top
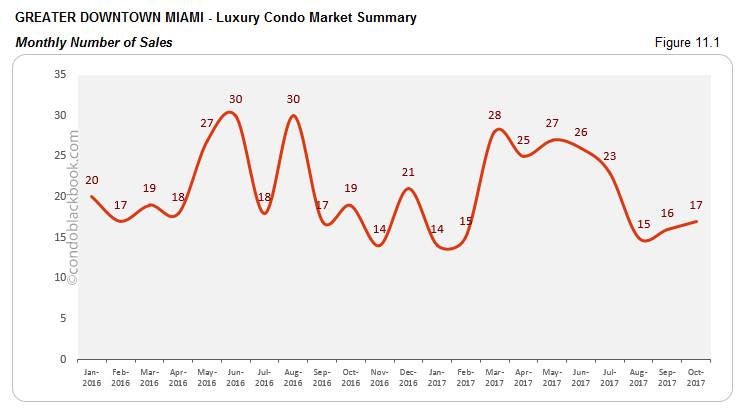
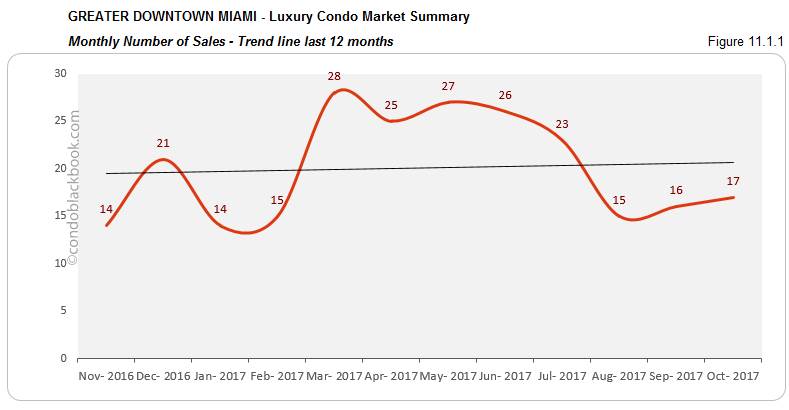
- Sales hold up with 6% increase and positive trend line. Fig. 11.1 shows a slight uptick in the monthly sales figures here, but there is also an 11% decline compared to October last year. Nonetheless, the 12-month trend line continues its upward trek, reporting a positive sales situation for this dynamic neighborhood.
- Ultra-luxury deals fuel uptick in prices. Although the luxury segment has been rolling back prices, we see an uptick in fig. 11.3. This inflation is mostly powered by ultra-luxury deals (above $2 million). So, we see the monthly median price move up 7% (fig. 11.3) and the price per sq ft go up 5% (fig. 11.4). However, since both the price and price per sq ft are still lower compared to last year, buyers should look into the Greater Downtown Miami area here for deals.
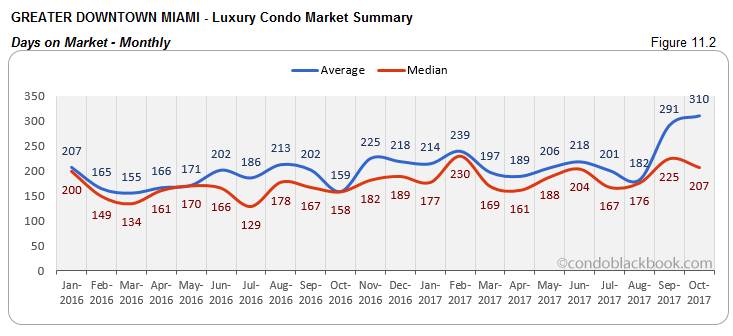
- Months of inventory inch back up with lower days on market. After a decline last month (fig. 11.5), the months of inventory are back to 63 (1289 active listings + 22 pending divided by an average of 21 deals a month). This is significantly higher than the 9-12 month normal of a balanced market. On the other hand, we also see an 8% decline in the median days on market (fig. 11.2). This contrast in metrics could be due to an influx of new properties, while the sales momentum stays the same.
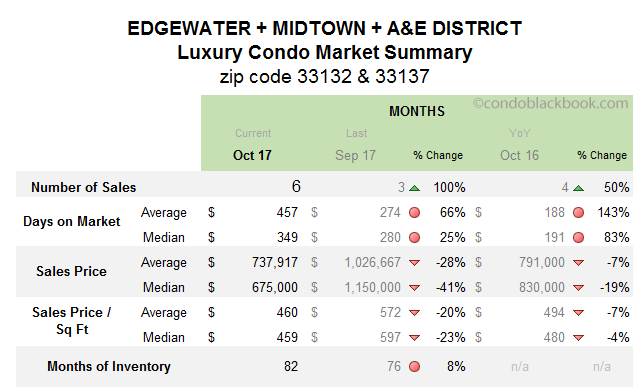
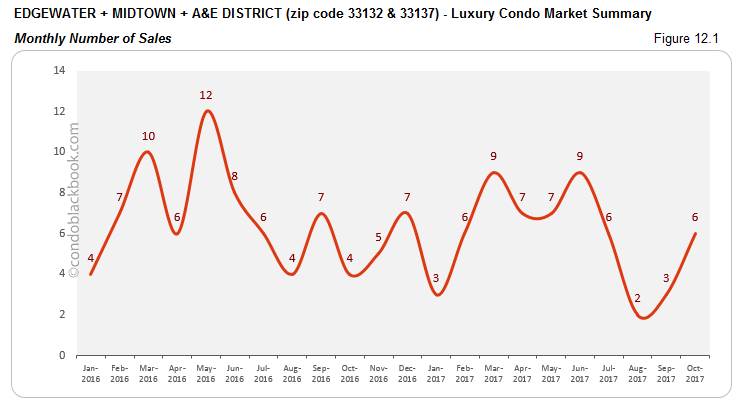
Edgewater + Midtown + A&E District Luxury Condo Market Summary (33132 + 33137 zip) back to top
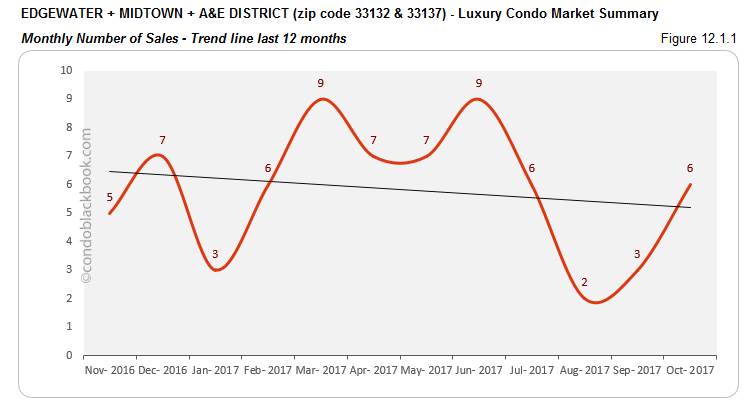
- Sales spike up, but trend line declines. We see a tremendous increase in sales for this grouping. The monthly sales have gone up 100%, and there is a 50% increase to report year-over-year (fig. 12.1). This is definitely a welcome change for this grouping, since it has really struggled with numbers this past quarter. And, this struggle is still evident in the downward curve of the 12-month trend line (fig. 12.1.1).
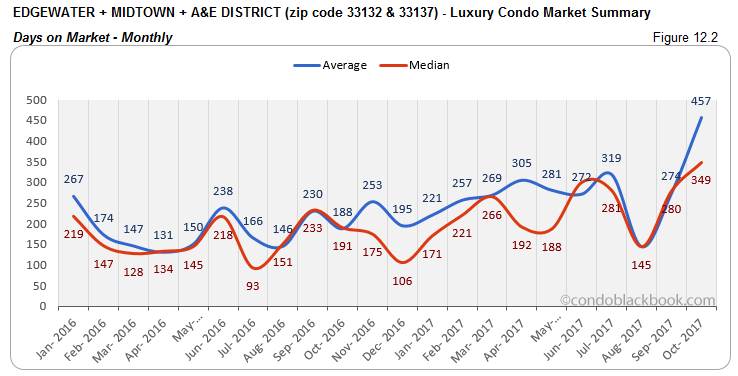
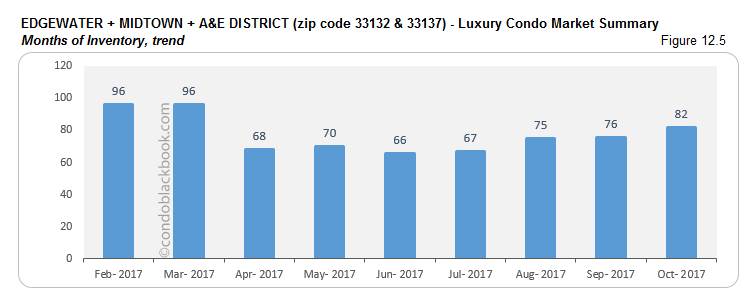
- Months of inventory leap up with influx of new listings. There is an 8% jump in months of inventory to report this October (fig. 12.5). The grouping sits with the highest months of inventory in our study, currently 82 (446 active listings + 5 pending divided by an average of 6 deals a month). An influx of new condo listings coupled with sluggish sales has further widened the gap between the current months of inventory and the 9-12 month mark of a balanced market.
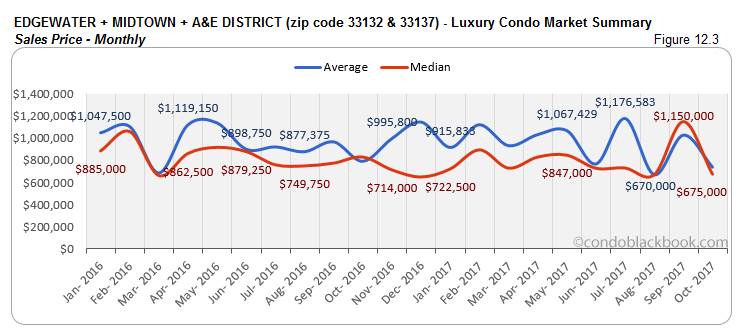
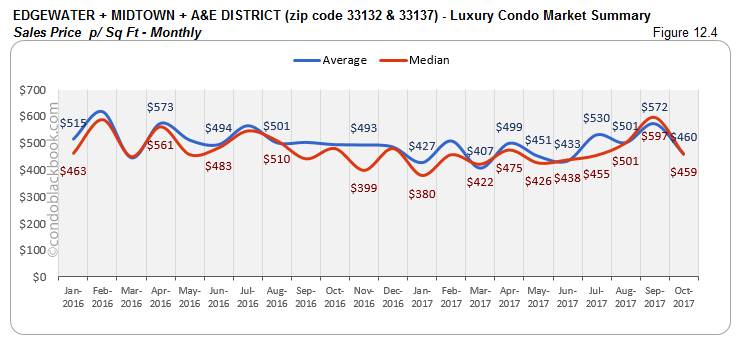
- Drastic cuts in prices. This is the only grouping to report heavy cuts in prices in our study. We see a 41% slash in monthly medians and a 19% cut down in the year-over-year numbers (fig. 12.3). We also see a 23% decrease in the price per sq ft, which is now at $459/sq ft (fig. 12.4). This coupled with slow-moving inventory is a great sign for buyers to cash in on some great deals by searching for Edgewater condos for sale here or see the individual lifestyle and condo options in Edgewater, Midtown and Arts & Entertainment District .
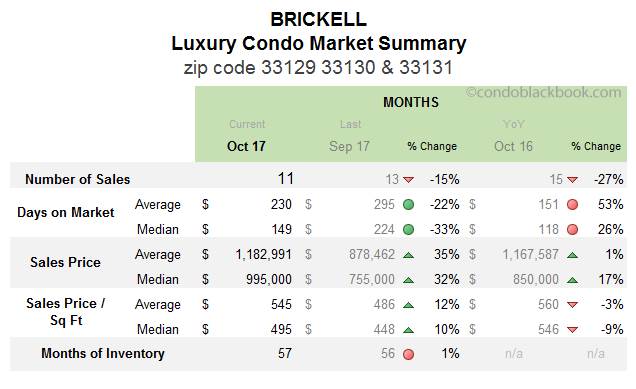
Brickell Luxury Condo Market Summary (33129, 33130, 33131 zip) back to top
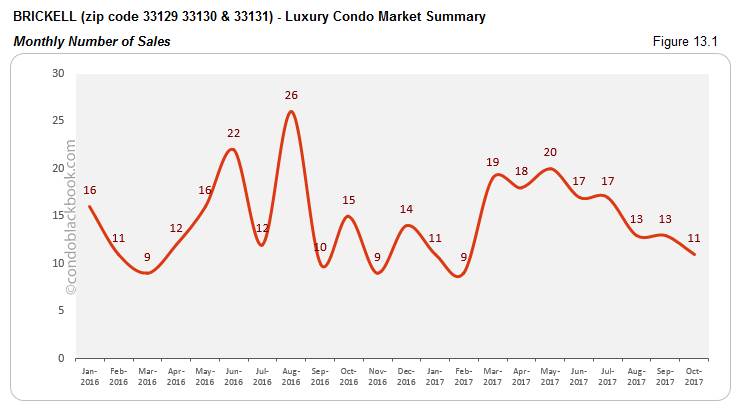
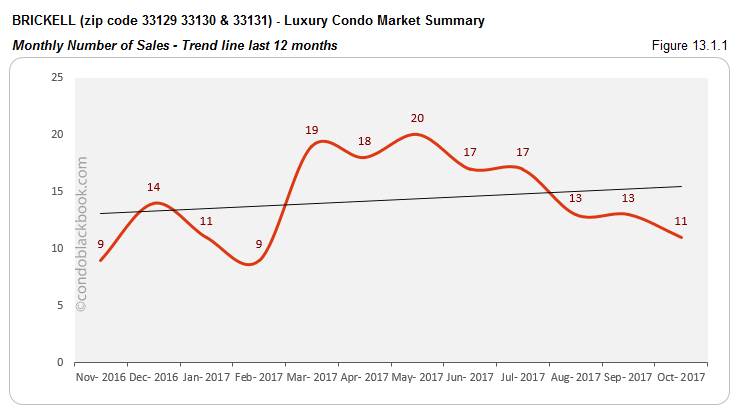
- Sales lose out a little steam, but trend line stays positive. We see October’s sales dropping 15% against September and 27% against the same month last year (fig. 13.1). However, with the 12-month trend line maintaining its upward curve (fig. 13.1.1), this only seems like a minor setback for the business neighborhood.
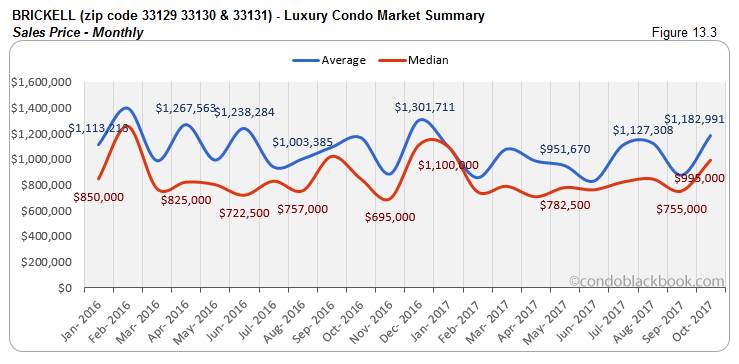
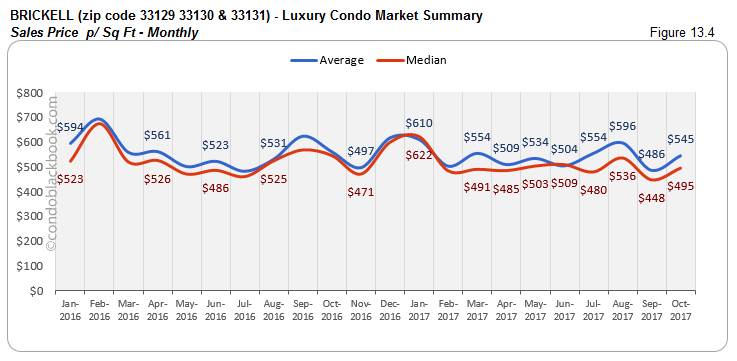
- Prices spike up with ultra-luxury deals. Again, in Brickell, we see a 32% increase in the monthly sales price and 17% increase year-over-year (fig. 13.3). Even the median price per sq ft is 10% higher compared to September (fig. 13.4). Such spike in prices are mostly fueled by ultra-luxury sales priced $2 million and above.
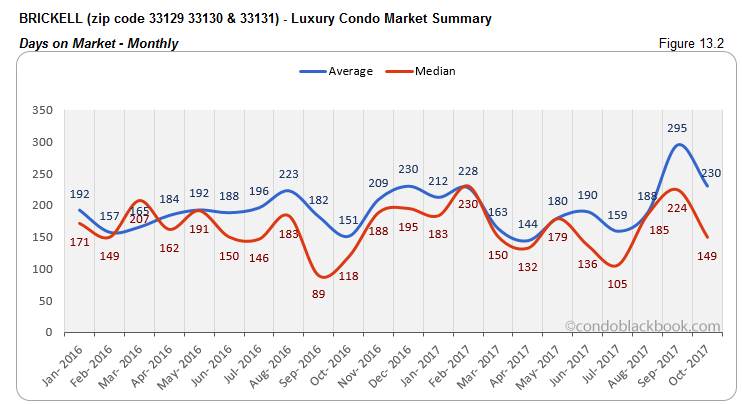
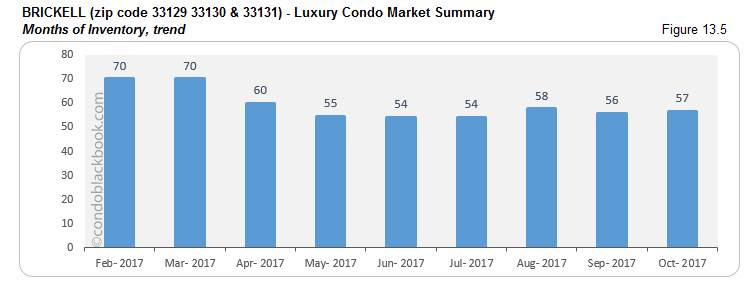
- Months of inventory inch up, days on market decline. We see a total of 57 months of inventory in Brickell (843 active listings + 17 pending divided by an average of 15 deals a month). This is way higher than the 9-12 months of a normal market (fig. 13.5). But, at the same time, we have condos sticking less on the market with a 33% decline in the median days compared to September (fig. 13.2). With ample choices on hand, buyers should take a look at Brickell’s lifestyle options or directly search Brickell condos for sale here.
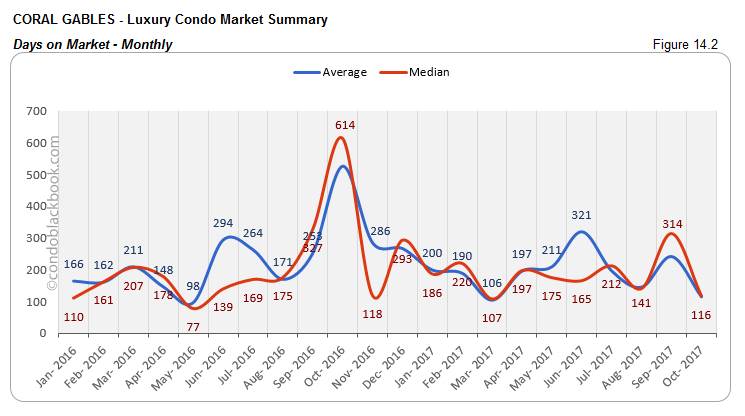
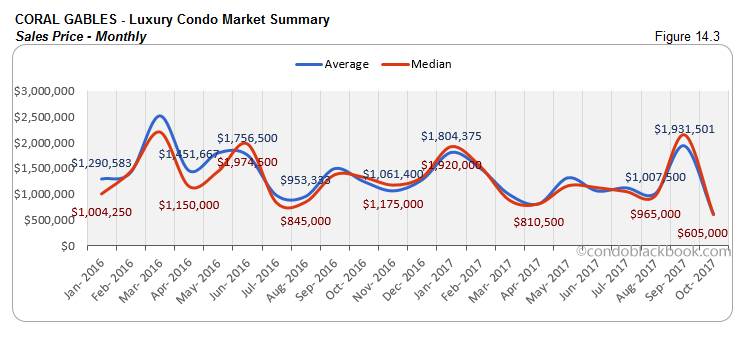
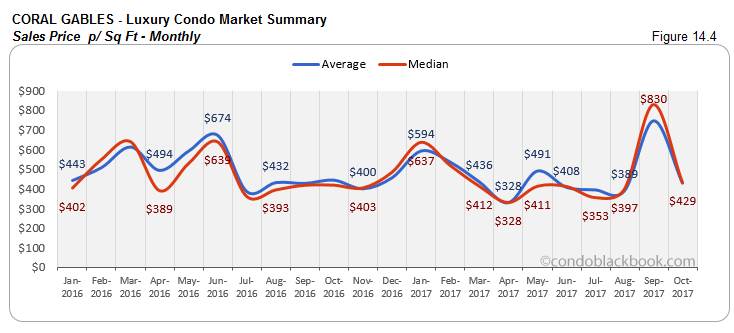
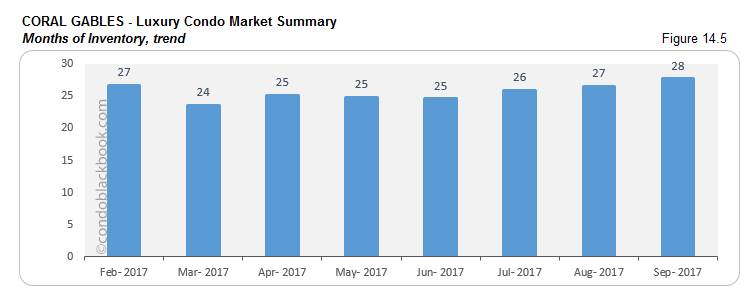
Coral Gables Luxury Condo Market Summary back to top
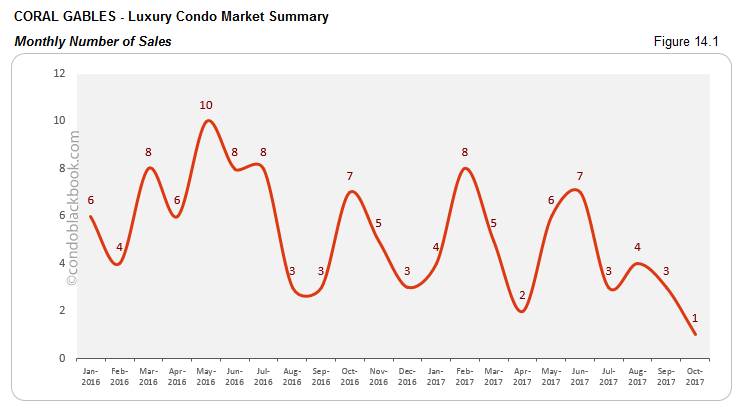
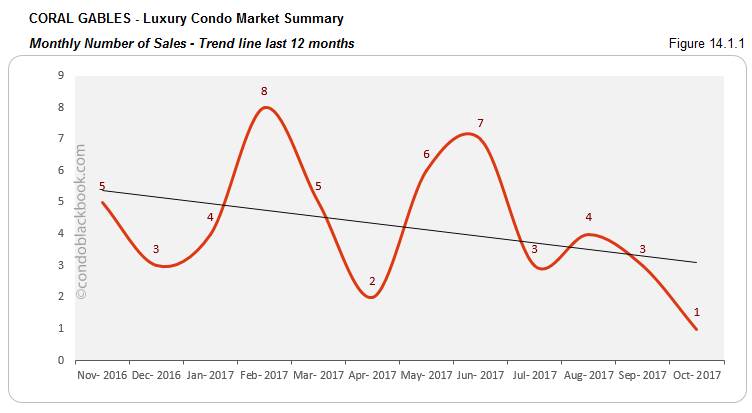
- Sales and trend line descend. We see the sales dwindle by 86% in Coral Gables against the same month last year (fig. 14.1). This also impacts the trend line, making it shift downwards (fig. 14.1.1). Being a small market, even small shifts in numbers can leave a big impact on metrics.
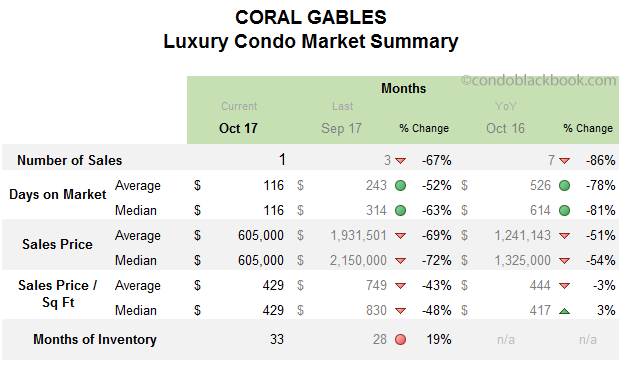
- Price metrics skewed by October’s single sale. We see a drastic drop in the price (fig. 14.3) and price per sq ft (fig. 14.4) in Coral Gables. But, it’s interesting to note that while September posted 2 ultra-luxury sales (above $2 million), October had only a single sale of $605,000 to report. This sharp contrast in numbers is what has led to the volatility we see in the prices for the neighborhood.
- Months of inventory climb up. Fig. 14.5 reports 33 months of inventory in Coral Gables (107 active listings + 25 pending, divided by an average of 4 deals a month). This is not only 19% higher than September, but also off the 9-12 month mark of a normal market. With ample variety sitting on the market, buyers could gain by checking out the lifestyle options in Coral Gables, or directly search Coral Gables condos for sale here.
Conclusion back to top
Market continues to favor buyers with lower prices on luxury condos. For now, we have a market still favoring buyers with high months of inventory and lower prices from the luxury segment (condos below $2 million). However, with winter approaching, we expect pent up demand from Irma’s disruption to come through. This is also the time of year when Art Basel crowd will be back to buy art and more. A combination such as this could easily end up fueling a marginally improving sales situation into a full-scale recovery.
Love what you see? Don’t forget to share our blog and subscribe (see the subscribe link on the top menu) to receive the latest market news in your inbox.
Have any questions? Or see something wrong with the stats? Please contact Sep at sniakan (at) hbroswell.com or call 305-725-0566.
Share your thoughts with us

Your Miami Condo Awaits
Recent Posts


 (305) 697-7667
 (786) 321-7233
  contact@condoblackbook.com

