Miami Beach Luxury Condo Market Report -- Q3 2019
Nov 11, 2019 November 11, 2019
In our overall Miami luxury condo market report for Q3 2019, we saw an increase in sales, a decline in median prices, and heavy inventory keeping things in favor of the buyer. This report breaks down how the neighborhoods in Miami Beach and the barrier islands reacted over the quarter individually, as well as against the market as a whole.
For the purpose of this report, we’ve included the sub-neighborhoods of South Beach, Mid-Beach, Sunny Isles Beach, Surfside, and Bal Harbour as part of this Miami Beach grouping. Also, this luxury condo market report only features properties priced $1 million and above.
Miami Beach Market at a Glance

Miami Beach Luxury Condo Market Q3 2019 Highlights:
- Miami Beach sales almost match Q3 2018
- Sales trendline positive for all neighborhoods
- Year-over-year sales improve in South Beach, Surfside & Bal Harbour
- Miami Beach price per sq. ft. is same as Q3 last year
- Surfside & Bal Harbour report highest jump in quarter-over-quarter median sales price
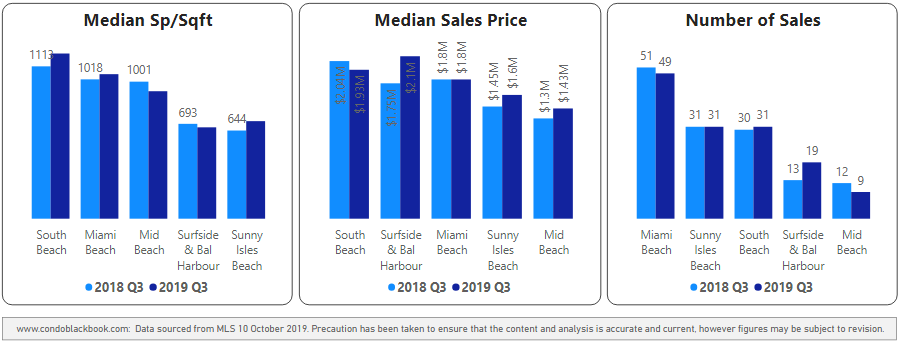
- South Beach is the most expensive at $1,207 per sq. ft.
- Overall inventory increased, with declines only in Mid-Beach and Sunny Isles Beach
- Sunny Isles Beach reports the highest level of inventory at 47 months
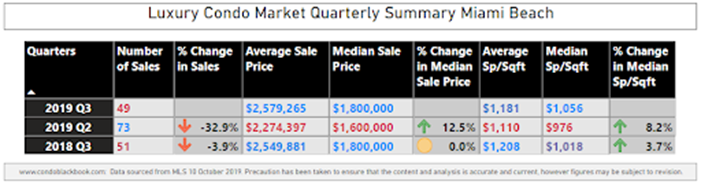
Miami Beach Luxury Condo Market Summary - Fig. 1
Luxury Condo Sales Stable
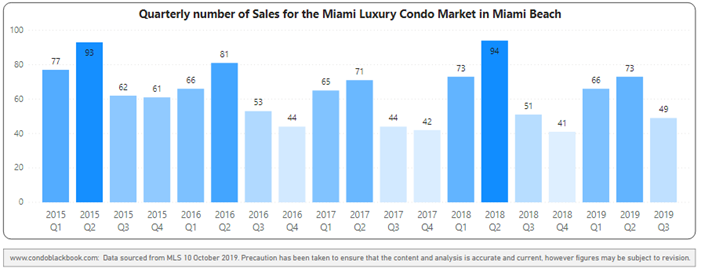
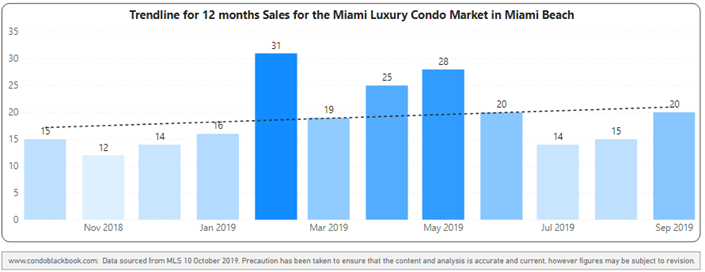
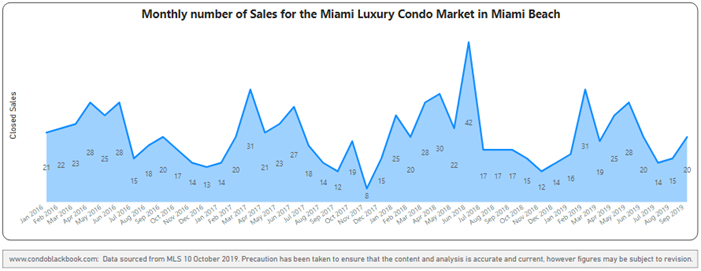
Year-over-year sales encouraging with positive trendline. Going with the overall market trend, Miami Beach reports a good number of sales, short only 3.9% against Q3 2018 (fig. 1). The quarter got off to a slow start, but sales peaked towards the end in the month of September, putting in a good boost (see fig. 2.3).
It is also encouraging to see that while sales declined by 45.7% between Q2 and Q3 last year, the difference reduced to 32.9% this year (fig. 2.1). This shows an increase in market momentum, further leading to a positive sales trendline in fig. 2.2.
Quarterly sales heatmap - Fig. 2.1
12-month sales with trendline - Fig. 2.2
Monthly sales from Jan. 2016 to Sep. 2019 - Fig. 2.3
Luxury Condo Prices Up in Miami Beach
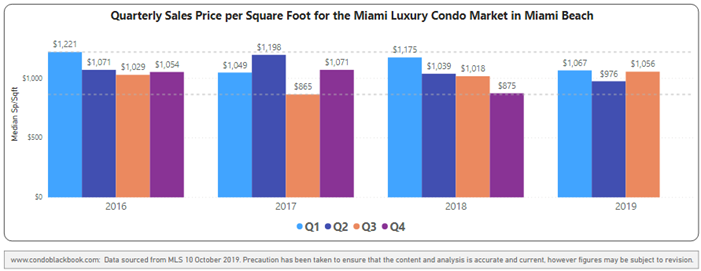
Increase in year-over-year and quarter-over-quarter price per sq. ft. The Q3 median price per sq. ft. reports a good 8.2% increase against Q2 2019, and a 3.7% increase against Q3 last year (fig. 1). This trend moved in the opposite direction compared to the overall market trend, perhaps due to a couple of sales of higher-end or newer luxury condos bumping up values.
It is also worth noting that prices in Miami Beach are in the mid-range this quarter, as compared to the previous three years (see minimum-maximum trendlines of fig. 3.1). The coastal district closed the quarter at $1,056 per sq. ft.
Quarterly price per sq. ft. 2016-2019 - Fig. 3.1
Increase in Inventory Favors Buyers, Again
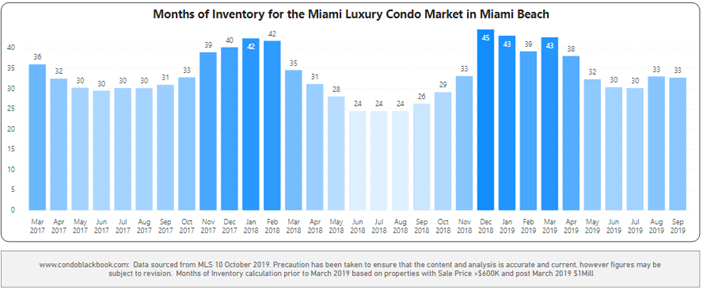
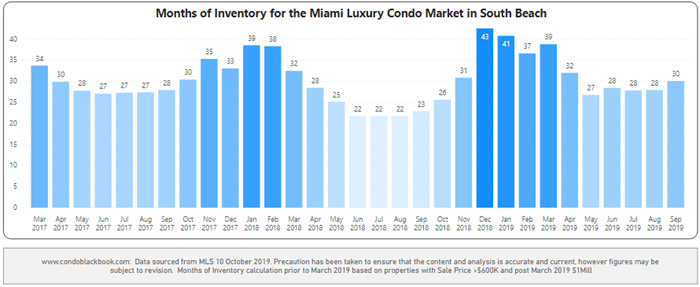
Higher inventory at 33 months. Inventory may have come off the highs of January and March, but is still higher than June-end 2019 and September-end last year. Gradually increasing over the third quarter, inventory closed at 33 months. In line with the overall market trend, this value is much higher than the ideal 9-12 months of a balanced market, giving buyers ample choices and opportunity to bargain as they search Miami Beach condos for sale here.
A balanced market has only 9-12 months of inventory. The months of inventory are calculated as – no. of active listings + no. of pending listings divided by the average number of deals in the last 6 months.
*Starting this year, we are only considering properties priced $1 million and upwards for our luxury condo study, instead of the previous $600K benchmark. This means, that while our historical data compares to condos priced $600K and higher, starting March 2019, the numbers represent properties priced $1 million and higher only.
Months of inventory from Mar. 2017 to Sep. 2019 - Fig. 4.1
Miami Beach Neighborhoods: South Beach (ZIP 33139)
South Beach Luxury Condo Market Summary - Fig. 5
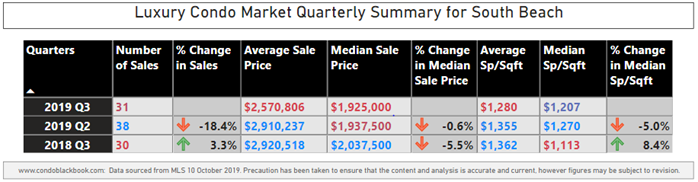
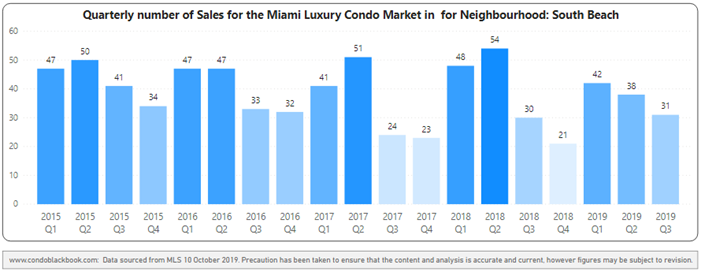
Sales Uptrend in South Beach
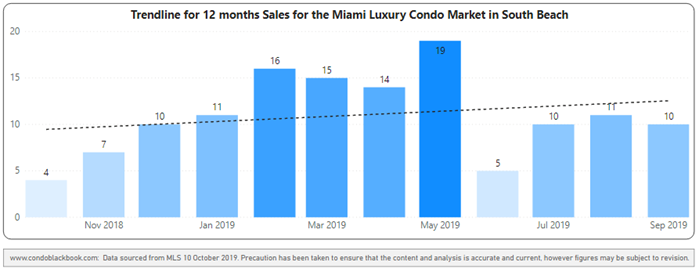
Year-over-year sales stable with positive trend line. Much like the overall market trend, South Beach’s Q3 sales were 3.3% higher compared to the same quarter 2018 (fig. 5). In another positive for this popular vacation neighborhood, while sales declined 44% between Q2 and Q3 last year, they only went down 18.4% quarter-over-quarter this year. This clearly indicates an increase in market momentum, which is further evidenced by the positive tracing trendline of fig. 6.2 below.
Quarterly sales heatmap - Fig. 6.1
12-month sales with trendline - Fig. 6.2
Luxury Condo Prices Trend Higher
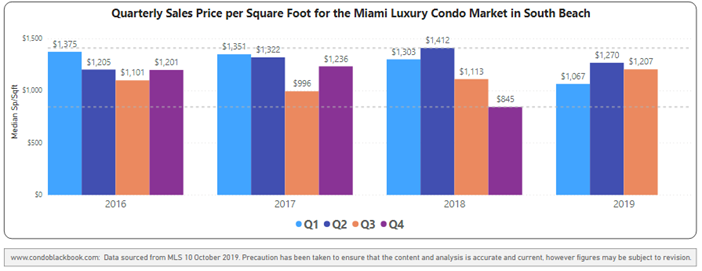
South Beach is most expensive per sq. ft. with year-over-year increase in prices. In contrast to the overall market trend, the median price per sq. ft. in South Beach increased 8.4% year-over-year, closing the quarter at $1,207 per sq. ft. (fig. 5). This makes it the most expensive neighborhood not only in Miami Beach, but Miami as a whole. It is also worth noting that the median price per sq. ft. is keeping close to the higher end of prices from 2016-2019 (see minimum-maximum trendlines of fig. 7 below)
Quarterly price per sq. ft. 2016-2019 - Fig. 7
Inventory Goes Up, Again Favoring Buyers
Inventory up at 30 months. In line with the overall market trend, September-end’s inventory is higher than June’s 28 months as well as last September’s 23 months. At 30 months, inventory has a long way to go before deflating back to the ideal 9-12 months of a balanced market, meaning buyers still have the upper hand in negotiations as they search South Beach condos for sale here.
A balanced market has only 9-12 months of inventory. The months of inventory are calculated as – no. of active listings + no. of pending listings divided by the average number of deals in the last 6 months.
*Starting this year, we are only considering properties priced $1 million and upwards for our luxury condo study, instead of the previous $600K benchmark. This means, that while our historical data compares to condos priced $600K and higher, starting March 2019, the numbers represent properties priced $1 million and higher only.
Months of inventory from Mar. 2017 to Sep. 2019 - Fig. 8
Miami Beach Neighborhoods: Mid Beach (ZIP 33140)
Mid-Beach Luxury Condo Market Summary - Fig. 9
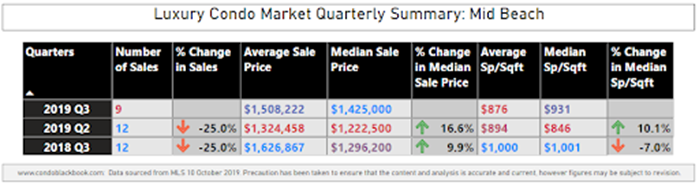
Luxury Condo Sales Down in Mid-Beach
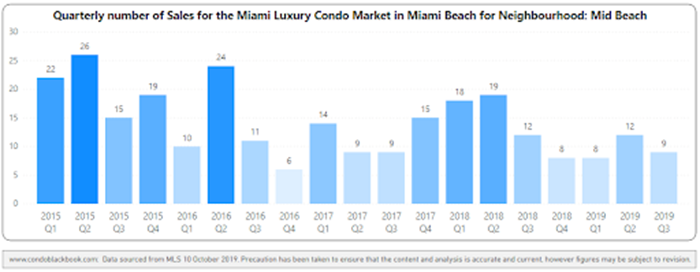
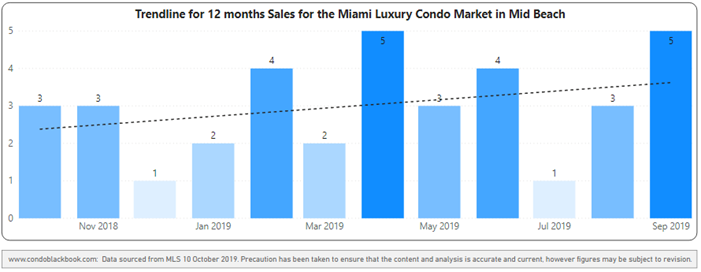
Quarter-over-quarter and year-over-year sales decline, but trendline stays positive. Going against the overall market trend in Miami, Mid-Beach reports a 25% decline in its quarter-over-quarter and year-over-year sales (fig. 9). Still, it is encouraging to see a positive trendline in fig. 10.2, indicating that the market still has enough momentum to chip away at inventory.
Quarterly sales heatmap - Fig. 10.1
12-month sales with trendline - Fig. 10.2
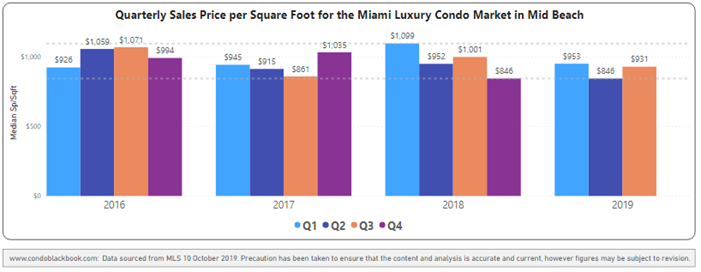
Luxury Condo Prices Down in Mid-Beach
Year-over-year price per sq. ft. declines 7%. In line with the overall market trend, Mid-Beach reports a 7% decline in its median price per sq. ft this Q3. However, the 10.1% uptick we see in the quarter-over-quarter pricing (fig. 9) could be due to a handful of sales above $1 million in the neighborhood. Closing the quarter at $931 per sq. ft., it is also worth noting that prices are trending lower in a quarterly comparison of 2016-2019 (see minimum-maximum trendlines of fig. 11).
Quarterly price per sq. ft. 2016-2019 - Fig. 11
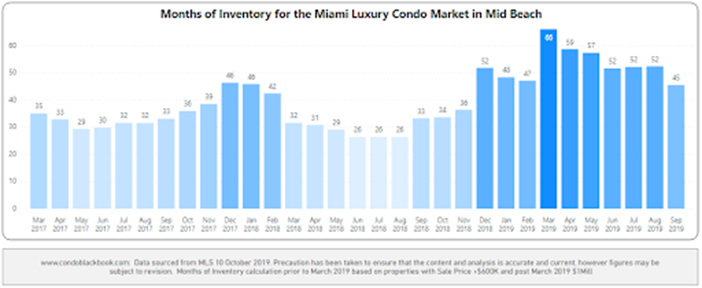
One of Only Two Neighborhoods with Decline in Inventory
Sharp fall in inventory. Fortunately, moving against the overall market trend (like Sunny Isles Beach below), we see the months of inventory come down to 45 this third quarter. This is significantly lower than June-end’s 52 months, but still higher than last September’s 33. Also, inventory is way off its ideal 9-12-month mark, putting buyers in the driving seat of negotiations as they look for Mid-Beach condos for sale here.
A balanced market has only 9-12 months of inventory. The months of inventory are calculated as – no. of active listings + no. of pending listings divided by the average number of deals in the last 6 months.
*Starting this year, we are only considering properties priced $1 million and upwards for our luxury condo study, instead of the previous $600K benchmark. This means, that while our historical data compares to condos priced $600K and higher, starting March 2019, the numbers represent properties priced $1 million and higher only.
Months of inventory from Mar. 2017 to Sep. 2019 - Fig. 12
Miami Beach Neighborhoods: Surfside & Bal Harbour
Surfside & Bal Harbour Luxury Condo Market Summary - Fig. 13
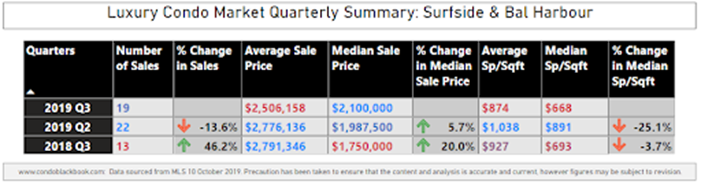
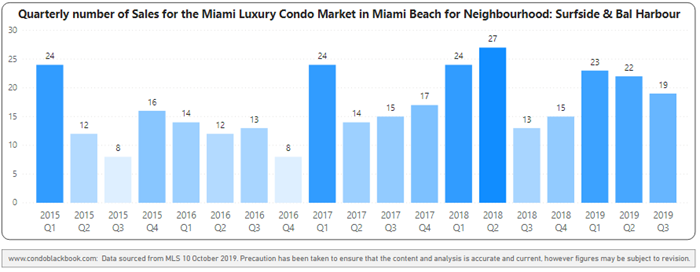
Uptick in Luxury Condo Sales
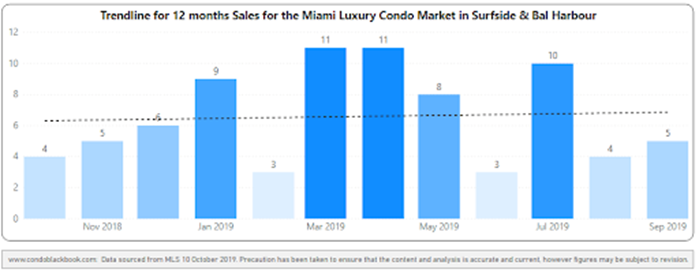
Significant increase in year-over-year sales with flat trendline. In sync with the overall market trend, this combined district posts a sharp increase of 46.2% in year-over-year sales (fig. 13). This is the highest sales volume the grouping has seen compared to Q3 2018, 2017, and 2016 (fig. 14.1).
A flat trendline in fig. 14.2 further indicates that the combined neighborhoods are still recovering from the sluggishness seen in Q1 and Q2, where both posted lower volumes year-over-year.
Quarterly sales heatmap - Fig. 14.1
12-month sales with trendline - Fig. 14.2
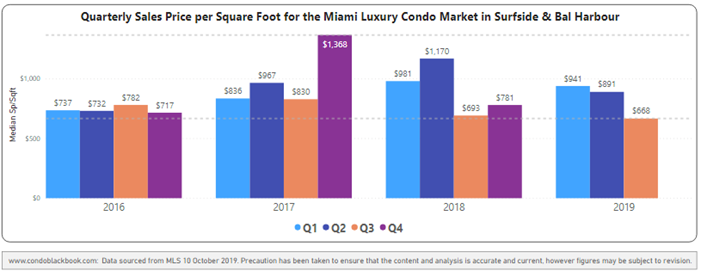
Prices Drop in Surfside & Bal Harbour
Quarter-over-quarter and year-over-year price per sq. ft. decline. Staying in trend with the overall market in Miami, this grouping reports a 3.7% decline in year-over-year and 25.1% drop in quarter-over-quarter median price per sq. ft. (fig. 13). Closing Q3 at $668 per sq. ft., prices are at their lowest since Q1 2016 (see minimum-maximum trendlines of fig. 11).
Quarterly price per sq. ft. 2016-2019 - Fig. 15
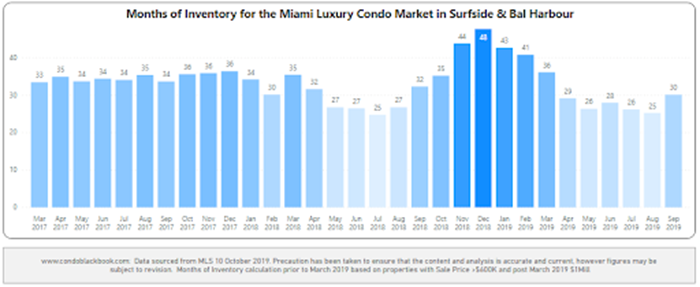
Inventory Uptick Favors Buyers Yet Again
Inventory increased to 30 months. Although inventory is down from September 2018’s 32 months, it went back up from June end’s 28 months - much like the overall market trend and most neighborhoods in our study. Sitting on 30 months of inventory, this combined neighborhood is a long way from reaching the ideal 9-12-month mark of a balanced market. This keeps the window of opportunity open for buyers to have their pick of the litter, as they search for Surfside or Bal Harbour condos for sale.
A balanced market has only 9-12 months of inventory. The months of inventory are calculated as – no. of active listings + no. of pending listings divided by the average number of deals in the last 6 months.
*Starting this year, we are only considering properties priced $1 million and upwards for our luxury condo study, instead of the previous $600K benchmark. This means, that while our historical data compares to condos priced $600K and higher, starting March 2019, the numbers represent properties priced $1 million and higher only.
Months of inventory from Mar. 2017 to Sep. 2019 - Fig. 16
Miami Beach Neighborhoods: Sunny Isles Beach
Sunny Isles Beach Luxury Condo Market Summary - Fig. 17
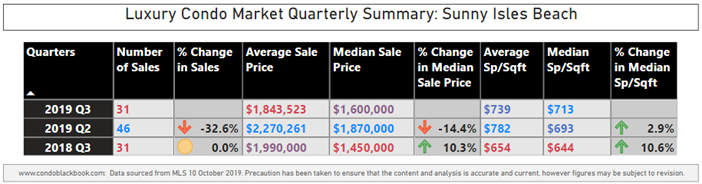
Luxury Condo Sales Match Last Year
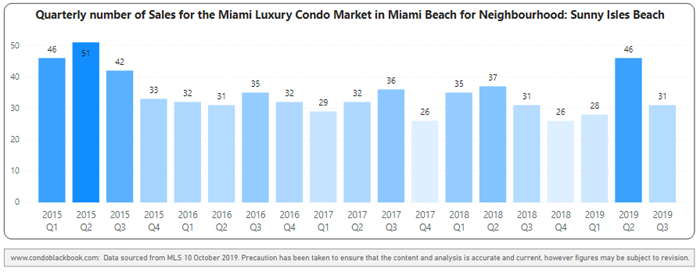
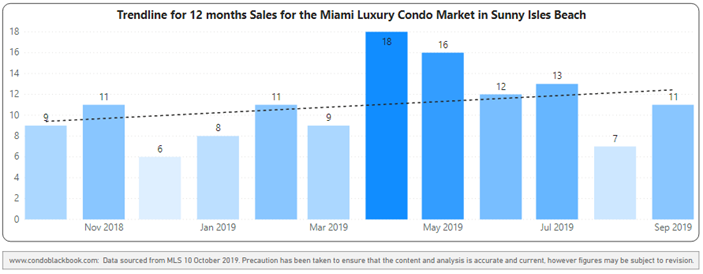
Year-over-year sales stay consistent with positive trendline. After a significant uptick in sales in Q2, Q3 sales return to 2018 levels this third quarter (fig. 17). Staying with the overall market trend of an increase in volumes, Sunny Isles Beach too posts a positive trendline in fig. 18.2, indicating improved momentum.
Quarterly sales heatmap - Fig. 18.1
12-month sales with trendline - Fig. 18.2
Luxury Condo Prices Increase in Sunny Isles Beach
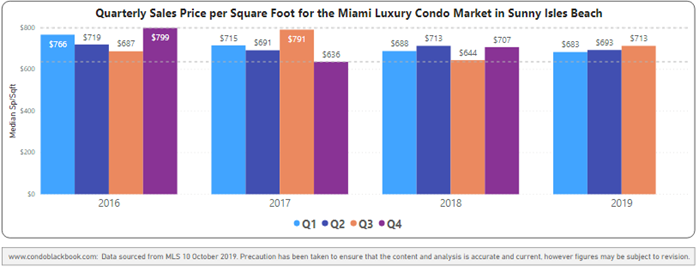
Uptick in year-over-year and quarter-over-quarter price per sq. ft. Q3’s median price per sq. ft. reports a 2.9% increase against Q2 2019, and a 10.6% increase against Q3 last year(fig. 17). Moving against the overall market trend of reducing prices, the quarter closed at a median price of $713 per sq. ft.
It is also worth noting that the price per sq. ft. in Sunny Isles Beach stayed in the mid-range this Q3, as compared to the previous three years (see minimum-maximum trendlines of fig. 19).
Quarterly price per sq. ft. 2016-2019 - Fig. 19
One of Only Two Neighborhoods Reporting a Decline in Inventory
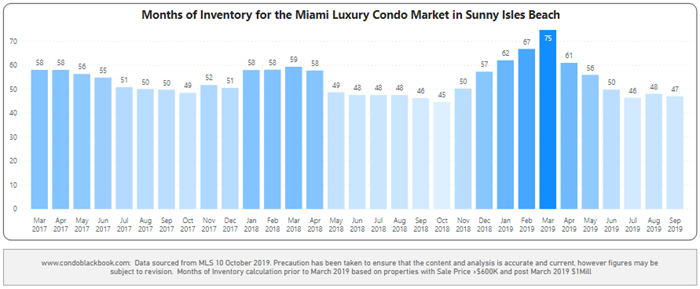
Inventory reduced to 47 months. The second neighborhood to report a decline in inventory this Q3 besides Mid-Beach, Sunny Isles Beach sits with a reduced 47 months of inventory. Moving against the overall market trend, this value is lower than June end’s 50 months, and almost at par with last September’s 46 months. However, this branded condo corridor still has the heaviest amount of inventory in Miami Beach. The metric is also way off the ideal 9-12-month mark of a balanced market, giving buyers the opportunity to cherry-pick deals as they search Sunny Isles Beach condos for sale here.
A balanced market has only 9-12 months of inventory. The months of inventory are calculated as – no. of active listings + no. of pending listings divided by the average number of deals in the last 6 months.
*Starting this year, we are only considering properties priced $1 million and upwards for our luxury condo study, instead of the previous $600K benchmark. This means, that while our historical data compares to condos priced $600K and higher, starting March 2019, the numbers represent properties priced $1 million and higher only.
Months of inventory from Mar. 2017 to Sep. 2019 - Fig. 20
Conclusion
Miami Beach and the barrier islands do not show much deviation from the overall luxury condo market trends. Sales are up, and so is inventory just like the overall market. The only thing deviating from the overall trend is an increase in median prices, showing improved buyer interest in this coastal district.
Still, with plenty of surplus inventory in this grouping as well, the market sits in favor of the buyer. However, just as we’ve pointed out in our overall market report, if individuals from high-tax states continue flowing in, sellers offer better prices, first-time buyers find encouragement in historically low mortgage interest rates, and inventory keep getting chipped at its current rates, we can fairly expect to see a more balanced situation going into the second half of 2020.
For a deeper dive into the process, click here to see the data and statistics that make up this luxury condo report.
Love what you see? Don’t forget to share our blog and subscribe (see the subscribe link on the top menu) to receive the latest market news in your inbox.
Have any questions? Or see something wrong with the stats? Please contact Sep at sniakan (at) hbroswell.com or call 305-725-0566.
Cover photo courtesy of MiamiAndBeaches.com
Share your thoughts with us

Your Miami Condo Awaits
Recent Posts


 (305) 697-7667
 (786) 321-7233
  contact@condoblackbook.com

