


Covering the neighborhoods of Greater Downtown Miami (inclusive of Edgewater and Brickell), Miami Beach (inclusive of Surfside, Bal Harbour and Sunny Isles Beach), Coconut Grove and Coral Gables, plus Fisher Island, this luxury condo market report only features properties priced $1 million and above.
Overall Luxury Condo Market Q3 2019 Highlights:
- Overall sales match Q3 2018 levels
- Sales trendline positive across neighborhoods, except Edgewater
- Year-over-year sales improve in South Beach, Surfside, and Bal Harbour
- Overall price per sq. ft. stays close to lows of 2018
- Surfside and Bal Harbour report biggest jump in Quarter-over-quarter median sales prices
- Months of inventory fall short on momentum and match June-end levels, with Mid-Beach, Sunny Isles Beach, Greater Downtown, Coconut Grove and Coral Gables reporting declines
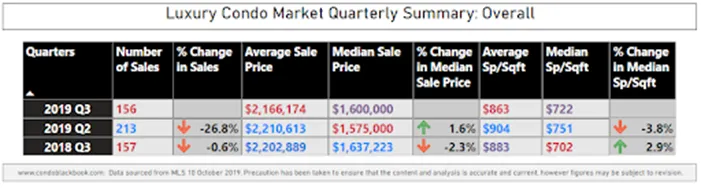
Overall Luxury Condo Market Summary - Fig. 1.1
Overall Luxury Condo Sales Up
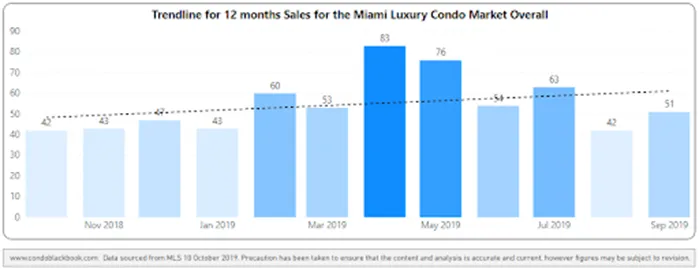
Q3 sales trend positive with a boost in July, outperforming 2016 and 2017. For one, we see the overall sales volume matching Q3 2018. The numbers also outperform 2016 and 2017, which is clearly visible in the heatmap below. So, even as the quarter-over-quarter sales decline 26.8% (not uncommon for this time of year), we see a positive trendline in fig. 2.3 below. This positive trendline further gives us hope that the momentum is likely to continue through to the end of the year, which could finally start nudging the market towards a balance.
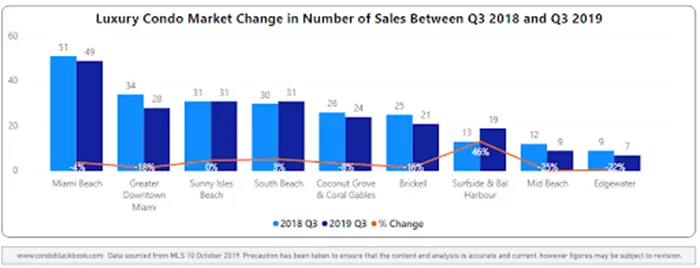
The sub-neighborhoods of South Beach, Surfside, and Bal Harbour were the biggest contributors in terms of sales this quarter, posting a significant uptick against Q3 2018. (see fig. 2.2 below, plus more details in dedicated reports for Greater Downtown Miami, Miami Beach and the Barrier Islands, Coral Gables and Coconut Grove)
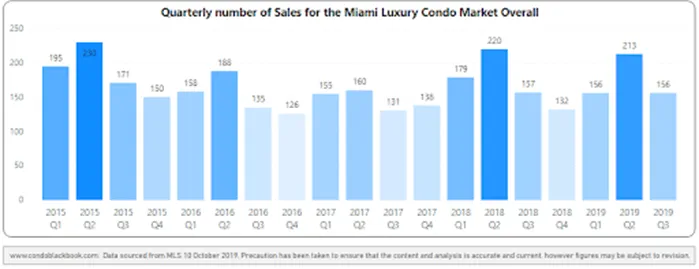
Quarterly sales heatmap - Fig. 2.1
Year-over-year sales comparison by neighborhood - Fig. 2.2
12-month sales with trendline - Fig. 2.3
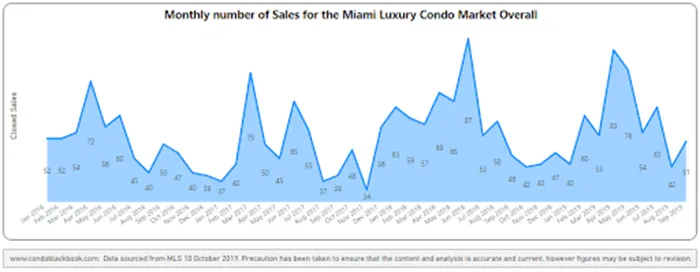
Monthly sales from Jan. 2016 to Sep. 2019 - Fig. 2.4
Luxury Condo Prices Down
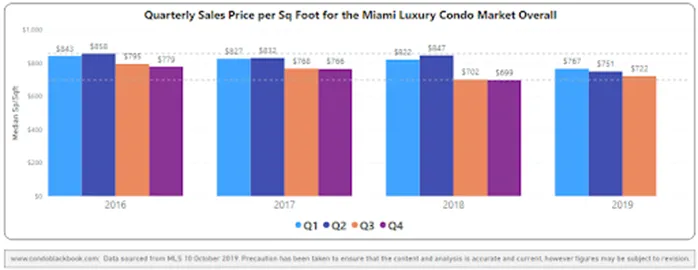
Buyer’s market keeps prices low. Fig. 3.1 below, clearly shows that Q3’s median price per sq. ft. gravitated towards the minimum-range trendline in the years from 2016 to 2019. This shows how buyers have been able to exert their influence in a favorable market.
Further, the overall year-over-year median prices declined 2.3%, while the median price per sq. ft. inflated 2.9% (see fig. 1.1 above). This difference in trends is perhaps due to newer condos being smaller in size and yet more amenity-rich, making them command a higher price per sq. ft.
Quarterly price per sq. ft. 2016-2019 - Fig. 3.1
Neighborhood Highlights
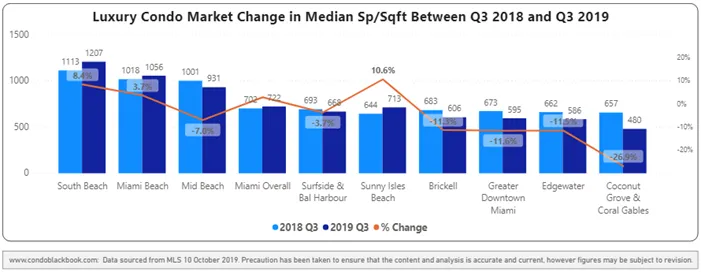
Only Sunny Isles Beach reports increase. Sunny Isles Beach is the only sub-neighborhood to report an increase (10.6%) in its year-over-year median price per sq. ft. What’s to be noted here is that the range of price per sq. ft. values in the neighborhood is broad, so this, together with the small number of properties sold quarterly means values are highly sensitive.
Surfside and Bal Harbour post highest percentage increase year-over-year. Surfside and Bal Harbour post the highest percentage increase of 20% in their year-over-year median sales prices. The sub-neighborhoods of Edgewater, Mid-Beach and Sunny Isles Beach also show a good increase in year-over-year trends.
Year-over-year median price by neighborhood - Fig. 3.2
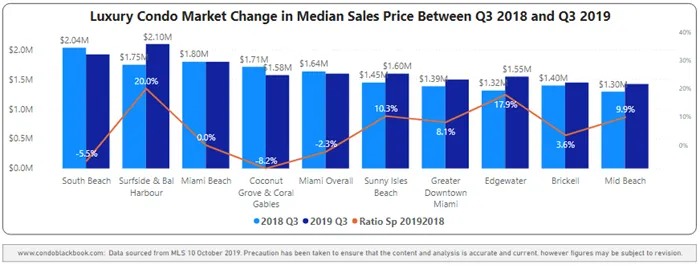
South Beach is most expensive. South Beach turned out to be the most expensive neighborhood this third quarter, with its median price per sq. ft. topping the charts at $1,207. The sub-neighborhood reports an 8.4% increase against Q3 2018.
Year-over-year median price per sq. ft. by neighborhood - Fig. 3.3
Sales Price Trends by Building Year - Miami Luxury Condo Market Overall
Below is a detailed analysis of how prices added up on the basis of age of construction for luxury condos in Miami.
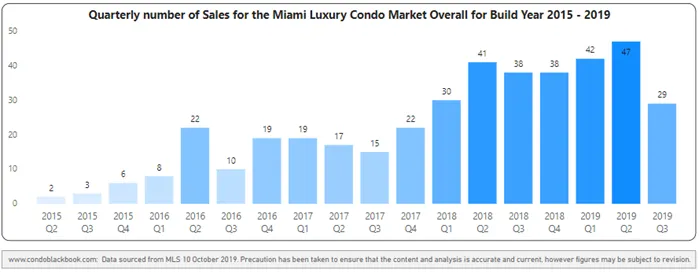
BUILDINGS BUILT 2015-2019
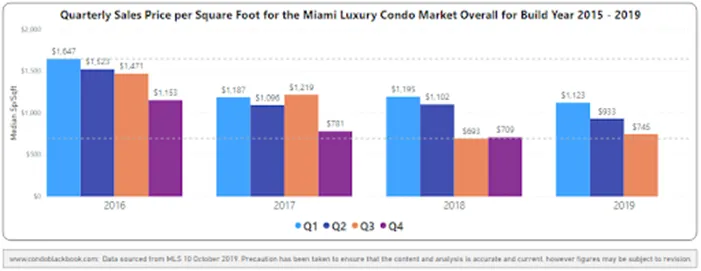
The year-over-year sales dwindled for this newly-built segment, coming down from 38 in Q3 2018 to 29 this year (see fig. 3.4 below). On the other hand, the year-over-year price per sq. ft. increased from $693 in Q3 2018 to $745 this year. What’s worth noting here is how prices gravitated towards the lower-end of the last four years (looking at the minimum-maximum range trendlines of fig. 3.5), showcasing that sellers are highly cautious of staying competitive in this buyer’s market.
Overall sales heatmap for buildings dated 2015-2019 - Fig. 3.4
Overall price per sq. ft. for buildings dated 2015-2019 - Fig. 3.5
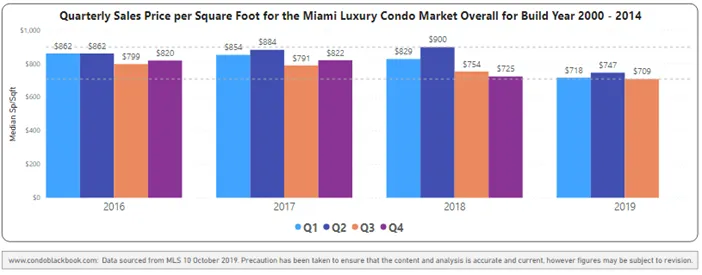
BUILDINGS BUILT 2000-2014
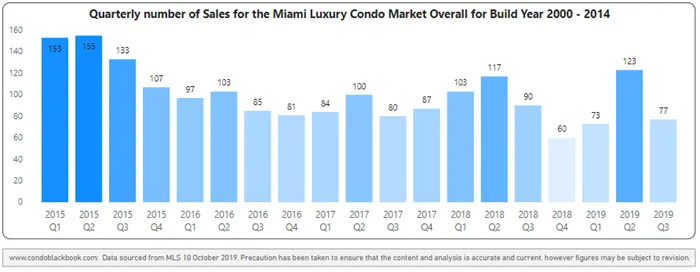
Fig. 3.6 below traces a decline in year-over-year sales, with numbers dipping from 90 in Q3 2018 to 77 this year. Continuing on the annual trend, Q3 2019 too posted a lower year-over-year price per sq. ft. of $709 compared to 2018’s $725 (see fig, 3.7 below). In fact, the segment is sitting at its lowest price per sq. ft. in the past four years.
Overall sales heatmap for buildings dated 2000-2014 - Fig. 3.6
Overall price per sq. ft. for buildings dated 2000-2014 - Fig. 3.7
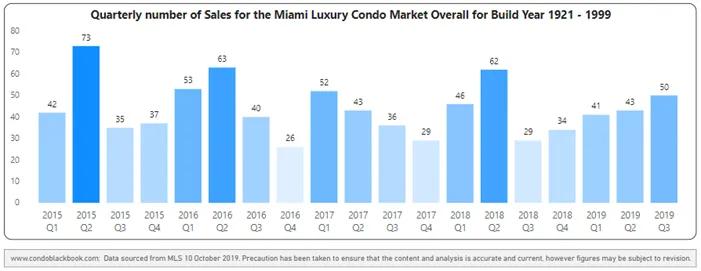
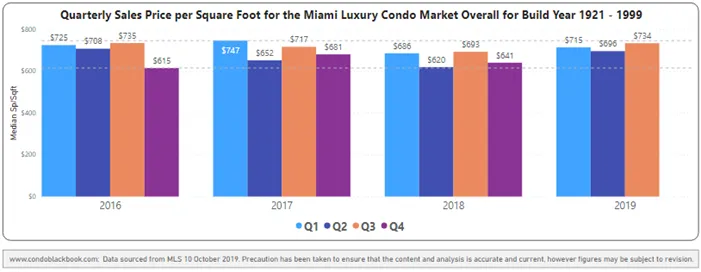
BUILDINGS BUILT BEFORE YEAR 2000
Sales almost doubled since Q3 2018 in this segment (see fig. 3.8). The year-over-year price per sq. ft. too posted a jump from $693 in Q3 2018 to $734 this year. Further, fig. 3.9 shows that prices floated closer to the maximum-range trendline, indicating an increase in demand for this segment.
Overall sales heatmap for buildings dated 1921-1999 - Fig. 3.8
Overall price per sq. ft. for buildings dated 1921-1999 - Fig. 3.9
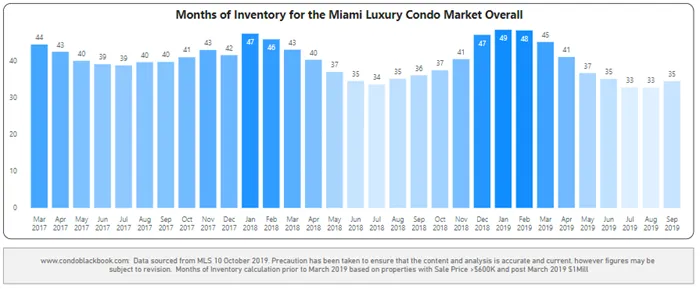
Heavy Inventory Keeps Buyers in Control
Inventory still high at 35 months. Coming off the highs of January this year (see fig. 4.1 below), we see inventory closing at 35 months by the end of the third quarter. At 35 months, it is back to June-end 2019 levels, and lower than September-end last year. Still, the metric is way off the ideal 9-12 months benchmark, giving buyers more time and opportunity to cherry-pick the best deals.
A balanced market has only 9-12 months of inventory. The months of inventory are calculated as – no. of active listings + no. of pending listings divided by the average number of deals in the last 6 months.
*Starting this year, we are only considering properties priced $1 million and upwards for our luxury condo study, instead of the previous $600K benchmark. This means, that while our historical data compares to condos priced $600K and higher, starting March 2019, the numbers represent properties priced $1 million and higher only.
Months of inventory from Mar. 2017 to Sep. 2019 - Fig. 4.1
Conclusion
It’s a buyer’s market through and through for now, with all this inventory surplus. However, if the market picks up momentum through this last quarter, and with not much new inventory expected to join the ranks, we could soon be looking at a more balanced situation going into the second half of 2020.
For a deeper dive into the process, click here to see the data and statistics that make up this luxury condo report.
Luxury Market Predictions and Analysis: Where Does the Market Go From Here?
In our opinion, the following factors could turn out to be the game-changers this buyer’s market needs to bounce back into a balance:
- High-tax states continue pushing buyers to settle in Miami with these tax-savings coming to the rescue
- Better-priced deals would help buyers find the motivation they need to get off the fence and make a purchase
- Inventory could get easier to chip at with fewer pre-construction deliveries and deep-pocketed sellers taking off their condos until the market regains its balance
- Historically low mortgage interest rates could be the perfect nudge for first-time buyers to take the plunge
Love what you see? Don’t forget to share our blog and subscribe (see the subscribe link on the top menu) to receive the latest market news in your inbox.
Have any questions? Or see something wrong with the stats? Please contact Sep at sniakan (at) hbroswell.com or call 305-725-0566.