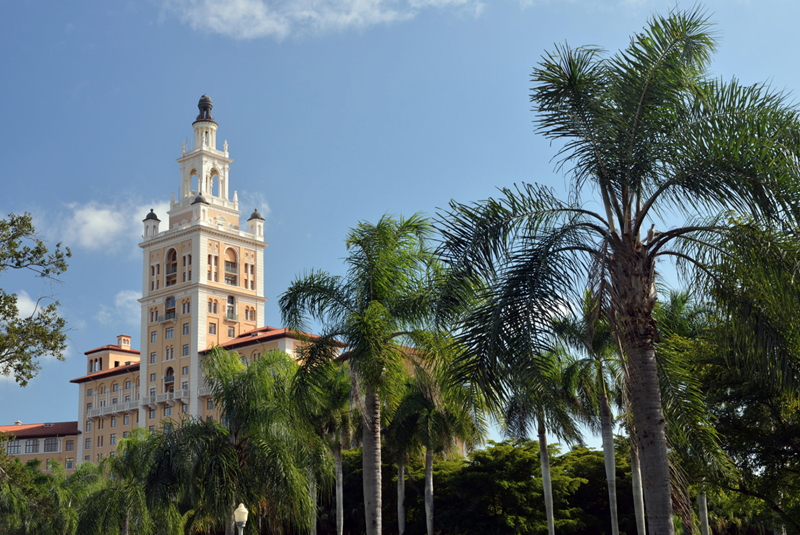
Q3 2023 Coral Gables and Coconut Grove Luxury Condo Market Report
Oct 25, 2023 October 25, 2023
Exceeding all market expectations, this market pairing of historically significant neighborhoods posted one of its strongest third-quarters on record. This late summer sales boost also kept inventory levels in check and within the range of a balanced market, maintaining a healthy buyer-seller equilibrium in a thriving third-quarter market, combined significant pricing increases.
In Q3 2023, price per square foot stats also set a record of sorts by reporting the second-highest prices ever in our 7-year analysis. This was boosted by the newer breed of luxury condos in this combined neighborhood. Meanwhile, the days on market increased quarter-over-quarter, quite expectedly, still boasting some of the quickest listing-to-closing times of all Miami neighborhoods under our review.
Read on for more details on how this beautiful pairing of Miami's neighborhoods —Coconut Grove and Coral Gables— performed year-over-year, as well as against the overall Miami market trends in terms of sales, prices, days on market, and inventory in our exclusive, full-length analysis for luxury condos on Q3 2023.
For this Miami submarket luxury condo report, we've only included properties priced at $1 million and above.
Key Q3 2023 Coral Gables and Coconut Grove Luxury Condo Market Stats:
- Sales are up 62.1% year-over-year, the second-best in a third quarter.
- 12-month sales trendline maintained its positive curve from Q2 to Q3 2023.
- Price per square foot is up 14.6% year-over-year at $869/Sq. Ft. This pairing continued posting the highest percentage gain of all Miami neighborhoods under review.
- Sales price is up 3.5% year-over-year to $1.6M.
- Days on market is up 47% year-over-year.
- Inventory is up 80% year-over-year to 9 months. However, it's the lowest of all Miami neighborhoods under review as it was in a very strong seller's market a year ago.
- Coral Gables and Coconut Grove continued to be a balanced market favoring buyers and sellers equally.
Table of Contents
- Q3 2023 Coral Gables & Coconut Grove Luxury Condo Sales Trends
- Q3 2023 Coral Gables & Coconut Grove Luxury Condo Price Trends
- Q3 2023 Coral Gables & Coconut Grove Luxury Condo Days on Market Trends
- Q3 2023 Coral Gables & Coconut Grove Luxury Condo Inventory Trends
- Q3 2023 Coral Gables & Coconut Grove Luxury Condo Market Conclusion
1. Q3 2023 Coral Gables & Coconut Grove Luxury Condo Sales Trends: Up YoY
Q3 2023 Coral Gables and Coconut Grove Luxury Condo Market Summary - Fig. 1 | |||||||
Quarters | Number of Sales | % change in Sales | Median Sale Price | % change in Median Sale Price | Median Sp/Sqft | % change in Median Sp/Sqft | Median of DOM |
Q3-2023 | 47 | -2.1% | $1,605,000 | -13.2% | $869 | -13.0% | 63 |
Q2-2023 | 48 | $1,850,000 | $999 | 58 | |||
Q3 2023 Coral Gables and Coconut Grove Luxury Condo Market Summary - Fig. 1.1 | |||||||
Quarters | Number of Sales | % change in Sales | Median Sale Price | % change in Median Sale Price | Median Sp/Sqft | % change in Median Sp/Sqft | Median of DOM |
Q3-2023 | 47 | 62.1% | $1,605,000 | 3.5% | $869 | 14.6% | 63 |
Q3-2022 | 29 | $1,550,000 | $758 | 43 | |||
Sales up 62.1% year-over-year — 2nd highest in a 3rd quarter — 12-month sales trendline positive
With a 62.1% increase in sales volume, Coral Gables and Coconut Grove (collectively) outpaced both the Miami Beach (0%) and Greater Downtown groupings (+10.3%) in terms of year-over-year growth. Reporting one of its strongest third quarters in recent history, this pairing of historically significant neighborhoods posted its second-best sales numbers in a third quarter, only behind the all-time high reported in Q3 2021 (part of the high-energy pandemic-year market).
Echoing and boosting the positive pace and mood of the overall Miami market, where volumes were higher year-over-year but expectedly declined quarter-over-quarter (given the seasonality of Miami's luxury housing market), Coral Gables and Coconut Grove (collectively) reported the following sales statistics for Q3 2023:
- Q3 2023 vs Q3 2022. Sales increased 62.1% year-over-year, up from 29 in Q3 last year to 47 in Q3 this year. (Fig.1.1)
- What's worth noting is that this year's third quarter outpaced all pre-pandemic quarters, along with reporting the second-highest sales volume in a 3rd quarter on record – showing exceptional strength and growth possibilities in a relatively modest market, in terms of scale and volume compared to Miami Beach or Greater Downtown. (Fig. 2.1)
- Q3 2023 vs Q2 2023. Sales remained flat quarter-over-quarter, adjusting only -2.1%, marginally, down from 48 in the previous quarter to 47 in Q3 2023. (Fig. 1). Any changes here simply seen are minor corrections from a record Q3 2023.
Looking into the monthly sales statistics of Fig. 2.2 for Coral Gables and Coconut Grove:
- July 2023 closed with 16 sales compared to 10 sales for the same month last year.
- August closed with 12 luxury condo sales versus 9 in the same month of 2022.
- September closed with 19 sales as compared to 10 for the same month a year ago.
Owing to intense demand from domestic and foreign buyers, the 12-month sales trendline of Fig. 2.3 maintained its positive trajectory between Q2 and Q3 2023.
As real estate experts, we expect the combined neighborhood of Coral Gables & Coconut Grove to close 2023 strong. Even as momentum is showing a slow down from the second quarter and possibly going into the fourth quarter (as noted from historical sales trends), we anticipate stable demand (indicated by a positive trendline) to keep inventory levels in check, keeping this beautiful pairing of neighborhoods a balanced market through the end of the year.
Coral Gables & Coconut Grove Luxury Condo Quarterly Sales 2015 - 2023 - Fig. 2.1
Coral Gables & Coconut Grove Luxury Condo Monthly Sales from Jan. 2016 to Sep. 2023 - Fig. 2.2
Coral Gables & Coconut Grove Luxury Condo 12-Month Sales with Trendline - Fig. 2.3
2. Q3 2023 Coral Gables & Coconut Grove Luxury Condo Price Trends: Up YoY, Leads Percentage Gains in Miami Overall
Q3 2023 Price per square foot up 14.6% to $869 — Median price up year-over-year
Aligned with the price gains and stability noted in the overall Miami market, the key price statistics for Coral Gables and Coconut Grove (collectively) in Q3 2023 were:
- Q3 2023 vs Q3 2022. Price per square foot increased 14.6% year-over-year, up from $758 in Q3 last year to $869 for the comparable quarter of 2023. (Fig. 1.1).
- With the highest percentage gain (15%) in year-over-year price per square foot, luxury condos in Coral Gables and Coconut Grove offered maximum value to sellers in all of Miami, continuing its winning streak from Q2 2023.
- Q3 2023 vs Q2 2023. Price per square foot declined -13% quarter-over-quarter, down from the record high of $999 in the previous quarter to $869 in Q3 2023. (Fig. 1)
- A look at the 5-year snapshot of quarterly luxury condo prices below (Fig. 3), reveals that the price per square foot leaped to its second-highest in a quarter, ever – indicating that sellers continued receiving top value for their luxury condo investments in this pairing of Miami's tropically lush neighborhoods.
- Q3 2023 vs Q3 2022. Median sales price increased by 3.5%, up from $1,550,000 in Q3 last year to $1,605,000 for the comparable quarter this year. (Fig. 1.1)
- As predicted, with newly constructed luxury condos, such as Villa Valencia and the Park Grove properties, selling for over $1,000/Sq. Ft., this modest sub-market is no longer the most affordable in Miami overall. Giving up its position to Downtown Miami with a price of $711/Sq. Ft.
Coral Gables & Coconut Grove Luxury Condo Quarterly Price per Sq. Ft. 2017-2023 - Fig. 3
3. Q3 2023 Coral Gables & Coconut Grove Luxury Condo Days on Market Trends: Down QoQ, Up YoY
Days on market is up 47% year-over-year. Partly reflecting the overall Miami market trend of an increase in year-over-year days and flat quarter-over-quarter numbers, Coral Gables & Coconut Grove (collectively) reported the following days on market statistics in Q3 2023:
- Luxury condos spent 5 more days on the market compared to the previous quarter. (Fig. 4)
- On a year-over-year basis, luxury condos spent 20 extra days on the market (DOM) compared to Q3 2022, which is an increase of 47% year-over-year.
- At 63 days, luxury properties sold at a swifter pace in this collective neighborhood, considering the third quarter is expected to be slower, further indicating healthy buyer-seller communication.
Coral Gables & Coconut Grove Luxury Condo Quarterly Days on Market 2018-2023 – Fig. 4
4. Q3 2023 Coral Gables & Coconut Grove Luxury Condo Inventory Trends: Lowest in Miami, Balanced Market
Q3 2023 closed with 9 months of inventory. Owing to exceptionally high market momentum for the last year, inventory levels increased slightly compared to the previous quarter. Echoing the overall Miami trend for inventory, luxury condos in the combined neighborhood of Coral Gables & Coconut Grove also reported an increase in year-over-year, as well as quarter-over-quarter stats:
- On a quarter-over-quarter basis, inventory was up from 8 months in June this year to 9 months in September 2023 – posting a 12.5% increase.
- On a year-over-year basis, inventory was up from 5 months in September 2022 – reporting an 80% increase from a year ago, one of its lowest points in our 7-year study. (Fig. 5)
- At 9 months, Coral Gables and Coconut Grove continued reporting the lowest levels of inventory of all Miami neighborhoods under our review, as they did in Q2 2023.
Considering inventory fell within the 9 to 12-month range of a balanced market, the combined neighborhood of Coral Gables & Coconut Grove continued offering buyers and sellers equal value and opportunities. This dynamic pairing was also one of the first sub-markets to shift back into a balanced position at the beginning of the year – keeping the market stable with healthy competition through most of 2023.
Coral Gables & Coconut Grove Luxury Condo Months of Inventory from Mar. 2019 to Sep. 2023 - Fig. 5
A balanced market has 9 to 12 months of inventory. The months of inventory are calculated as no. of active listings + no. of pending listings divided by the average number of deals in the last six months.
5. Q3 2023 Coral Gables & Coconut Grove Luxury Condo Market Conclusion
With an above-average third quarter, this historically significant submarket trumped all market expectations. Leading sales growth stats compared to the Miami Beach or Greater Downtown groupings, this modest market appears to be slowly climbing in the popularity charts in Miami.
Boosted by exceptional sales performance, the 12-month sales trendline maintained its positive trajectory from Q2 to Q3 2023, showing signs of a market poised for robust growth. With the fourth quarter also known to be one of the softest (as per historical data), we, as luxury real estate experts, still anticipate the market to close 2023 on a high note.
On the price front, the price per square foot increased 14.6% year-over-year, reporting the highest gains of all the Miami neighborhoods under review. At $869/Sq. Ft., sellers continued receiving top dollar for their luxury condos in Coral Gables and Coconut Grove, as prices hit their second-highest peak of all time.
Almost in line with the overall Miami trend of higher year-over-year days on market, Coral Gables & Coconut Grove also reported an uptick, still keeping the market on its toes as luxury condos took only 63 days to sell.
Coral Gables & Coconut Grove (collectively) closed Q3 2023 as a balanced market, in line with the overall Miami market trend. Again, with the lowest levels of inventory (9 months) of all Miami neighborhoods under our review, this combined neighborhood cemented its status as one of the most dynamic sub-markets in Miami. As expected of a balanced market, buyers and sellers continued enjoying equal footing in terms of negotiations and value.
As real estate experts, we expect the following factors to influence market trends going into the final quarter of 2023:
- With a growing business environment supporting our economy and job market, we expect more high-earning young professionals to fuel demand for luxury housing in Miami.
- Following the likes of Lionel Messi and Jeff Bezos setting up homes in Magic City, more high-net-worth and ultra-high-net-worth buyers are expected to be drawn to our tax-friendly shores which are also known to offer an exceptional quality of life.
- As our newest batch of short-term-rental-friendly and branded preconstruction luxury condos go under construction, we expect a larger pool of investors to be attracted to our growing market.
- More wellness-minded families and individuals are expected to turn to our sunny shores to enjoy the year-round warmth, exciting natural trails, and outdoor fitness initiatives, which are conducive to a healthy and active lifestyle.
- For this dynamic pairing, we also expect limited pre-construction deliveries (in immediate cycles) and stable buyer demand to keep the market balanced.
Do you have questions or comments about the stats? Or would like more info on Miami condos? Contact Sep at sniakan@blackbookproperties.com or call 305-725-0566.
Don't forget to share our blog and subscribe (see the subscribe link on the top menu) to receive the latest Miami condo market news in your inbox.
Share your thoughts with us

Your Miami Condo Awaits
Recent Posts


 (305) 697-7667
 (786) 321-7233
  contact@condoblackbook.com

