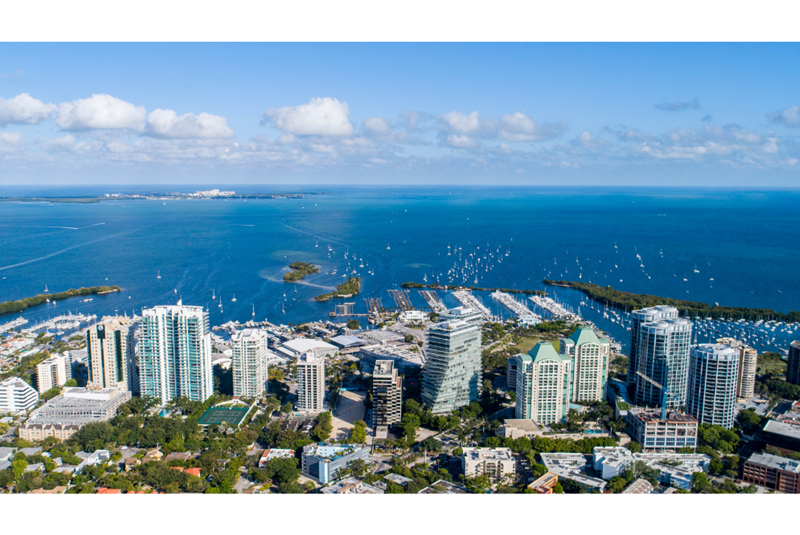
Q2 2023 Miami Luxury Condo Market Summary: High Season Brings Market Stability
Jul 14, 2023 July 14, 2023
With high season coming to an end, Miami’s luxury condo market shifted into a balanced position in Q2 2023 for several key stats – offering buyers and sellers equal value and opportunity.
As predicte in our Q1 2023 summary report, Spring (typically high season) ushered in stability for Miami’s luxury condo market. Powered by peak season momentum and stable prices, inventory settled back into an optimal range, bringing the market to equilibrium. And, while sales volume might not be on par with the record highs noted during 2021 and 2022, the Miami real estate market did move at a healthy pace, showing signs of great health, especially in light of national real estate market trends.
Indeed, bucking national housing trends, Miami’s luxury condo market set a new standard of resilience this second quarter. With volumes above pre-pandemic levels and zero compromises on prices, Miami emerged as one of the few U.S. cities to evade the current housing decline. Add to that a range of waterfront to branded housing options, incredible outdoors, a thriving business environment, plus an international quality of life, and it’s no wonder Miami’s real estate appeal is at an all-time high.
— What’s the Q2 2023 Miami Real Estate Market Take-away?
The take-away? As expected, high season took a considerable amount of inventory off the market this second quarter – shrinking it down to 12 months from 17 months in Q1 2023. With inventory within the ideal 9-12-month range, Miami’s in a balanced position, offering buyers and sellers a level playing field in terms of negotiation and housing value.
Moving into the third quarter of 2023, as real estate experts, we expect Miami’s luxury condo market to slow down (as it typically does every year), but still adhere to its growth thresholds as well as keep inventory levels in check. And we expect the second half of 2023 to stay as a balanced market.
— Key Statistics for Q2 2023
Q2 2023 Overall Miami Luxury Condo Market
- Closed Sales: 424
- Year-over-Year Change in Closed Sales: -45.1% (424 vs 772 sales in Q2 2022)
- Quarter-over-quarter Change in Closed Sales: 12.2% (424 vs 378 sales in Q1 2023)
- Median Sales Price: $1.6M
- Change in Median Sales Price: Mostly Flat (-2.3% / Q2 2023 vs Q2 2022)
- Change in Median Sales Price: Mostly Flat (-2.3% / Q2 2023 vs Q2 2022)
- Luxury Condo Inventory: 12 months
Q2 2023 MIAMI LUXURY CONDO QUARTERLY MARKET SUMMARY
| Number of Sales | % change in Sales | Median Sale Price | % change in Median Sale Price | Median SP/SqFt | % change in Median SP/SqFt | Median Days On Market |
Q2 2023 | 424 | -45.1% | $1,599,500 | -2.3% | $950 | 2.8% | 72 |
Q2 2022 | 772 | $1,637,500 | $925 | 56 |
Read on for a closer look into a neighborhood breakdown of our quarterly findings for Q2 2023:
For the purpose of this Miami luxury condo market report, we've only included properties priced $1 million and above. The neighborhoods included in this market summary include Downtown Miami, Edgewater, Wynwood, Midtown and the Design District, Brickell, Coconut Grove, Coral Gables, Key Biscayne, Miami Beach, Fisher Island, Surfside and Bal Harbour, and Sunny Isles Beach.
— Q2 2023 - Miami Luxury Condo Market Sales Statistics
Overall sales down -45.1% from a record-high Q2 in 2022
With 424 sales, Q2 2023 numbers appear to have taken a big hit at first glance, considering volumes dropped 45.1% year-over-year. However, what needs to be taken into perspective is that Q2 last year and Q2 2021, both, reported the highest quarterly numbers in the history of luxury condo sales, up to 776 and 772 closed sales respectively.
Considering Q2 2023 sales are still higher compared to pre-pandemic years (Q4 2020 and earlier), Miami’s typical high season cycle definitely delivered. Comparing quarter to quarter, volumes were 12.2% higher than in Q1 2023 (378 sales), again indicative of strong buyer demand.
All these statistics combined, show that Miami’s luxury condo market closed the second quarter on a robust note, maintaining the growth and momentum garnered over the past two years of booming sales.
Q2 2023 Miami Real Estate Market - Neighborhood Sales at a Glance
Neighborhood | Q2 2023 | Q2 2022 | % Change |
Greater Downtown Miami* | 133 | 234 | -43.2% |
Miami Beach** | 243 | 446 | -45.5% |
Coconut Grove & Coral Gables | 48 | 92 | -47.8% |
*Greater Downtown Miami is inclusive of Edgewater, Brickell & Downtown
**Miami Beach is inclusive of South Beach, Mid-Beach, North Beach, Surfside & Bal Harbour, Sunny Isles & Fisher Island.
Looking into a broader, neighborhood-wise sales comparison (above), Greater Downtown Miami (GDM) emerged as the most resilient market of Q2 2023 - reporting a 43.2% setback in year-over-year sales. On the other hand, the combined neighborhood of Coconut Grove & Coral Gables showed maximum impact with a 47.8% dip in year-over-year sales – a stark contrast from being the most resilient neighborhood in the previous quarter.
A closer look at the sub-markets shows that in GDM, Brickell topped popularity charts in Q2 2023 – leading market growth with the least setback in year-over-year sales (83 in Q2-23 vs. 138 in Q2-22). On the other hand, Sunny Isles Beach again reported the highest sales volume of all neighborhoods under review, closing the second quarter with 92 total sales. (Watch for more details in our in-depth, Q2 2023 market report for overall Miami.)
With momentum steadily building up over the first two quarters of the year, the 12-month sales trendline, for the overall Miami market, expectedly shifted into a positive trajectory after two quarters of posting a negative curve. All Miami neighborhoods in our analysis also reported a positive 12-month trendline. This indicates that even though the third quarter might come up soft (a trend noted from historical data analysis), we can expect the market to keep its momentum, with ample buyer demand keeping inventory levels within a balanced range.
— Q2 2023 - Miami Luxury Condo Market Price Statistics
Q2 2023 Price/SF up 2.8% to $950/SF
Continuously bucking national trends, prices continued to increase, staying in positive territory for Miami’s luxury condo market. The overall market closed Q2 2023 with a slight uptick in year-over-year Price per Square Foot. A majority of the Miami neighborhoods under our review too contributed to the statistic, either reporting gains or a flat price year-over-year.
Interestingly, luxury condos in the combined neighborhood of Coconut Grove & Coral Gables closed Q2 2023 with the highest percentage increase in year-over-year Price per Square Foot. Prices in this sub-market increased from $757 in Q2-22 to $999 in Q2-23 – reporting a massive 32% gain year-over-year as well as exiting its position as one of the more affordable neighborhoods for luxury condos. (Find more details in our upcoming, in-depth neighborhood reports for Q2 2023.)
Undoubtedly, Fisher Island continued as the most expensive zip code for luxury condos in Miami with a median price of $1,803 per square foot. On the other hand, Downtown Miami remained the most affordable neighborhood in Q2 2023, reporting a median price of $743 per square foot.
Q2 2023 Price per Square Foot at a Glance
Neighborhood | Q2 2023 | Q2 2022 | % Change |
Greater Downtown Miami* | $875 | $833 | +5.0% |
Miami Beach** | $1,040 | $1,112 | -6.5% |
Coconut Grove & Coral Gables | $999 | $757 | +32.1% |
*Greater Downtown Miami is inclusive of Edgewater, Brickell & Downtown
**Miami Beach is inclusive of South Beach, Mid-Beach, North Beach, Surfside & Bal Harbour, Sunny Isles & Fisher Island.
— Q2 2023 - Miami Luxury Condo Days on Market Statistics
Q2 2023 Days on Market up 28.6% from Q2 2023 – Luxury condos took average of 72 days to sell
Even with healthy sales momentum, luxury condos spent 16 extra days on the market – listing to closing – compared to a year ago (72 days in Q2-23 vs. 56 days in Q2-22). This could be, in part, due to the market shifting down to a more normal transaction pace compared to the record highs of Q2 2022, as well possibly fewer cash transactions. In 2022, Miami saw record numbers of all-cash purchases.
Most of the Miami neighborhoods, under our analysis, reported an uptick in the number of days luxury condos spent on the market before they were sold. Still, taking only 40 days to sell, the combined neighborhood of Surfside and Bal Harbour emerged as the fastest-selling market this quarter.
On the other hand, Fisher Island again reported the highest days on market this second quarter, as properties took 153 days on average to sell. But this is not unusual for the highly exclusive island community.
Q2 2023 Days on Market at a Glance
Neighborhood | Q2 2023 | Q2 2022 | % Change |
Greater Downtown Miami* | 80 | 56 | +42.9% |
Miami Beach** | 71 | 69 | Flat (+2.9%) |
Coconut Grove & Coral Gables | 58 | 22 | +163.6% |
*Greater Downtown Miami is inclusive of Edgewater, Brickell & Downtown
**Miami Beach is inclusive of South Beach, Mid-Beach, North Beach, Surfside & Bal Harbour, Sunny Isles & Fisher Island.
— Q2 2023 - Miami Luxury Condo Market Inventory Statistics
Overall Inventory at 12 months
Expectedly, as high season picked up pace, overall inventory dropped from 16 months in March to 12 months in June this year. Even though the statistic was 25% higher compared to 16 months in June last year, inventory closed within the 9-12-month range of an ideal market, making luxury condos an equally valuable investment for buyers as well as sellers.
Q2 2023 Inventory at a Glance
Neighborhood | Q2 2023 | Q2 2022 | % Change |
Greater Downtown Miami* | 13 | 8 | +62.5% |
Miami Beach** | 13 | 6 | +116.7% |
Coconut Grove & Coral Gables | 8 | 4 | +100% |
*Greater Downtown Miami is inclusive of Edgewater, Brickell & Downtown
**Miami Beach is inclusive of South Beach, Mid-Beach, North Beach, Surfside & Bal Harbour, Sunny Isles & Fisher Island.
Of all the neighborhoods under review, the combined neighborhood of Coconut Grove and Coral Gables reported the lowest months of inventory (8 months). On a sub-market level, within Miami Beach neighborhoods, South Beach as well as Surfside and Bal Harbour followed closeby (both at 11 months).
This, combined with what we’re seeing anecdotally, as real estate experts, we expect inventory levels to stay within a balanced range for the remainder of the year – keeping the market equally competitive for buyers as well as sellers.
— Q2 2023 Miami Neighborhood Luxury Condo Market Summary
As predicted in our Q1 2023 summary report, Spring (historically known to be high season for Miami’s cyclical market) swooped in with many positives for Miami’s luxury condo market.
Prices ticked up slightly to $950/SF, hovering close to the previous quarter’s all-time high of $964/SF.
Sales volumes stayed above pre-pandemic levels, boosted by demand from ultra-high-net-worth and high-net-worth individuals chasing South Florida’s economic boom down to our shores.
The Days on Market may have seasonally increased but were still lower compared to the previous quarter.
And, Inventory levels rebounded into a balanced position at 12 months after spiking shortly over the past two quarters.
— Q2 2023 Miami Luxury Housing Market Predictions
Fortifying its position as one of the leading real estate markets in the United States by posting stable prices and increasing rents, when most other cities are struggling, Miami’s luxury condo market finds itself in one of its most favorable cycles in recent history. Even with the next two quarters poised for a slowdown (given that late Summer is generally a slower season and early Fall is also sluggish for Miami’s seasonal market), as real estate experts, we expect the following factors to continue fueling demand for our international-grade luxury housing market:
- As a 2022 report by MiamiRealtor.com mentions that 2 out of every 3 Florida foreign buyers pay in cash, we do not expect Miami’s real estate market, where cash is king, to be disrupted by interest rates floating on the higher range.
- With a 2023 Knight Frank report cementing our status as the leading market for luxury branded properties in the U.S., offering high-end products such as the Bentley Residences or The St. Regis Residences, along with ample prospects for future growth and lucrative rental income opportunities, we expect more deep-pocketed buyers and high-net-worth investors to fly down to our sunny shores.
- Also, with Miami’s newfound status as the #2 Happiest and Healthiest City in the U.S., according to the annual Mindbody Wellness Index, in addition to the popularity of our sugar-sand beaches, nature-dominated landscape, and overall international-grade quality of life, we expect to continue attracting domestic as well as international buyers.
- With developers building more Class-A office projects and Miami continuously pulling in the best minds in tech and other sectors to our low tax, pro-business, startup-friendly shores, we expect steady demand for luxury housing from business magnates as well as well-compensated employees.
To stay tuned for our exclusive, in-depth analysis of the Q2 2023 luxury condo market in Miami, subscribe to this blog as we will soon be rolling out separate reports for the overall Miami market, Miami Beach, Greater Downtown Miami, and Coconut Grove plus Coral Gables (collectively).
If you have specific questions about this data, or want a market assessment of your property,
Share your thoughts with us

Your Miami Condo Awaits
Recent Posts


 (305) 697-7667
 (786) 321-7233
  contact@condoblackbook.com

