


While 2022 may not be a record-setting year like 2021, Miami's luxury condo market had its own set of accomplishments to report. Even with annual sales dipping 10.4% against a record year like 2021, data shows that 2022 closed with the second-highest sales recorded in a year – shutting down any rumors concerning Miami's luxury condo market following national trends of a housing crisis.
This, coupled with prices increasing by 8.4% per sq. ft., on an annual basis, plus the days on market declining in our 2022-over-2021 analysis shows that Miami's luxury condo market stayed in good health, in spite of a nationwide cool down.
Considering the last quarter of the year is known to report lower sales, due to the cyclical nature of the luxury housing market, Q4 2022 still reported the highest fourth quarter sales compared to any comparable quarter in pre-pandemic years. This, along with on-ground observations noted in the first month of 2023, leads us to expect that Miami's luxury condo market will pick up pace and move towards a stable position as we enter high season this spring.
A closer look at the neighborhoods revealed Downtown Miami was one of the hottest markets for luxury condos in Miami – reporting the highest percentage sales growth in Q4 2022, as well as on an annual basis. Further, Fisher Island reigned supreme, ranking as the "most expensive" neighborhood of 2022, maintaining its position as one of the most premium addresses in all of Miami.
Read on for a more detailed analysis of the annual and quarterly data on how prices, days on market, and inventory responded to strong buyer demand and more in our full-length Q4 2022 Miami Luxury Condo Market Report:
This luxury condo market report only includes data for properties priced $1 million and above, and covers the neighborhoods of Greater Downtown Miami (including Edgewater, Brickell, and Downtown), Miami Beach (inclusive of South Beach, Surfside, Bal Harbour, Sunny Isles Beach, and Fisher Island), as well as Coral Gables and Coconut Grove.
Overall Miami Luxury Condo Market Summary - 2022 |
||
Annual sales down -10.4% YoY-- luxury condo market stable against record-setting 2021 |
Overall luxury condo price/sq. ft. up by - 8.4% YoY |
Inventory at 17 months -- below pre-pandemic levels |
Overall Miami Luxury Condo Market Summary - Q4 2022 |
||
Quarterly sales down -52.2% YoY-- higher than any pre-pandemic 4Q |
Overall luxury condo price/sq. ft. up by5% YoY |
Inventory up YoY to17 months |
2022 - Overall Miami Luxury Condo Market Highlights (Annual)
- Second-highest annual sales ever – only 10.4% below record volume of 2021
- Downtown Miami and Brickell led annual sales growth in 2022-over-2021 analysis
- Overall Prices are up
- Fisher Island continued as the most expensive neighborhood of 2022 with a median price of $1,903 /sq. ft., followed by Surfside & Bal Harbour at $1,292/sq. ft.
- Fisher Island plus Surfside & Bal Harbour offered maximum value to sellers with a highest price per sq. ft. increase of 28% in 2022-over-2021 analysis
- Annual Days on Market declined in 2022-over-2021 analysis
- Coconut Grove and Coral Gables (combined) emerged as the fastest-selling market of 2022 out of all Miami neighborhoods, with luxury condos taking only 41 days to sell
- Coconut Grove and Coral Gables (combined) again reported the lowest year-end inventory (13 months) of all Miami neighborhoods
- Downtown Miami posted the highest year-end inventory (27 months) of all Miami neighborhoods
- 2022 closed as a buyer's market in theory, but offered sellers equal advantage at the table
Q4 2022 - Overall Miami Luxury Condo Market Highlights
- Downtown Miami emerged as Miami's most popular neighborhood of Q4 2022 - leading sales growth with a 22% increase year-over-year
- Q4 2022 sales down -52.2% year-over-year – still higher compared to any fourth quarter in pre-pandemic years
- 12-month sales trendline stays negative between Q3 2022 and Q4 2022
- Overall Prices reported mixed trends – Median Sales Price declined -9.6%, while Price per Sq. Ft. increased 5%, year-over-year to peak of $948/SF
- Fisher Island remained the most expensive neighborhood in Miami with a median price of $2,584/sq. ft. in Q4 2022
- Fisher Island luxury condos also offered maximum value to sellers with highest percentage growth (75%) in year-over-year Price per Sq. Ft., knocking off Surfside & Bal Harbour from top spot in Q3 2022
- Luxury condo buildings built 2000-2014 continued as the most popular with the highest sales volume (122) of all 3 segments (new construction to classic)
- Condos built before 2000 delivered the highest maximum return on investment (ROI)
- Days on Market down -4.2% year-over-year
- Inventory up 88.9% year-over-year to 17 months
- Market stable with equal opportunity for buyers and sellers
Table of Contents
- Overall Miami Luxury Condo Sales Trends
- Q4 2022 Miami Neighborhood Trends - Number of Sales
- Q4 2022 Overall Miami Luxury Condo Price Trends - Sales Price, Price/Square Foot
- Q4 2022 Miami Neighborhood Trends - Sales Price, Price/Square Foot
- Q4 2022 Overall Miami Luxury Condo Sales Price Trends by Building Year
- Q4 2022 Overall Miami Luxury Condo Days on Market Trends
- Q4 2022 Miami Neighborhood Trends - Days on Market
- Q4 2022 Overall Miami Luxury Condo Inventory Trends
- Q4 2022 Conclusion Overall Miami Luxury Condo Market
- Where does the Miami Luxury Condo Market go from Here?
— Q4 & 2022 Overall Miami Luxury Condo Sales Trends
|
Q4 2022 vs Q3 2022 Overall Miami Luxury Condo Market Summary - Fig. 1.1 |
|||||||
|
Quarters |
Number of Sales |
% change in Sales |
Median Sale Price |
% change in Median Sale Price |
Median Sp/Sqft |
% change in Median Sp/Sqft |
Median of DOM |
|
Q4-2022 |
269 |
-16.7% |
$1,600,000 |
3.2% |
$948 |
3.4% |
68 |
|
Q3-2022 |
323 |
$1,550,000 |
$917 |
62 |
|||
|
Q4 2022 vs Q4 2021 Overall Miami Luxury Condo Market Summary - Fig. 1.1a |
|||||||
|
Quarters |
Number of Sales |
% change in Sales |
Median Sale Price |
% change in Median Sale Price |
Median Sp/Sqft |
% change in Median Sp/Sqft |
Median of DOM |
|
Q4-2022 |
269 |
-52.2% |
$1,600,000 |
-9.6% |
$948 |
5.0% |
68 |
|
Q4-2021 |
563 |
$1,770,250 |
$903 |
71 |
|||
Q4 Sales down 52.2% year-over-year – Higher than any fourth-quarter pre-pandemic - Negative trendline
Considering the fourth quarter is one of the slowest (as per historical data) and continuing with the general slowdown noted this summer after 8 quarters of booming sales, Miami's luxury condo market reported a decline in year-over-year sales this Q4 2022. Still, speaking to the health and stability of the market, volumes were higher than any comparable quarter from pre-pandemic years:
- 4Q 2022 Sales Analysis – Overall Miami Luxury Condo Market
- Q4 2022 vs Q4 2021. Sales declined 52.2%, down from 563 in Q4 2021 to 269 for the same quarter 2022. (Fig. 1.1a)
- Q4 2022 vs Q3 2022. Sales decreased 16.7%, down from 323 in Q3 2022 to 269 in Q4 same year. (Fig. 1.1)
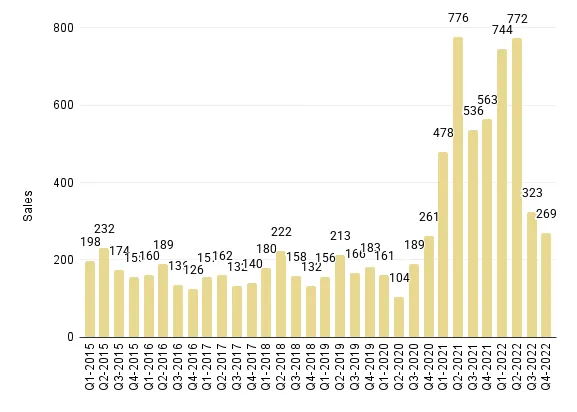
- Sales were still higher compared to any fourth-quarter numbers noted in 2020 or from before (Fig. 1.2) – showing market stability amidst a national slowdown.
As sales continued to decline for a second consecutive quarter, the 12-month sales trendline of Fig. 1.4 kept to its negative trajectory between Q3 and Q4 2022. While this would generally point towards a slowdown over the next quarter or so, as luxury condo experts, we expect the market to pace up as it approaches high season in winter/spring of 2023.
|
2022 vs 2021 Overall Miami Luxury Condo Annual Market Summary - Fig. 1.1.1 |
|||||||
|
Quarters |
Number of Sales |
% change in Sales |
Median Sale Price |
% change in Median Sale Price |
Median Sp/Sqft |
% change in Median Sp/Sqft |
Median of DOM |
|
2022 |
2108 |
-10.4% |
$1,680,000 |
-2.6% |
$932 |
8.4% |
68 |
|
2021 |
2353 |
$1,725,000 |
$860 |
91 |
|||
|
2022 vs 2020 Overall Miami Luxury Condo Annual Market Summary - Fig. 1.1.1a |
|||||||
|
Quarters |
Number of Sales |
% change in Sales |
Median Sale Price |
% change in Median Sale Price |
Median Sp/Sqft |
% change in Median Sp/Sqft |
Median of DOM |
|
2022 |
2108 |
194.8% |
$1,680,000 |
3.4% |
$932 |
21.2% |
68 |
|
2020 |
715 |
$1,625,000 |
$770 |
127 |
|||
Second-highest Annual Luxury Condo Sales Ever - Annual sales down only 10.4% versus record-setting 2021
Considering 2022 was up against a record-breaking year like 2021, Miami's luxury condo market showed resilience amidst a national slowdown, closing strong due to a record-high first quarter and booming second quarter:
- Annual Sales Analysis – Overall Miami Luxury Condo Market
- 2022 vs 2021. Sales decreased 10.4%, down from 2,353 annual sales in 2021 to 2,108 in 2022. (Fig. 1.1.1)
- 2022 vs 2020. Sales jumped 194.8%, up from 715 annual sales in 2020 to 2,108 in 2022. (Fig. 1.1.1a)
- Showing exceptional growth and progress compared to the pre-pandemic market, annual sales in 2022 were, again, much higher than those recorded in 2019 (719 annual sales), 2018 (692 annual sales), and before. (Fig. 1.2)
Overall Miami Quarterly Luxury Condo Sales 2015 - 2022 - Fig. 1.2
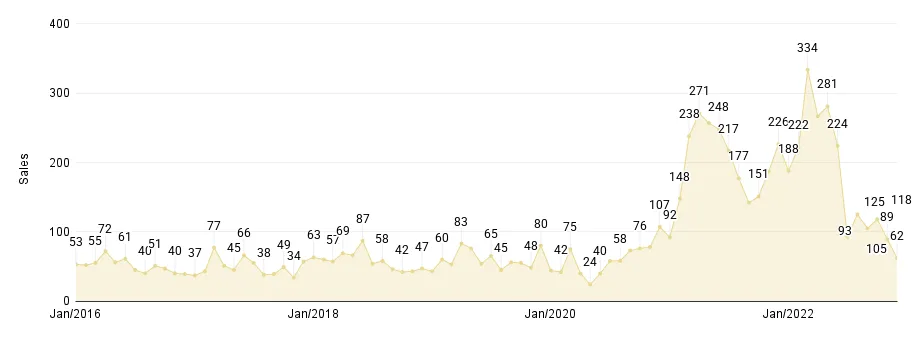
Overall Miami Monthly Luxury Condo Sales Jan. 2016 to Dec. 2022 - Fig. 1.3
Overall Miami 12-Month Luxury Condo Sales with Trendline - Fig. 1.4

—Annual & Q4 2022 Miami Neighborhood Trends - Number of Sales
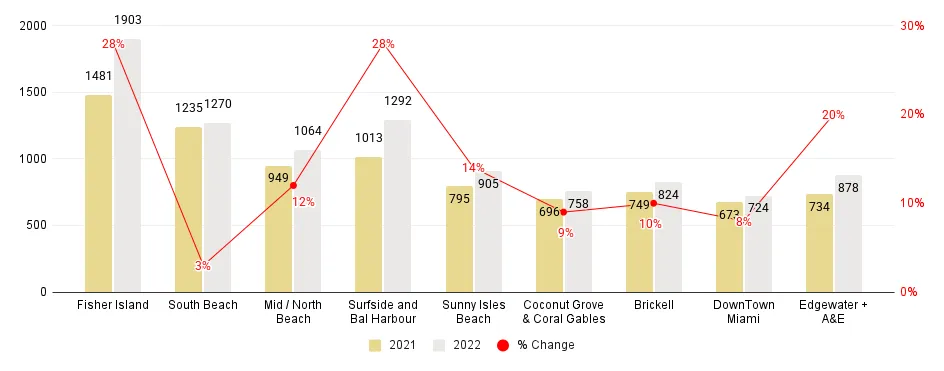
Annual Miami Neighborhood Luxury Condo Sales Comparison 2022-over-2021 - Fig. 1.5
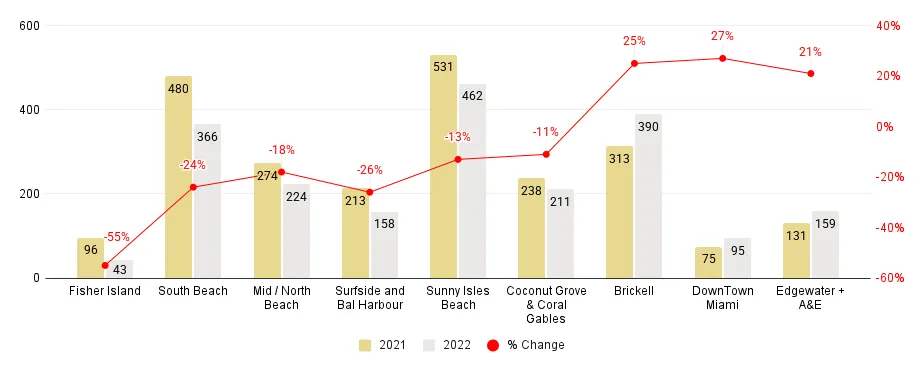
2022-over-2021 - Annual Neighborhood Sales Trends (Fig. 1.5)
- Winners: Downtown Miami (27%) and Brickell (25%) reported positive and highest percentage sales growth compared to 2021
- Up: Edgewater reported a 21% increase in annual sales
- Down: Other Miami neighborhoods reporting a decrease in annual sales:
- Coconut Grove & Coral Gables (-11%)
- Sunny Isles Beach (-13%)
- Mid/North Beach (-18%)
- South Beach (-24%)
- Surfside & Bal Harbour (-26%)
- Fisher Island (-55%)
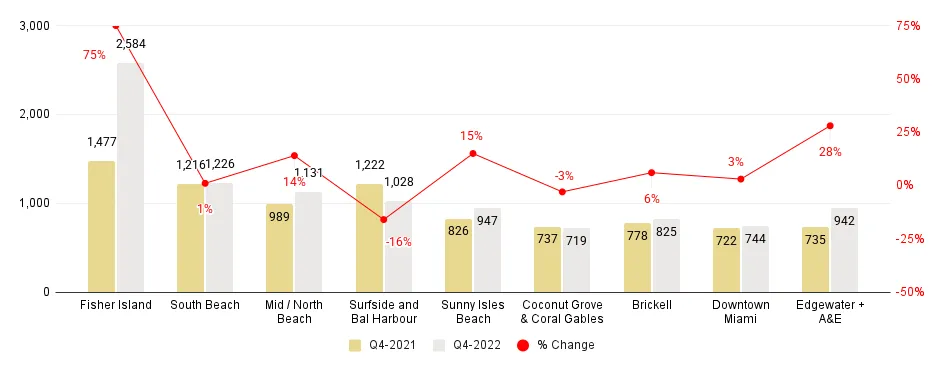
Miami Neighborhood Luxury Condo Sales Comparison 4Q22-over-4Q21 - Fig. 1.5.1
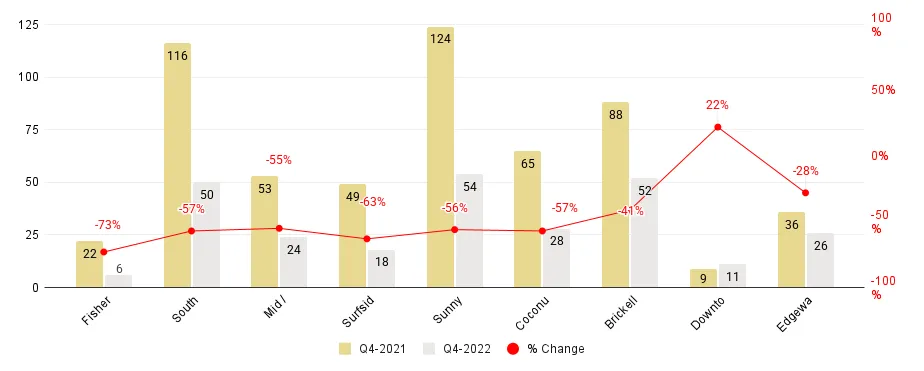
Q4 2022 Year-over-Year Neighborhood Sales Trends (Fig. 1.5.1)
- Winner: Downtown Miami reported the highest percentage (22%) growth in year-over-year sales
- Down: All other Miami neighborhoods reported a decrease in year-over-year sales:
- Edgewater (-28%)
- Brickell (-41%)
- Mid/North Beach (-55%)
- Sunny Isles Beach (-56%)
- South Beach (-57%)
- Coconut Grove & Coral Gables (-57%)
- Surfside and Bal Harbour (-63%)
- Fisher Island (-73%)
More in-depth analysis and details are available in dedicated reports for Greater Downtown Miami, Miami Beach and the Barrier Islands, plus Coral Gables & Coconut Grove.
—Overall Miami Luxury Condo Prices Up - Annual + YoY
|
2022 vs 2021 Overall Miami Luxury Condo Annual Market Summary - Fig. 1.1.1 |
|||||||
|
Quarters |
Number of Sales |
% change in Sales |
Median Sale Price |
% change in Median Sale Price |
Median Sp/Sqft |
% change in Median Sp/Sqft |
Median of DOM |
|
2022 |
2108 |
-10.4% |
$1,680,000 |
-2.6% |
$932 |
8.4% |
68 |
|
2021 |
2353 |
$1,725,000 |
$860 |
91 |
|||
Annual Price/Sq. Ft. up to $932, Median Price flat
Owing to a seller-friendly market and stable demand, prices mostly trended upwards in 2022:
Annual Median Price Trends (Fig. 1.1.1 & 1.1.1a) – Overall Miami Luxury Condo Market
- 2022 vs 2021. Price per Square Foot increased by 8.4%, up from $860 in 2021 to $932 in 2022.
- Median Sales Price stayed mostly flat, reporting a marginal adjustment of -2.6%, down from $1,725,000 in 2021 to $1,680,000 in 2022.
- 2022 vs 2020. Price per Square Foot increased by 21.2%, up from $770 in 2020 to $932 in 2022.
- Median Sales Price too increased by 3.4%, up from $1,625,000 in 2020 to $1,680,000 in 2022.
Q4 2022 Price per Sq. Ft. peaked to record $948, Median Price down -9.6% Year-over-Year
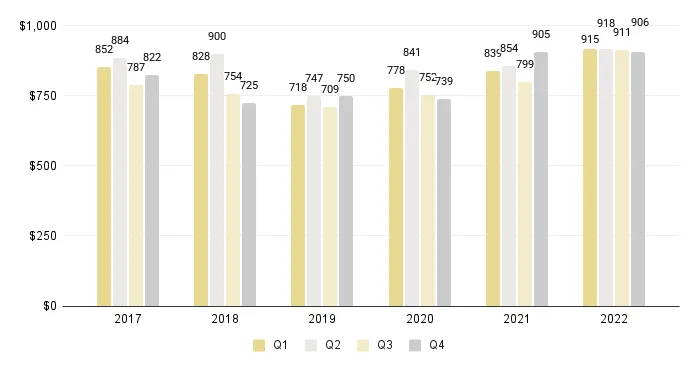
Closing the year with the highest Price per Square Foot ever recorded (Fig. 2.1), Q4 2022 posted a new peak of $948/square foot.
Overall Miami Luxury Condo Quarterly Price per Sq. Ft. 2017-2022 - Fig. 2.1
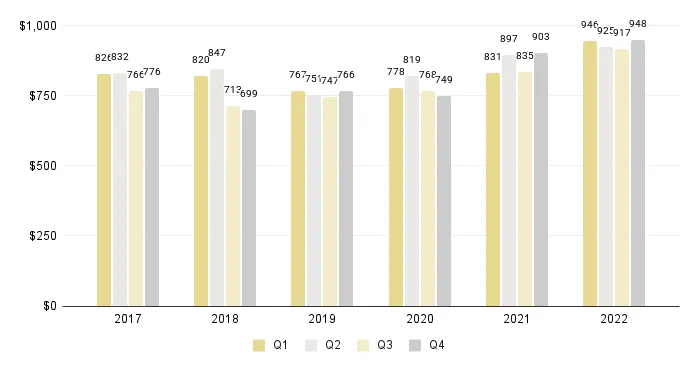
4Q 2022 Median Price Trends (Fig. 1.1 & 1.1a) – Overall Miami Luxury Condo Market
- Q4 2022 vs Q4 2021. Price per Square Foot increased by 5%, up from $903 in Q4 2021 to $948 for same quarter 2022.
- Median Sales Price decreased by 9.6%, down from $1,770,250 in Q4 2021 to $1,600,000 for the same quarter 2022.
- Q4 2022 vs Q3 2022. Price per Square Foot increased by 3.4%, up from $917 in Q3 2022 to $948 in Q4 2022.
- Median Sales Price too increased by 3.2%, up from $1,550,000 in Q3 2022 to $1,600,000 in Q4 2022.
—Q4 2022 Miami Neighborhood Trends - Price per Square Foot & Sales Price
2022-over-2021 - Annual Neighborhood Price Trends
Median Price per Square Foot (Fig. 2.2)
- Winner: Fisher Island continued as the most expensive neighborhood in Miami, fetching a median price of $1,903/sq. ft., followed by Surfside & Bal Harbour at $1,292/sq. ft.
- Winner: Fisher Island plus Surfside & Bal Harbour, both reported the highest percentage growth in annual Median Price per Square Foot (28%)
- Up: Other neighborhoods posting an increase in annual Median Price per Square Foot:
- Edgewater (20%) to $878/SF
- Sunny Isles Beach (14%) to $905/SF
- Mid/North Beach (12%) to $1,064/SF
- Brickell (10%) to $824/SF
- Coconut Grove & Coral Gables (9%) to $758/SF
- Downtown Miami (8%) to $724/SF
- Flat: South Beach luxury condos reported a negligible change (3%) in their 2022-over-2021 Price per Square Foot
Miami Neighborhood 2022-over-2021 Median Price per Sq. Ft. Comparison - Fig. 2.2
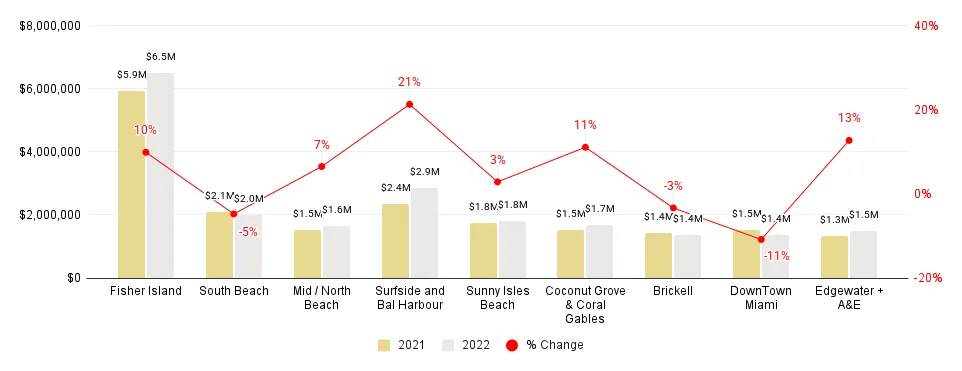
Median Sales Price (Fig. 2.3)
- Winner: Surfside & Bal Harbour (collectively) reported the highest percentage growth in its annual Median Sales Price (21%) at $2.9 million
- Winner: Fisher Island again reported the highest Median Sales Price for 2022 at $6.5 million, keeping its position as the most expensive neighborhood in Miami
- Up: Other neighborhoods reporting an increase in annual Median Sales Price:
- Edgewater (13%)
- Coconut Grove & Coral Gables (11%)
- Fisher Island (10%)
- Mid/North Beach (7%)
- Flat: Sunny Isles Beach (3%) and Brickell (-3%) reported a negligible change in their 2022-over-2021 Median Sales Price
- Down: Neighborhoods reporting a decline in annual Median Sales Price:
- South Beach (-5%)
- Downtown Miami (-11%)
Miami Neighborhood 2022-over-2021 Median Sales Price Comparison - Fig. 2.3
Q4 2022 - Year-over-Year Miami Neighborhood Luxury Condo Price Trends
Median Price per Square Foot (Fig. 2.2.1)
- Winner: Fisher Island remained the most expensive neighborhood in Miami by closing Q4 at a median price of $2,584/sq. ft.
- Winner: Fisher Island also reported the highest percentage growth of 75% in year-over-year Price per Square Foot
- Up: Other neighborhoods reporting an increase in year-over-year Median Price per Square Foot:
- Edgewater (28%) to $942/SF
- Sunny Isles Beach (15%) to $947/SF
- Mid/North Beach (14%) $1,131/SF
- Brickell (6%) to $825/SF
- Flat: South Beach (1%), Downtown Miami (3%), and Coconut Grove & Coral Gables (-3%) reported negligible changes in their year-over-year Median Price per Square Foot
- Down: Surfside & Bal Harbour reported a -16% decline in year-over-year Price per Square Foot
Miami Neighborhood 4Q22-over-4Q21 Median Price per Square Foot. Comparison - Fig. 2.2.1
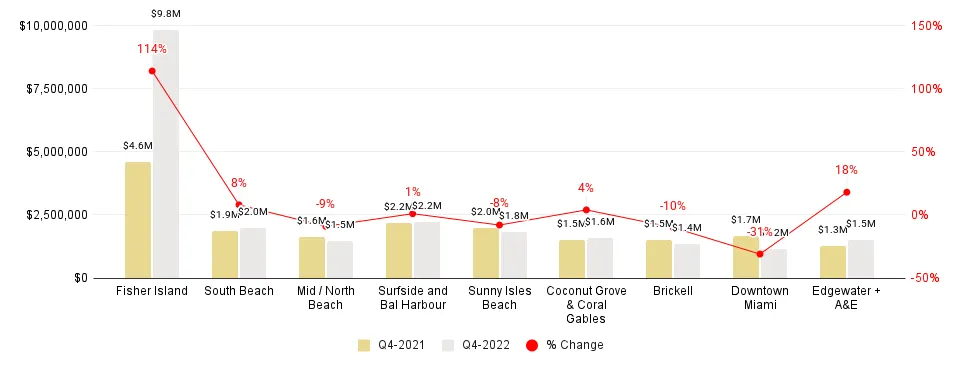
Median Sales Price (Fig. 2.3.1)
- Winner: Fisher Island reported the highest percentage growth in year-over-year Median Sales Price at 114%
- Winner: Fisher Island continued reporting the highest Median Sales Price at $9.8 million – holding onto its crown as the most premium zip code in Miami
- Up: Other neighborhoods reporting an increase in year-over-year Median Sales Price:
- Edgewater (18%) to $1.5 million
- South Beach (8%) to $2.0 million
- Coconut Grove & Coral Gables (4%) to $1.6 million
- Flat: Surfside & Bal Harbour reported negligible change of 1% in its year-over-year Median Sales Price
- Down: Neighborhoods reporting a decline in annual Median Sales Price:
- Downtown Miami (-31%)
- Brickell (-10%)
- Mid/North Beach (-9%)
- Sunny Isles Beach (-8%)
Miami Neighborhood 4Q22-over-4Q21 Median Sales Price Comparison - Fig. 2.3.1
—Q4 2022 Overall Miami Luxury Sales Price Trends by Building Year
Below is a detailed analysis of how Miami luxury condo buildings performed in Q4 2022 on the basis of age of construction of the condo building, categorized as new construction buildings (2015-2021), buildings built from 2000-2014, and pre-2000 buildings.
- New Construction Buildings reported second-highest fourth-quarter sales to-date + good year-over-year value with a 7% price gain
- Buildings Dated 2000-2014 continued being the most popular with the highest sales volume (122) of all 3 segments under review + flat year-over-year value with a price of $906/sq. ft.
- Condos Built before 2000 reported a year-over-year decline but highest sales volumes compared to any pre-pandemic fourth-quarter + continued offering the best value to sellers with a 10.3% increase in year-over-year value
Miami New Construction Condos Built 2015-2021
Echoing the overall trend, this freshly-built segment posted its second-highest sales in a fourth quarter to-date, even with sales activity declining over the past two quarters (Fig. 3.1). Volumes declined from 184 sales in Q4 2021 to 93 sales in the same quarter 2022 – reporting a 49.5% year-over-year decrease against a record year. On the other hand, volume was higher than fourth quarter sales noted in 2020 or pre-pandemic.
Not to mention, most pre-construction luxury condo projects in Miami have been selling before breaking ground. Many of these pre-construction sales are not recorded in centralized databases and thus, are not included in our quarterly sales data and reports.
Quarterly Overall Miami Luxury Condo Sales for Buildings Dated 2015-2022 - Fig. 3.1
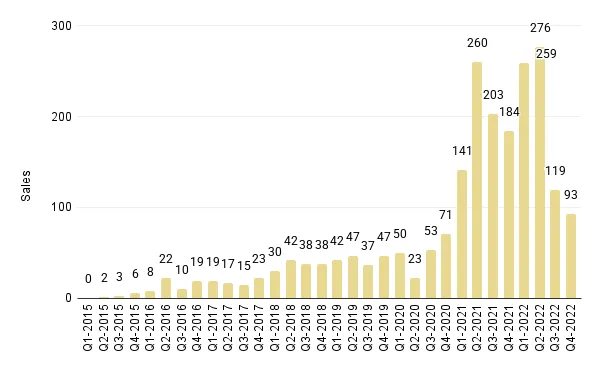
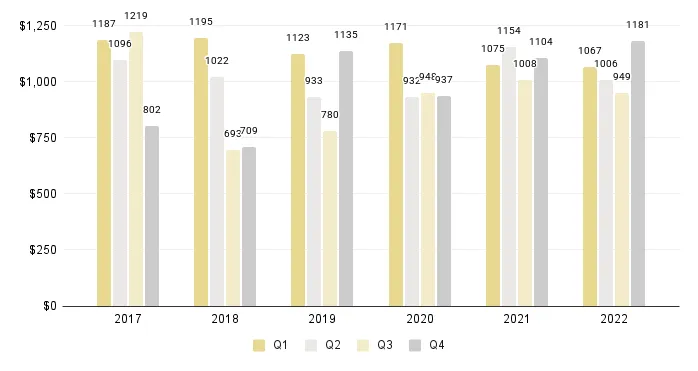
Fig. 3.2 reveals the Price per Square Foot for this newly-built segment increased 24.5% quarter-over-quarter as well as 7% year-over-year. Closing the quarter at $1,181/sq. ft., luxury condo sellers in this segment continued receiving great value compared to a record year like 2023, as prices closed in the higher ranges.
Miami New Construction Luxury Condo Price per Square Foot (Buildings Built 2015-2022) - Fig. 3.2
Miami Luxury Condos Built 2000-2014
Luxury condos built 2000-2014 reported a 52.2% decline in year-over-year sales, down from 255 sales in Q4 2021 to 122 sales in the same quarter 2022.
Still, much like Q3 2022, buildings built 2000-2014 were found to be the most popular among buyers in Q4 2022, reporting the highest sales volume of all 3 segments under review.
Quarterly Overall Miami Luxury Condo Sales (Buildings Dated 2000-2014) - Fig. 3.3
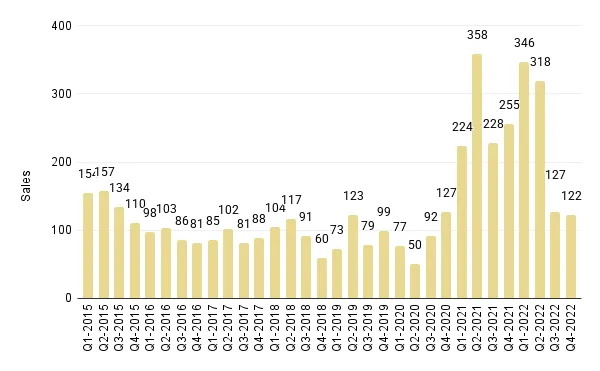
Fig. 3.4 below shows the Price per Square Foot stayed mostly flat quarter-over-quarter as well as year-over-year for luxury condos built 2000-2014. Closing the quarter at $906/sq. ft., prices in this segment remained stable, offering luxury condo sellers fair value for their properties.
Overall Miami Luxury Condo Price per Sq. Ft. (Buildings Dated 2000-2014) - Fig. 3.4
Miami Luxury Condos Built Before 2000
Miami's older luxury buildings (built pre-2000) too reported a 54.2% decline in year-over-year sales, down from 118 sales in Q4 2021 to 54 sales in the same quarter 2022 – much in sync with the overall market mood.
However, sales volumes in this classic segment were higher than any fourth quarter numbers noted pre-pandemic (2019 and earlier).
Quarterly Overall Miami Luxury Condo Sales (Buildings Dated 1921-1999) - Fig. 3.5
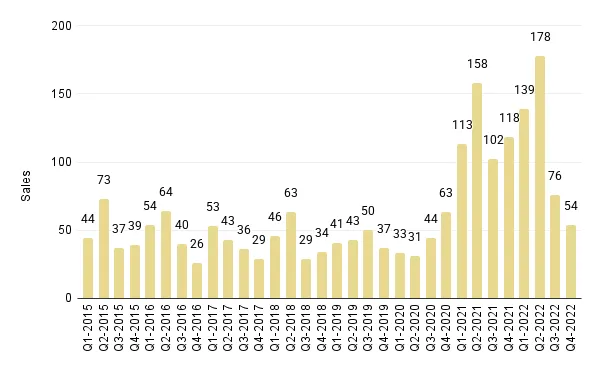
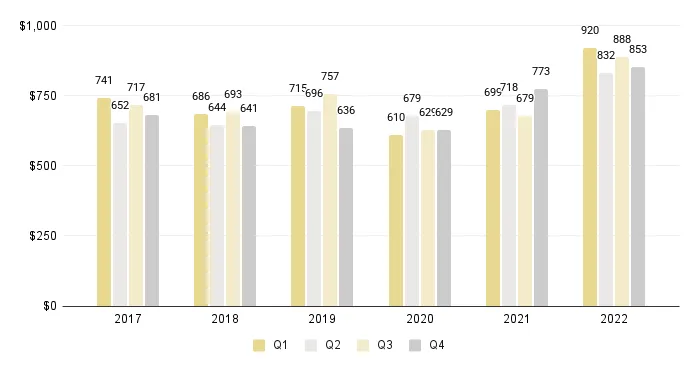
Fig. 3.6 below reveals the Price per Square Foot decreased 4% quarter-over-quarter but increased 10.3% year-over-year for luxury condos built before 2000. Closing the quarter at $853/sq. ft., luxury condo sellers in this classic built segment again received the best year-over-year value of all 3 segments under review.
Overall Miami Luxury Condos Price per Sq. Ft. (Buildings Dated 1921-1999) - Fig. 3.6
—Q4 2022 Overall Miami Luxury Condos - Days on Market Down Annually + YoY
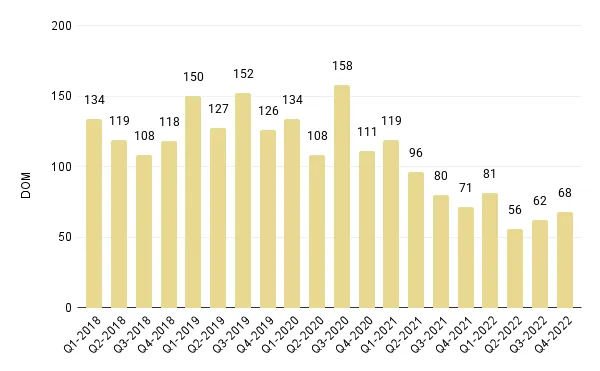
Days on Market down -25.3% on annual basis and -4.2% 4Q22-over-4Q21
Even with sales slowing down over the last two quarters of 2022, Days on Market (DOM) values dropped consistently – showing that buyer-seller communication stayed healthy. By year-end 2022, luxury condos took only about 2 months to be sold – a nod to good market health.
- Annual Days on Market Analysis – Overall Miami Luxury Condo Market
- 2022 vs 2021. Days on Market declined 25.3%, showing luxury condos spent 23 fewer days on the market compared to 2021. (Fig. 1.1.1)
- 2022 vs 2020. Days on Market dropped 46.5%, showing luxury condos spent 59 fewer days on market compared to 2020. (Fig. 1.1.1a)
- 4Q 2022 Days on Market Analysis – Overall Miami Luxury Condo Market
- Q4 2022 vs Q4 2021. DOM declined 4.2%, showing luxury condos spent 3 less days on market compared to Q4 2021. (Fig. 1.1a)
- Q4 2022 vs Q3 2022. DOM increased 8.8% to 68 days, showing luxury condos spent just 6 extra days on market compared to the previous quarter. (Fig. 1.1)
Overall Miami Luxury Condo Quarterly Days on Market 2018 - 2022 - Fig. 4.1
—Q4 2022 Miami Neighborhood Trends - Days on Market
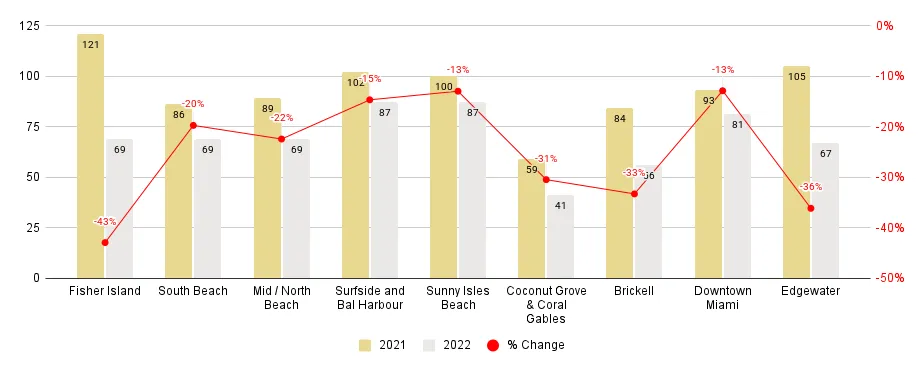
2022-over-2021 Annual Neighborhood Days on Market Trends (Fig. 4.2)
- Winner: Coconut Grove & Coral Gables (combined) remained the fastest-selling market of 2022 in Miami, much like in 2021, with luxury condos taking only 41 days to sell.
- Down: All Miami neighborhoods reported a decline in their annual Median Days on Market for luxury condos:
- Fisher Island (-43%)
- Edgewater (-36%)
- Brickell (-33%)
- Coconut Grove & Coral Gables (-31%)
- Mid/North Beach (-22%)
- South Beach (-20%)
- Surfside & Bal Harbour (-15%)
- Sunny Isles Beach (-13%)
- Downtown Miami (-13%)
Miami Neighborhood 2022-over-2021 Days on Market Comparison - Fig. 4.2
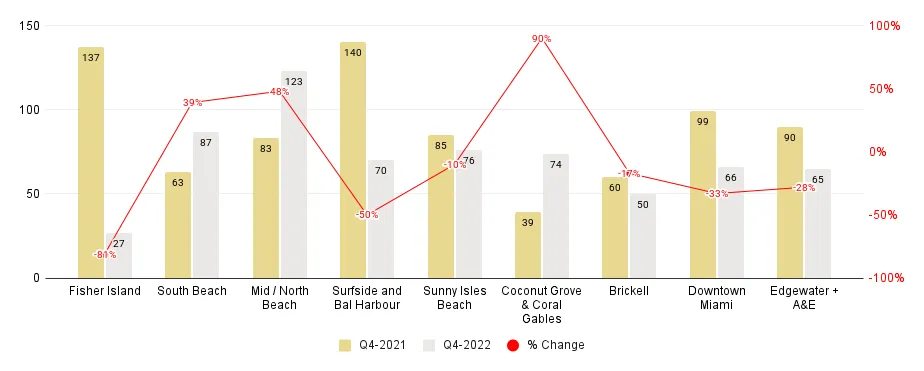
Q4 2022 Year-over-Year Neighborhood Days on Market Trends (Fig. 4.2.1)
- Winner: Fisher Island emerged as the fastest-selling market of Q4 2022 in Miami, with luxury condos taking only 27 days to sell.
- Down: Majority of the neighborhoods posted a decline in their Median Days on Market for luxury condos in Miami:
- Fisher Island (-81%)
- Surfside & Bal Harbour (-50%)
- Downtown Miami (-33%)
- Edgewater (-28%)
- Brickell (-17%)
- Sunny Isles Beach (-10%)
- Up: Neighborhoods reporting an increase in their Median Days on Market:
- Coconut Grove & Coral Gables (90%)
- Mid/North Beach (48%)
- South Beach (39%)
Miami Neighborhood 4Q22-Over-4Q21 Days on Market Comparison - Fig. 4.2.1
—Q4 2022 Miami Luxury Condo Inventory at 17 months
Q4 2022 closed with 17 months of inventory
After months of booming sales and record closings, as Miami's luxury condo market cooled off over Q3 and Q4 2022 (also typically low season), it was quite expected of inventory levels to climb up. Closing the year with 17 months of inventory, the trend closed above the 9-12-month range of a balanced market, indicating a buyer's market – in theory at least.
Considering Miami's luxury condo market is cyclical in nature, it is quite normal to see inventory levels rising towards the tail-end of the year, as more sellers tend to list their units in anticipation of the upcoming high season. This, coupled with about two quarters of slowing sales; it was inevitable that inventory levels would close above previous year lows.
So, as 2022 closed with 17 months of inventory, we, as real estate experts, do not read this as a solid buyer's market. Instead, we read it as a leveled playing field, where buyers and sellers have equal opportunity at the table.
- On an annual basis, inventory was up from 9 months in December 2021 to 17 months by year-end 2022 – reporting a decline of 88.9%. (Fig. 5.1).
- On a quarter-over-quarter basis, inventory increased from 9 months in September 2022 to 17 months in December – again posting a decline of 88.9%.
Considering high season is just around the corner and with consistent demand (anecdotally), we, as real estate experts, expect inventory levels to normalize over the summer – leaving us with a balanced market through 2023.
Overall Miami Months of Luxury Condo Inventory from Mar. 2019 to Dec. 2022 - Fig. 5.1
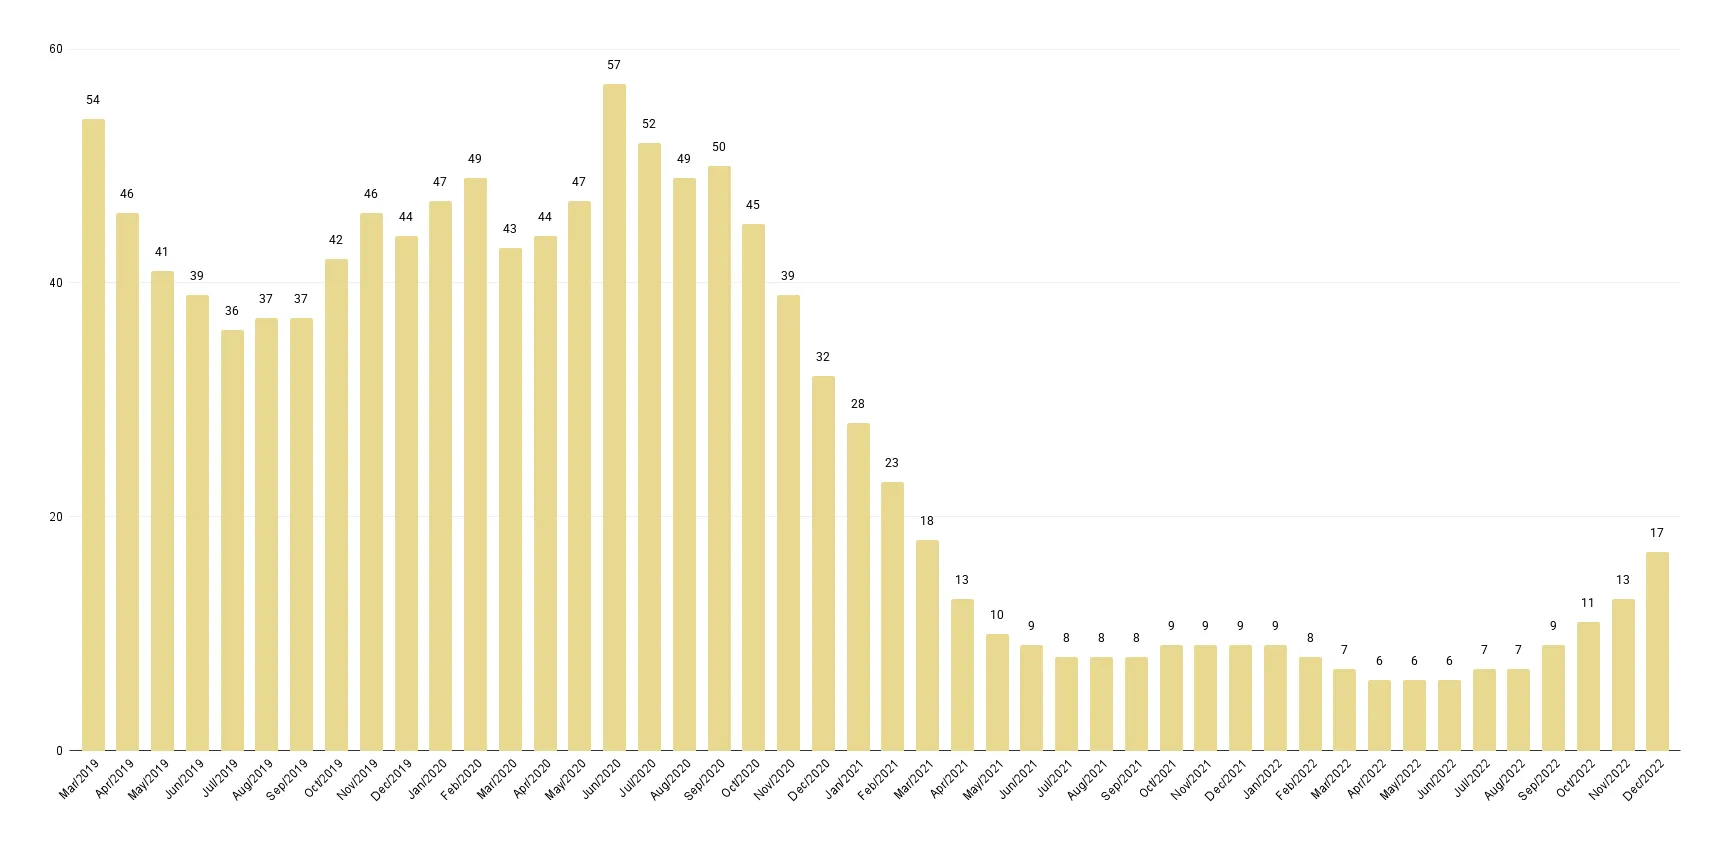
A balanced market has about 9-12 months of inventory. The months of inventory are calculated as the number of active listings + number of pending listings divided by the average number of deals in the last 6 months.
—Miami Overall Luxury Condo Market - Annual & Q4 2022 Conclusion
Buyers gain equal footing with temporary spike in inventory - Higher prices + lower days on market indicate good market health
With a booming start to the year and a record first quarter, it might seem that Miami's luxury condo market lost a lot of steam going into the second half of 2022. However, a closer look at the annual sales trends clearly shows that 2022 closed strong – reporting the second-highest sales in a year on record – behind 2021's record-setting sales by just 10.4%.
On an annual basis, most Miami neighborhoods under review posted a decline in sales growth. However, the Greater Downtown Miami area stayed strong, with Downtown (27%), Brickell (25%), and Edgewater (21%) leading in sales volumes and popularity.
With sales expectedly cooling off after 8 quarters of accelerated growth, the 12-month Sales Trendline was negative as the year came to a close. While this generally indicates a soft opening to the next quarter, we, as real estate experts, expect a good opening to 2023 considering the market enthusiasm we are experiencing before hitting high season this summer.
Regardless of sales activity slowing down over Q3 and Q4 2022, the overall Days on Market dropped in Q4 2022 and on a 2022-over-2021 annual basis. This shows that buyers and sellers were quick to come to a consensus, as deals generally closed quickly in Miami.
Owing to a seasonal slowdown plus sellers listing in anticipation of high season, luxury condo inventory increased quarter-over-quarter as well as year-over-year - closing the year with 17 months of inventory.
On the price front, the Price per Square Foot increased in a year-over-year review of Q4 2022 as well as 2022-over-2021 annual review – offering exceptional gains and value to sellers. The Price per Square Foot in overall Miami peaked to its highest ever of $948/SF in Q4 2022 – indicating a strong luxury condo market overall.
Buildings built 2000-2014 again recorded the highest sales volume out of all 3 segments (newly built to classic). And interestingly, the older luxury condo buildings of Miami (built before 2000) offered the highest value to sellers with a 10.3% increase in year-over-year prices – most likely due to developers opting for bulk buyouts of older properties to make way for new luxury.
With prices edging up, days on market low, and stable demand from domestic as well as foreign buyers, we expect the market to stay healthy and stable going into 2023. While current inventory levels may suggest a buyer-friendly climate, we expect that to soon level out as we hit high season – making way for a leveled playing field between buyers and sellers in this new year.
—Miami's Luxury Condo Market Prediction 2023: Where Does the Market Go From Here?
Going into 2023, and based on early January data, we expect the following factors to shape and influence the luxury condo market's performance in Miami:
Tax saver's haven and pro-business policies. By now, Miami has established itself as a legit tax saver's haven, pulling in major financial firms, wealthy families and deep-pocketed digital nomads from the likes of San Francisco, Los Angeles, and New York City. Also, business migration trends from the past two years have stayed strong. As real estate experts, we expect this domestic influx to keep fueling demand as we move into 2023.
Safe investment haven. With new research showing how, "Florida remains the No. 1 U.S. destination for international buyers, with an even higher foreign buyer share of 24% than the previous year." We do not expect a weaker Euro or other currency volatility leaving any kind of an impact on market demand, as Miami continues to be a safe haven for many foreign buyers looking to flee from the political winds or less stable markets back home.
Relief from higher interest rates. As interest rates have started to go down after peaking in October 2022, we expect more buyers and sellers to come off the sidelines in 2023. We further expect this to play to the advantage of buyers, as in they should expect to have a bit more selection and a bit less competition as inventory looks to normalize over the first half of 2023.
Miami's "brand" value. With the luxury market-leading Knight Frank Report ranking Miami as the second "prime" real estate market in the world, Miami has firmly established itself as a global city of choice for high net worth individuals and the finance sector. Couple that with a great quality of life, nature-dominated landscape, year-round lifestyle activations, and a brand-new wave of branded luxury condos such as Aston Martin Residences, Bentley Residences, or The St. Regis Residences, Miami has come to offer an unmatched luxury lifestyle backed by immense room for growth.
Inventory reducing to lower levels. Even as developers in Miami have been in overdrive, fast-tracking pre-construction projects, there are fewer deliveries scheduled in the immediate future (read next 2-3 years). This slower pace of delivery, coupled with a high season on the horizon, we expect Miami's luxury condo market to stabilize as a balanced market, as inventory moves off the market by summertime - offering equal opportunity to buyers as well as sellers to make the most of this progressive market in 2023.
Also, until then, buyers can look to make the most of this interim advantage that a spike in inventory has brought by grabbing their favorite spot by the ocean or branded, short-term rental income vacation home.
If you'd like more details on the data in our exclusive Condo Blackbook quarterly luxury condo market reports, please send us an email or call us anytime.
Love what you see? Share our blog and subscribe (see the subscribe link on the top menu) to receive authoritative and vetted Miami real estate market news in your inbox. Also, keep up with us on your favorite social media platforms. We're on Instagram, Facebook, and Twitter @blackbookproperties.